


Apex AIOps Provides Data Driven Server Management Decisions
Downlaod PDF
Introduction
Dell’s APEX AIOps Infrastructure Observability is an AI-driven, cloud-based application for proactive management and predictive analytics of Dell infrastructure, including PowerEdge servers, storage & networking. Predicting, preventing, and resolving incidents faster, and before they impact services availability. This application is part of a suite that also includes Application Observability and Incident Management, which simplifies operations by transforming high-volume alert noise and telemetry data into actionable insights. For PowerEdge customers, it can offer insights into the most critical server telemetry data, provides actions to remediate hardware events, advise on firmware updates, strengthens cybersecurity and consolidates multiple OpenManage Enterprise (OME) instances into a single portal for a unified view of servers across all locations. AIOPs Infrastructure Observability is included at no additional cost for systems under a ProSupport or higher Dell support contract.
From server metrics to recommendations
Focusing on server telemetry, AIOps Infrastructure Observability advanced anomaly detection and predictive analytics differentiate it from other monitoring and reporting tools.
Architecture
The advanced agent-free architecture of the Integrated Dell Remote Access Controller (iDRAC) in each PowerEdge server provides data such as CPU performance, thermals, and power consumption regardless of the operating system. Let’s take iDRAC9 as an example, to collect these server metrics, each iDRAC needs to have at least an iDRAC Enterprise, or OpenManage Enterprise Advanced license installed. Additional metrics are available if iDRAC Datacenter licenses are installed, which include NIC traffic, Fibre Channel traffic and GPU telemetry. Server metrics are compiled on individual iDRAC and are then collected on premise by OME. OME then consolidates and securely uploads this data to Dell’s APEX AIOps portal.
APEX AIOps Infrastructure Observability
Within Dell’s AIOps Infrastructure Observability, the performance page displays a summary per server on a dashboard view (fig 1). Each server has a tile & each tile highlights key server telemetry data.
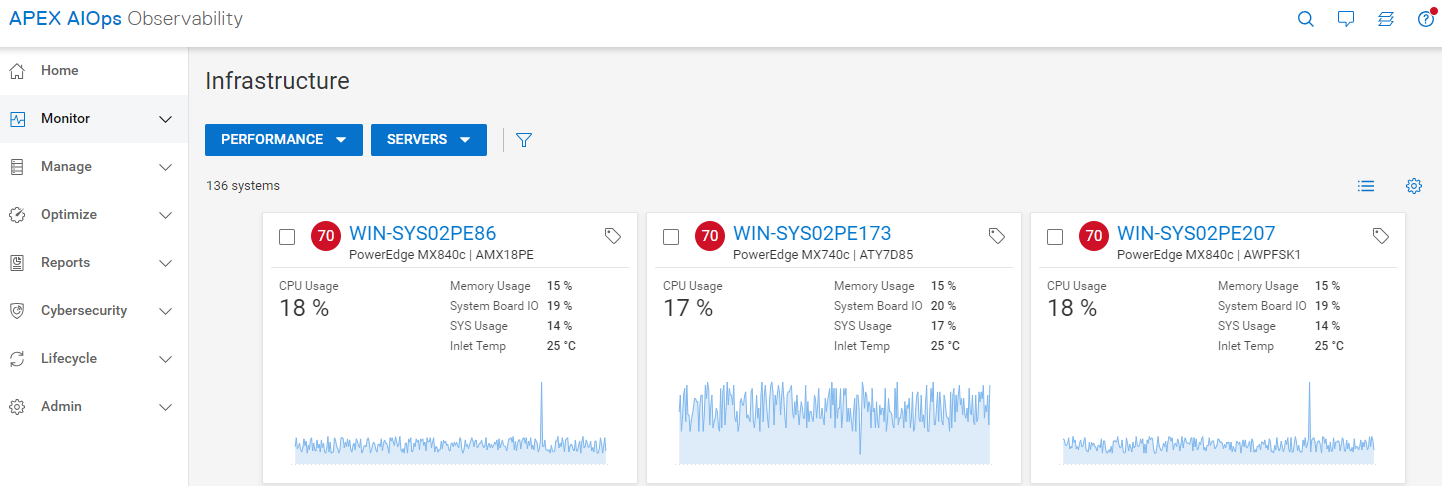
Figure 1 Server Performance – Summary Dashboard
Clicking on a single server, customers can view several ready-to-use server performance visualisations for significant metrics such as CPU usage, system thermals, and power consumption. This includes the ability to track and display historical seasonality data and anomaly detection. (fig 2). Additionally, customers can create custom graphs in the “report browser” feature (fig 3).
Anomaly Detection
Using historic data enables AIOps Infrastructure Observability to highlight irregular server behavior. Customers can view both actual historic data and statistically normal behavior for each server’s performance metrics, on the performance details page This behavior range is calculated using data from each specific server based on a rolling three-week analysis per metric. The metric charts visually highlight an anomaly any time the metric breaches the normal range . Anomaly detection is supported for key server metrics including CPU usage, system usage roll up, power consumption and various server thermal data points.
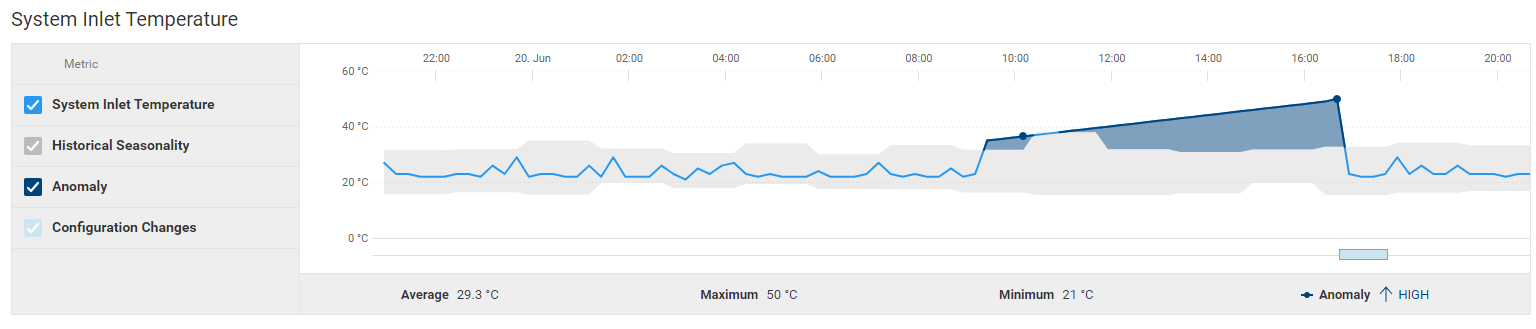
Figure 2 Server Cooling – Example “System Inlet Temperature” highlighting anomaly detection
Forcasting
AIOps Infrastructure Observability uses trending to provide future predictions, offering intelligent insights into the utilization of various server components. This helps identify potential problems, allowing customers to plan ahead which prevents bottlenecks and outages.
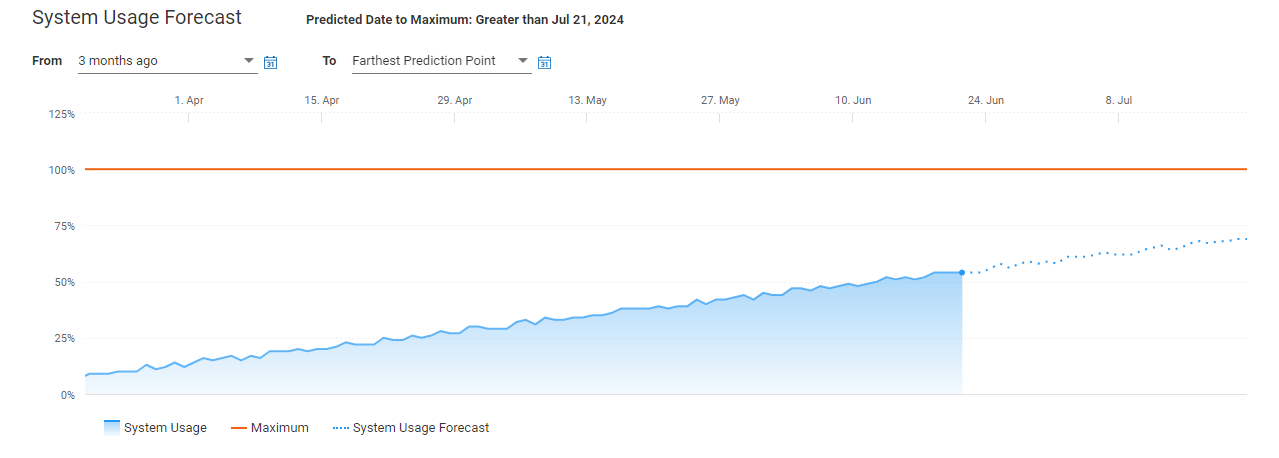
Figure 3 System usage forecast
Addational Custom Graph & Data Reports
AIOps Infrastructure Observability has options to create custom reports for over 50 different server metrics. Customers can also schedule these reports to be generated and be sent in emails on a daily, weekly or monthly basis. The data from these reports can also be exported as a CSV or PDF file.
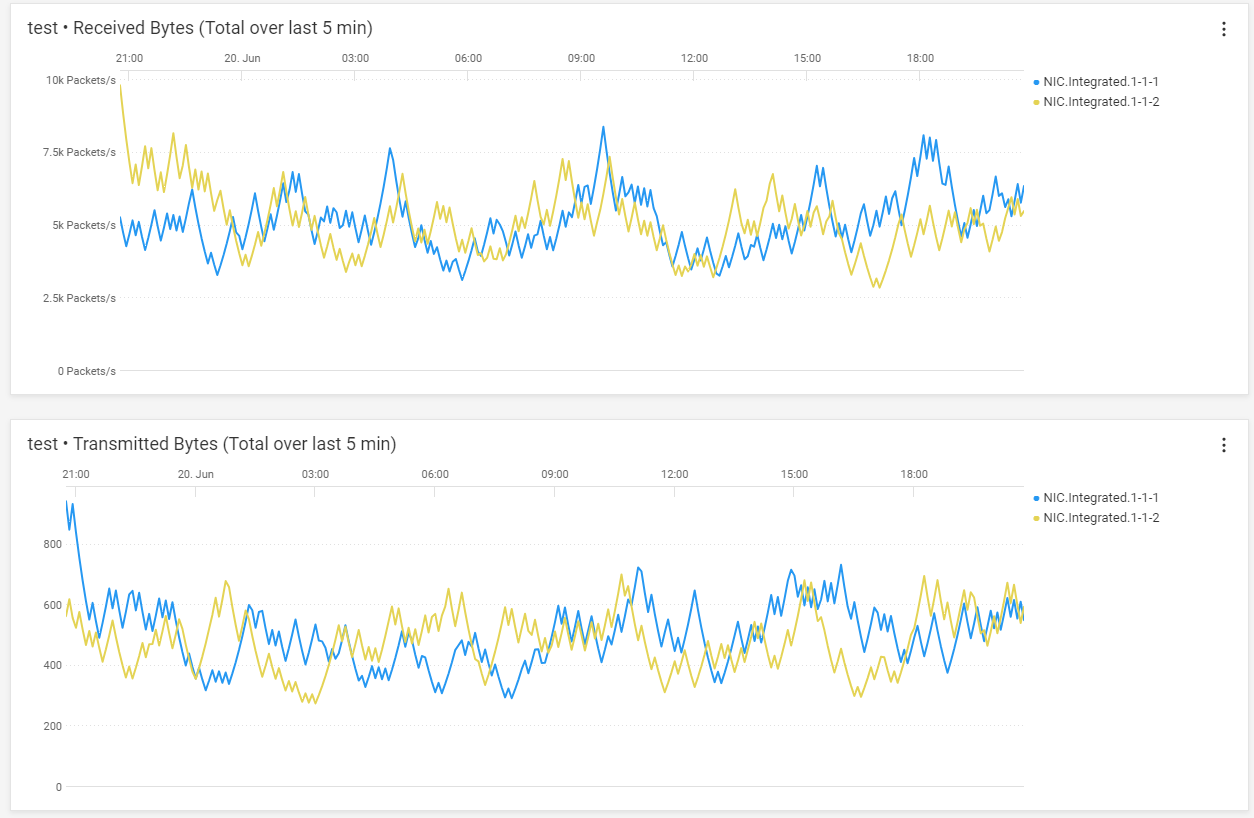
Figure 4 Server Performance - From Metric Browser – Example custom graph showing NIC data
Example Server Metrics
The table below shows a selection of some server metrics available. A complete list can be found in Appendix A of PowerEdge Metrics : An Overview.
Metrics | Sample Timing | License Required |
System Performance |
|
|
CPU Usage % 1 | Avg of 5 minute sample | OME-Advanced or Data Center |
IO Usage (PCI Express traffic) % 1 | Avg of 5 minute sample | OME-Advanced or Data Center |
Memory Usage (channels bandwidth ) % 1 | Avg of 5 minute sample | OME-Advanced or Data Center |
System Usage % (amalgamation of CPU / IO and memory usage) 2 | Avg of 5 minute sample | OME-Advanced or Data Center |
System Power |
|
|
System Power Consumption kWh | Avg, Min and Max of 15 minute sample | Enterprise |
System Thermal |
|
|
Temperature Reading Degrees C 2 | Avg of 5 minute sample | Enterprise |
Sys Net Airflow CFM 2 | Avg of 15 minute sample | OME-Advanced/ Data Center |
NICs |
|
|
TxBytes 2 | Total in 5 mins samples | Data Center |
RxBytes 2 | Total in 5 mins samples | Data Center |
FC HBAs |
|
|
FCRxKBCount 2 | Total in 5 mins samples | Data Center |
FCTxKBCount 2 | Total in 5 mins samples | Data Center |
1 – system performance data on 12 and 13 generation servers only require an iDRAC enterprise license
2 – iDRAC 9 only
Conclusion
Some customers say, “slow is the new down!” With in-depth visibility into key performance metrics of servers, storage, and networking infrastructure, AIOps Infrastructure Observability allows customers to stay on top of all their PowerEdge servers and other Dell infrastructure, giving them the ability to proactively manage, analyse, and plan. AIOps Observability can empower customer to efficiently navigate vast data volumes, gain essential insights to maintain uninterrupted business services and user experience. APEX AIOps’ suite three main capabilities are:
- Infrastructure Observability: AI-driven observability for optimizing Dell infrastructure health, cybersecurity and sustainability.
- Application Observability: AI-driven full-stack observability, integrated with Dell infrastructure for optimizing application performance.
- Incident Management: AI-driven incident lifecycle workflow for optimizing the availability of your digital infrastructure.
AIOps allows customers stay on top of all their Dell infrastructure, giving them the ability to proactively manage, analyse, and plan faster.
References
- Dell APEX AIOps for Intelligent IT Infrastructure Insights
- Dell APEX AIOps overview video
- PowerEdge Metrics in APEX AIOps Infrastructure Observability : An Overview
- Apex AIOps solution brief
- API Developer Portal
- OpenManage