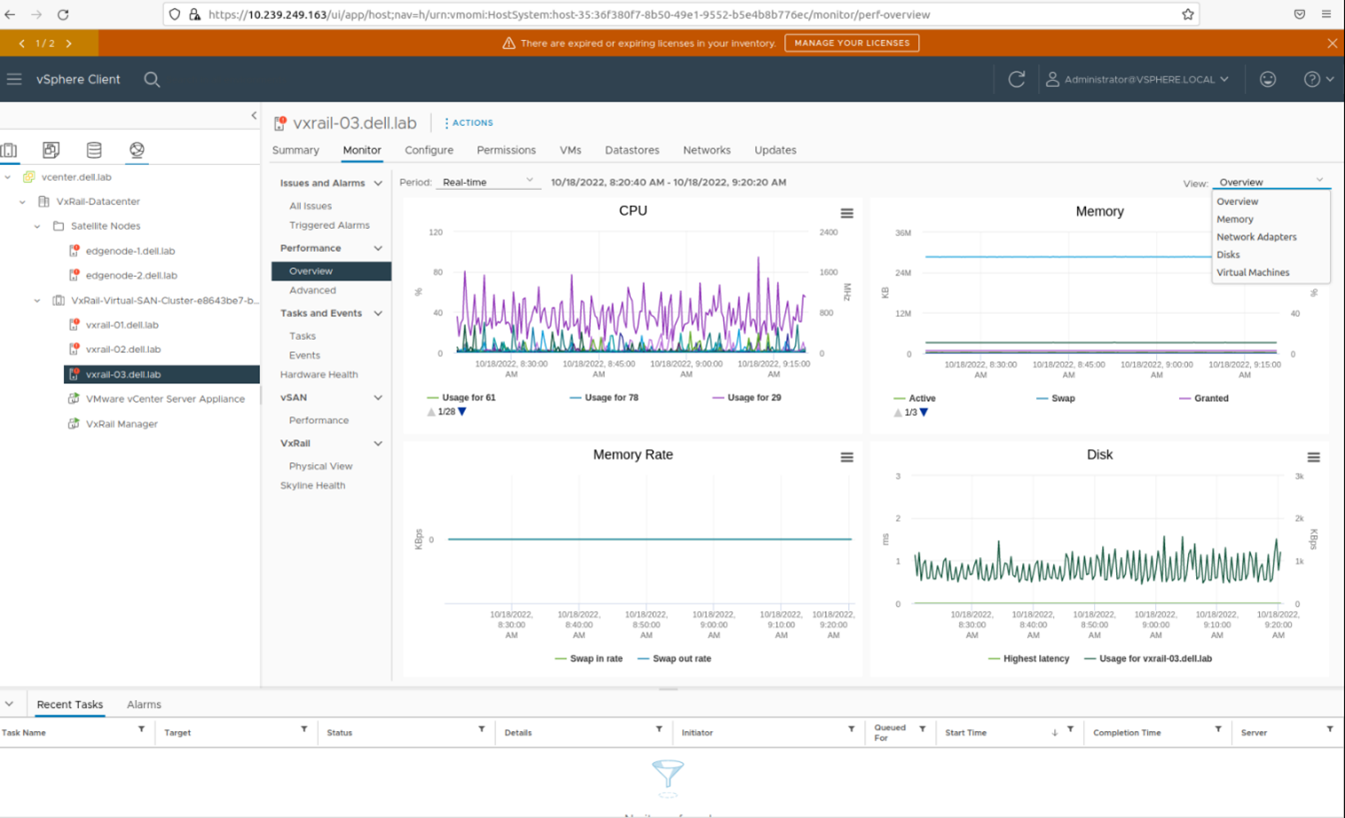
Currently, various systems management toolsets (such as the dashboard shown in the following figure) monitor both the Controller and edge nodes. Alerts are sent when a certain threshold is reached for the following monitored properties:
- System/Cluster Health
- CPU utilization
- Disk utilization
- Physical memory usage
- Swap memory usage
- Network—bytes transmitted
- Network—bytes received
- VMs/containers running on the edge node