
Dynamic thresholding
Dynamic thresholding
-
Applying a threshold specific to each query results at run time is an effective approach to improve the relevance and quality of the PSQN articles retrieved. While it may introduce some complexity in terms of additional overhead or latency, the benefits in terms of improved precision, user satisfaction, and adaptability to diverse troubleshooting scenarios can surpass these constraints.
As DTS supports multi-lingual input and semantic scoring, relevance scoring can vary significantly between language pairs. In addition, query specificity can vary by tool. Examples of possible queries include:
- “No boot”
- “due to battery swelling the touchpad part is floating”
Dynamic thresholds allow the system to adapt to these differences, providing more tailored and accurate results. The complexity and nature of queries can vary greatly, and dynamic thresholding is a diverse approach. It matches the complexity and commonality of the issues and the retrieved relevant PSQN articles for each query and product combination.
Statistical techniques such as Kernel Density Estimation (KDE) are employed to perform dynamic thresholding for each query-retrieved article. KDE is fitted to estimate the probability distribution of the semantic similarity scores for each retrieved PSQN article. The peaks and valleys are identified that represent the high-density and low-density regions in the curve, respectively. Change points between these peaks and valleys indicate the natural distinctions among the scores. These change points can be interpreted as cluster boundaries in the data indicating change in relevance of the retrieved articles.
The best threshold based on the KDE curve determines significant change points, percentile of scores, and more. An experimental retrieved PSQN result set and a validation set determine the best kernel parameters. These include the best kernel function fitting the data, and the best bandwidth capturing the internal structure and nuances of data.
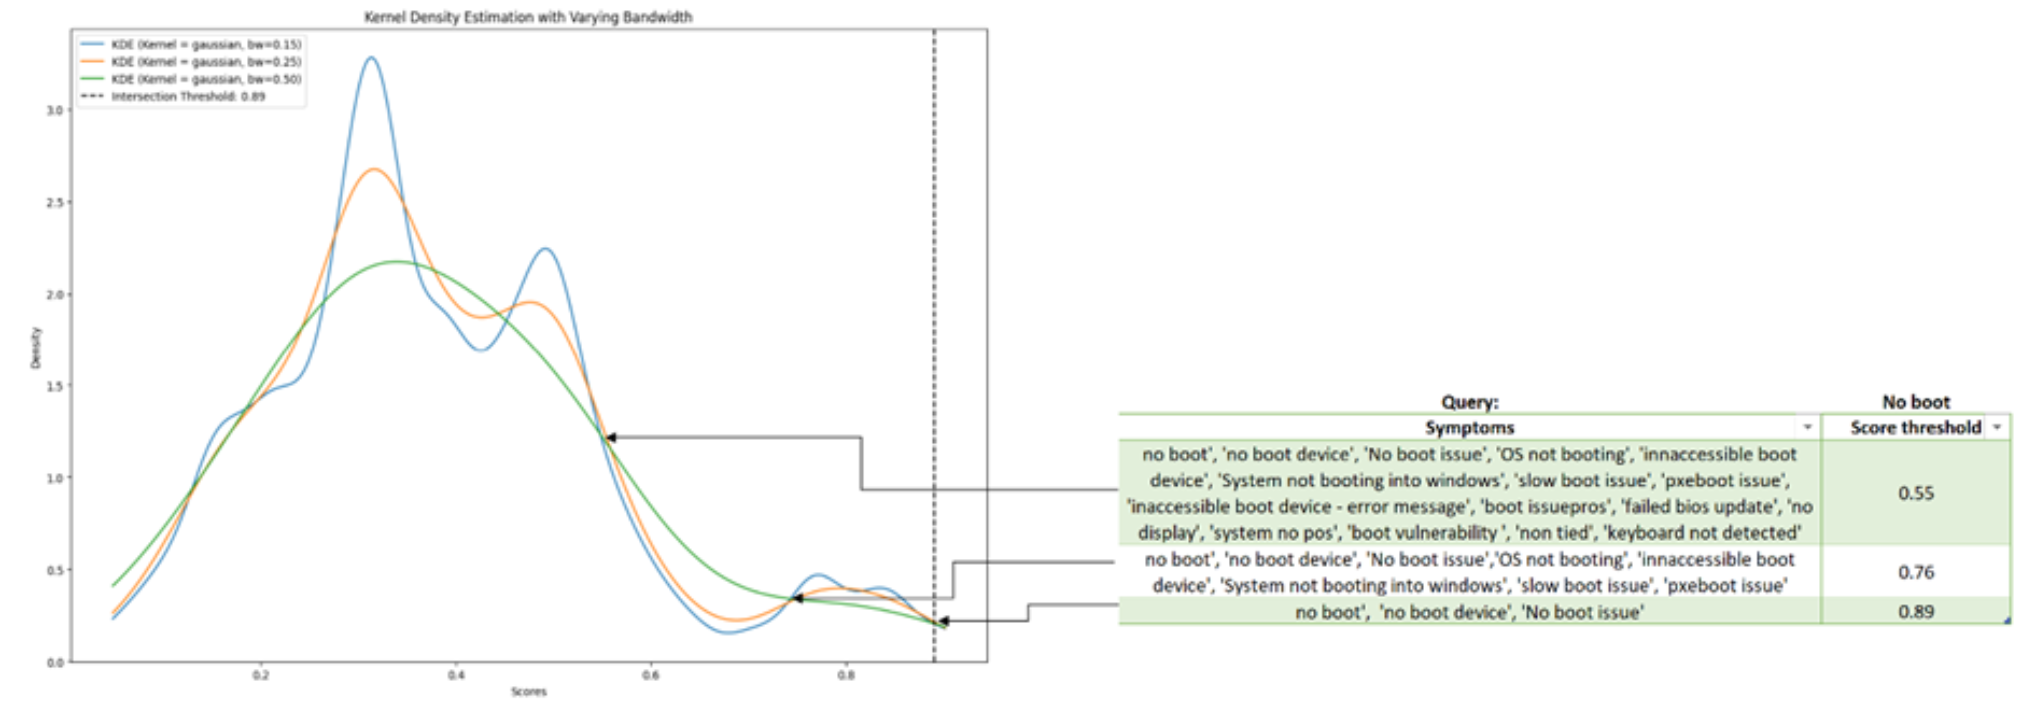 The plot below shows a gaussian kernel density curve of semantic similarity scores for a ‘no boot’ query. The probable thresholds based on the least distance between the density curves of different bandwidths and the respective symptoms can be found are tabulated in the image below. The dotted line shown in the plot corresponds to the best threshold which is chosen based on the least distance between the density curves across a bandwidth range.
Figure 3. KDE curves and associated candidate thresholds on example query results