
Compute workload
Compute workload
-
To demonstrate the AI use case in PowerFlex, we use kdb.ai to perform queries on structured crypto price data enriched with unstructured twitter data that has been asof joined on timestamp.These semantic similarity searches enable quantitative analysis on enriched data, revealing new insights. We also use RAG that uses LLM to ask time-specific queries without prefiltering.
To run the python notebook for an AI workload, follow these steps:
1. The first step is to download the data source required for this use case. We get the BTC price data from Kaggle and BTC Tweet data from Bitcoin Tweets.
Perform a pip install of the following libraries on the CO nodes to get all the dependencies for running the python notebook.
pip install kdbai_client matplotlib numpy ollama pandas pykx scipy sentence-
transformers wordcloud We also need Ollama to serve the LLM locally.
$ curl -fsSL https://ollama.com/install.sh | sh
$ ollama pull mistral
$ ollama serve
2. Next, import the required libraries in the notebook.
Import os
import time
import warnings
import random
import string
import json
import pyarrow.parquet as pq
warnings.filterwarnings(‘ignore’)
import matplotlib.pyplot as plt
import numpy as np
import ollama
import pandas as pd
import scipy
from sentence_transformers import SentenceTransformer
from wordcloud import WordCloud, STOPWORDS
from transformers import BertTokenizerFast
from collections import Counter
3. After downloading from the kaggle, the data is read in and prepared for use. The BTC price data is reorganized to show prices one, five, fifteen, thirty, and sixty minutes from a given minute in time. The wanted columns from the tweet data are selected, with data from 2021 and from users with over 100 followers selected. An asof join is completed to show the movements of the BTC price after a tweet is made. Finally, each tweet is embedded using a Sentence Transformers model. A sample code snippet is given below:
sentenceTransformer = SentenceTransformer(EMBEDDING, device=DEVICE)
tokenizer = BertTokenizerFast.from_pretrained('bert-base-uncased')
# Asof join performed to give price movements after each tweet
data = kx.q.aj(kx.SymbolVector(['dt']), tweetData, dfBTC).pd()
data['text'] = data['text'].str.decode('utf-8')
print("Data loaded and joined.")
min_text_length = 5
# Filter out rows with very short text
data = data[data['text'].str.len() >= min_text_length]
pattern = r'BTC Sentiment \(Price \$\d+\)'
data = data[~data['text'].str.contains(pattern, regex=True)]
data = data.reset_index(drop=True)
data = data.iloc[:LIMIT]
print("Generate vector embeddings...")
all_embeddings = sentenceTransformer.encode(data['text'], batch_size=BATCH_SIZE)
# Add the embeddings to the dataframe
data['vector'] = list(all_embeddings)
data['vector'] = data['vector'].apply(lambda x: np.array(x, dtype=np.float32))
print("Generate sparse vectors...")
sparse_vectors = [dict(Counter(y)) for y in tokenizer(data['text'].values.tolist(),truncation=True, max_length=512)['input_ids']]
# Add the sparse vectors to the dataframe
data['sparse'] = list(sparse_vectors)
data['sparse'] = data['sparse'].apply(remove_keys)
# Drop the unnecessary columns
columns_to_drop = ['user_followers', 'close']
data = data.drop(columns=columns_to_drop)
During the data preparation, when the embeddings are generated, and the data is processed, the notebook uses the NVIDIA GPU which scales to 100% utilization as shown in the following figure:
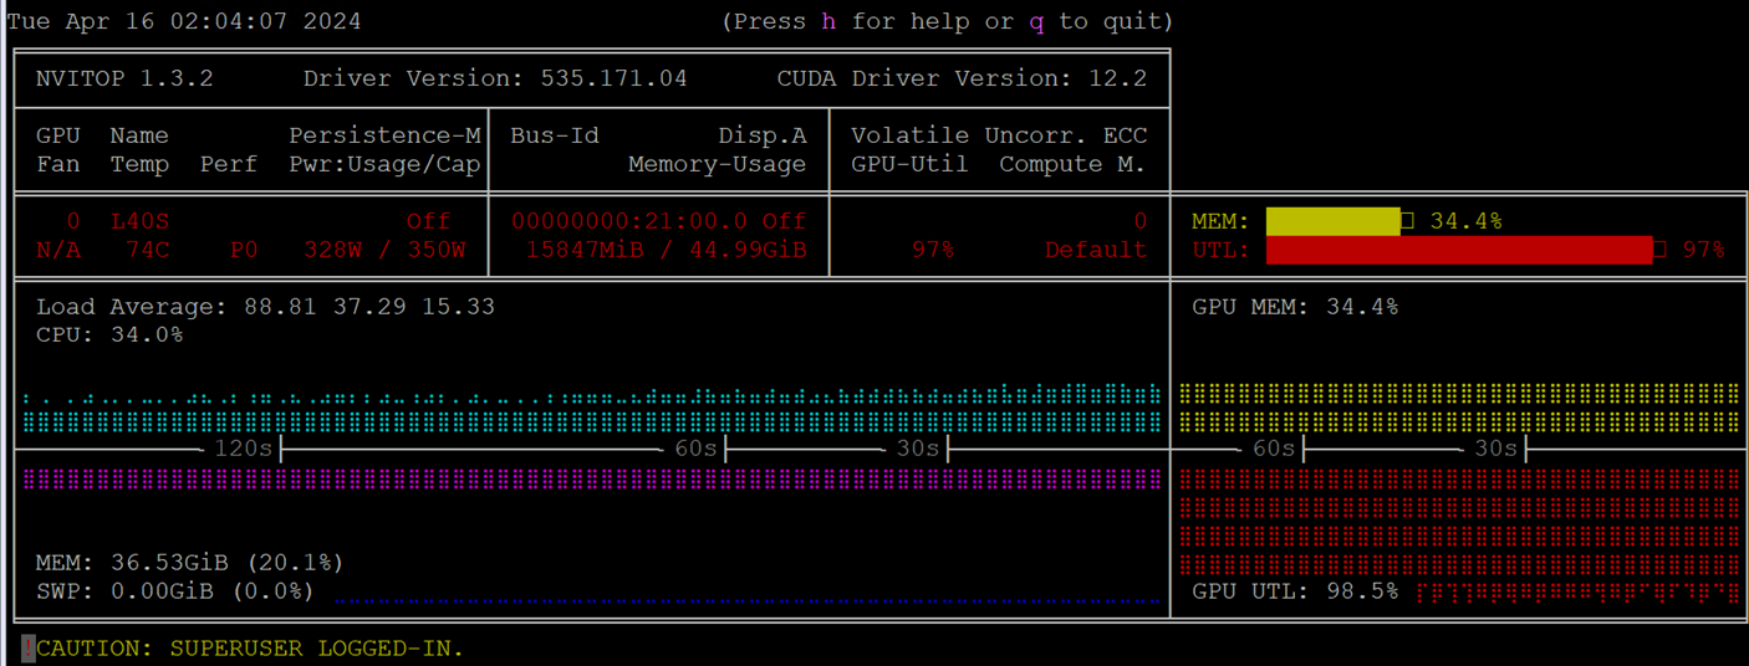
Figure 10. GPU utilization
4. Next, create a schema for the new table. In this instance we have created a schema that will accommodate semantic, keyword, and hybrid searching. We also use a flat index using a L2 distance, thus guaranteeing all K values are returned using exact matching. We then insert data in batches into kdb.ai as shown in the following code snippet.
%%time
#Batch insertion of data into the index is performed
from tqdm import tqdm
n = 1500 # chunk row size
for i in tqdm(range(0, data.shape[0], n)):
tweets.insert(data[i:i+n], warn=False)
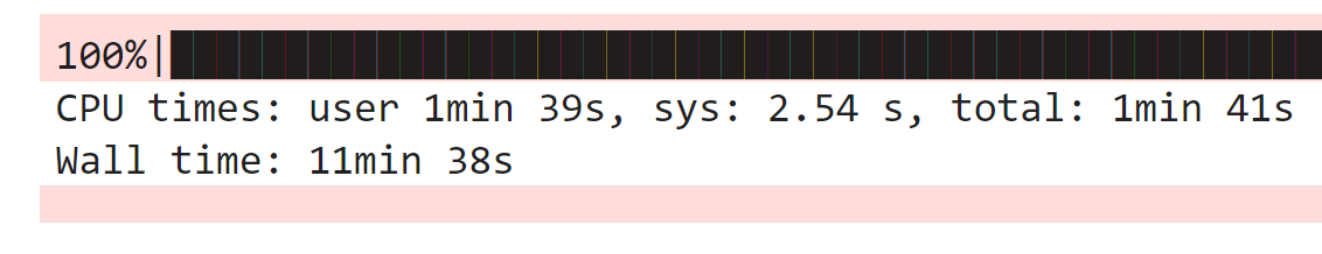 Figure 11. Time taken to insert tweets
The logical architecture of this AI use case is shown below:
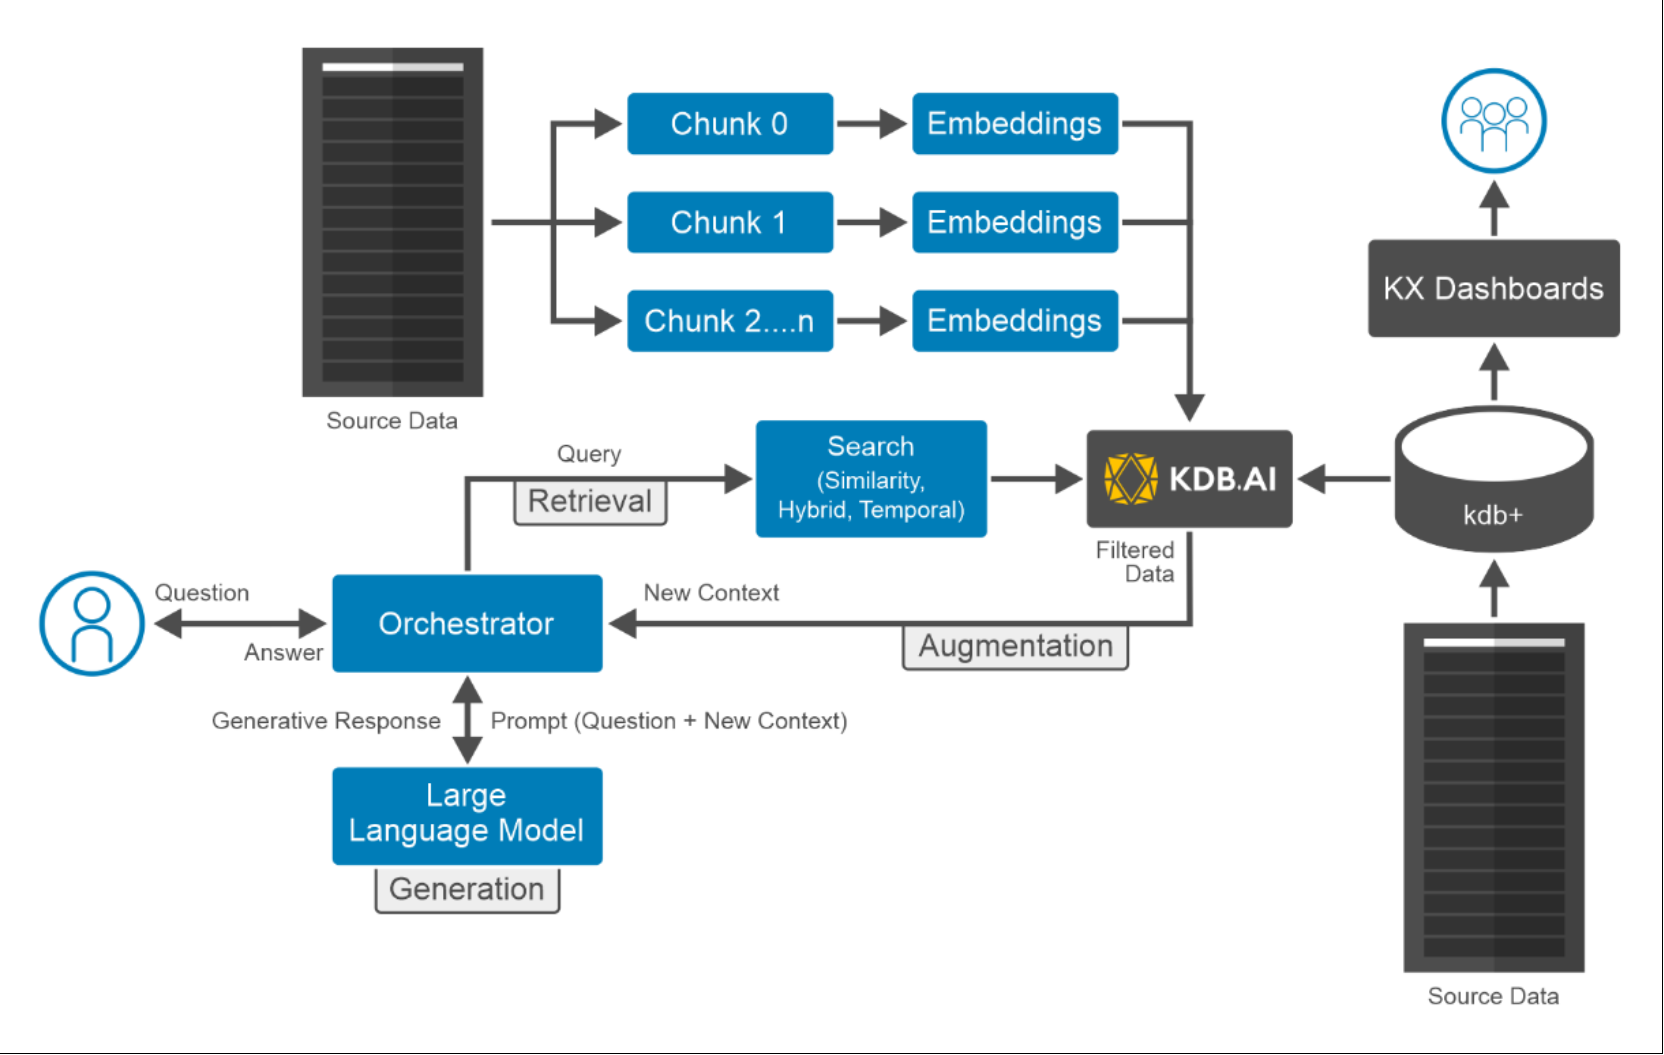 Figure 12. Logical architecture of running AI workload on PowerFlex
5. Perform a similarity search for BTC and NFT.
Note: Since we have used a flat index with L2 distance, all 20,000 matches are returned.
search1 = "BTC"
search2 = "NFT"
k = 20000
#Similarity search performed bringing back k neighbours
x = tweets.search(vectors=sentenceTransformer.encode(search1).reshape(1,-1).tolist(),
aggs=['t1', 't5', 't15', 't30', 't60', 'text'],
n=k,
index_options={'efSearch': 64})
y = tweets.search(vectors=sentenceTransformer.encode(search2).reshape(1,-1).tolist(),
aggs=['t1', 't5', 't15', 't30', 't60', 'text'],
n=k,
index_options={'efSearch': 64})
print(f'Number of results: BTC[{len(x[0])}], NFT[{len(y[0])}]')
6. To visualize the most frequent words in each group, we plot two world clouds.
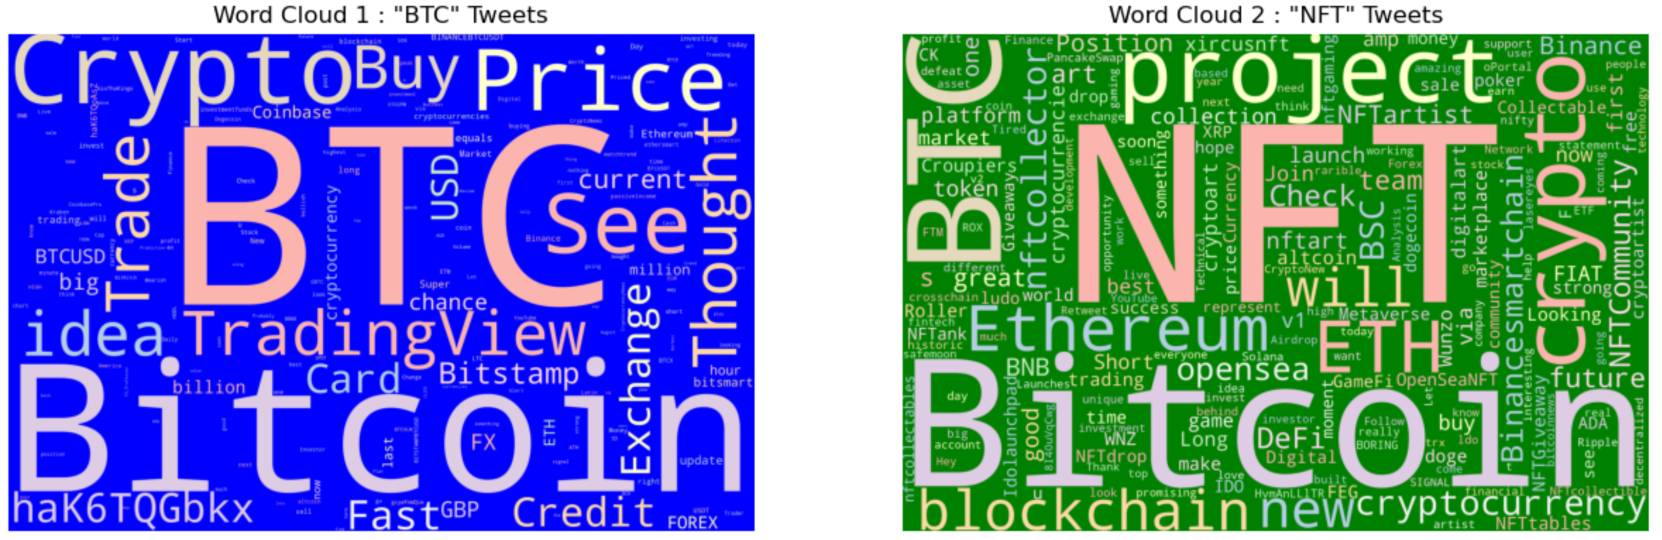 Figure 13. Word cloud of most frequently used words
7. We plot the histogram of bitcoin (BTCUSD) returns following tweets with two types of semantic meaning. We can see that the volatility is correlated with the subject matter in the tweet.
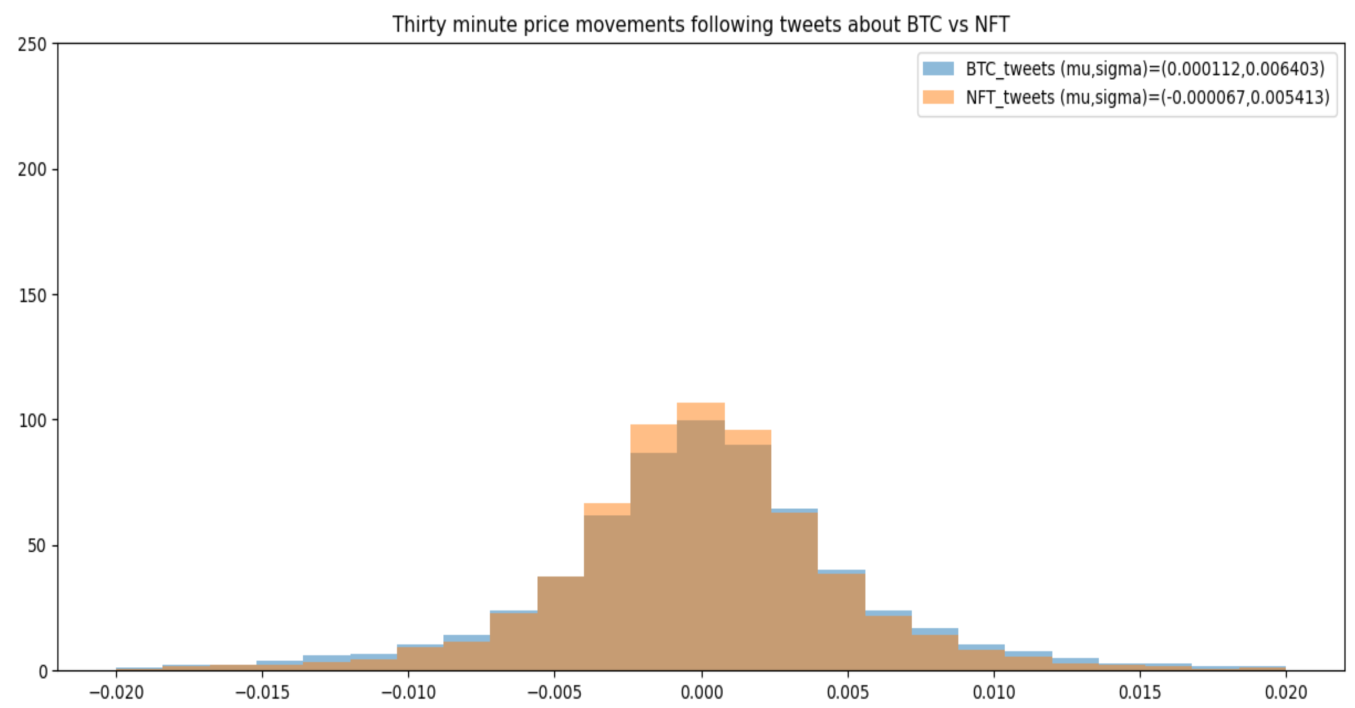 Figure 14. Histogram of bitcoin price returns v/s/ tweets
8. The BTC tweets tend to have higher returns but come with greater risk this is seen at all intervals. Here we plot the mark to market curve for the price action following the two different kinds of tweets. Volatility is consistently elevated following BTC tweets.
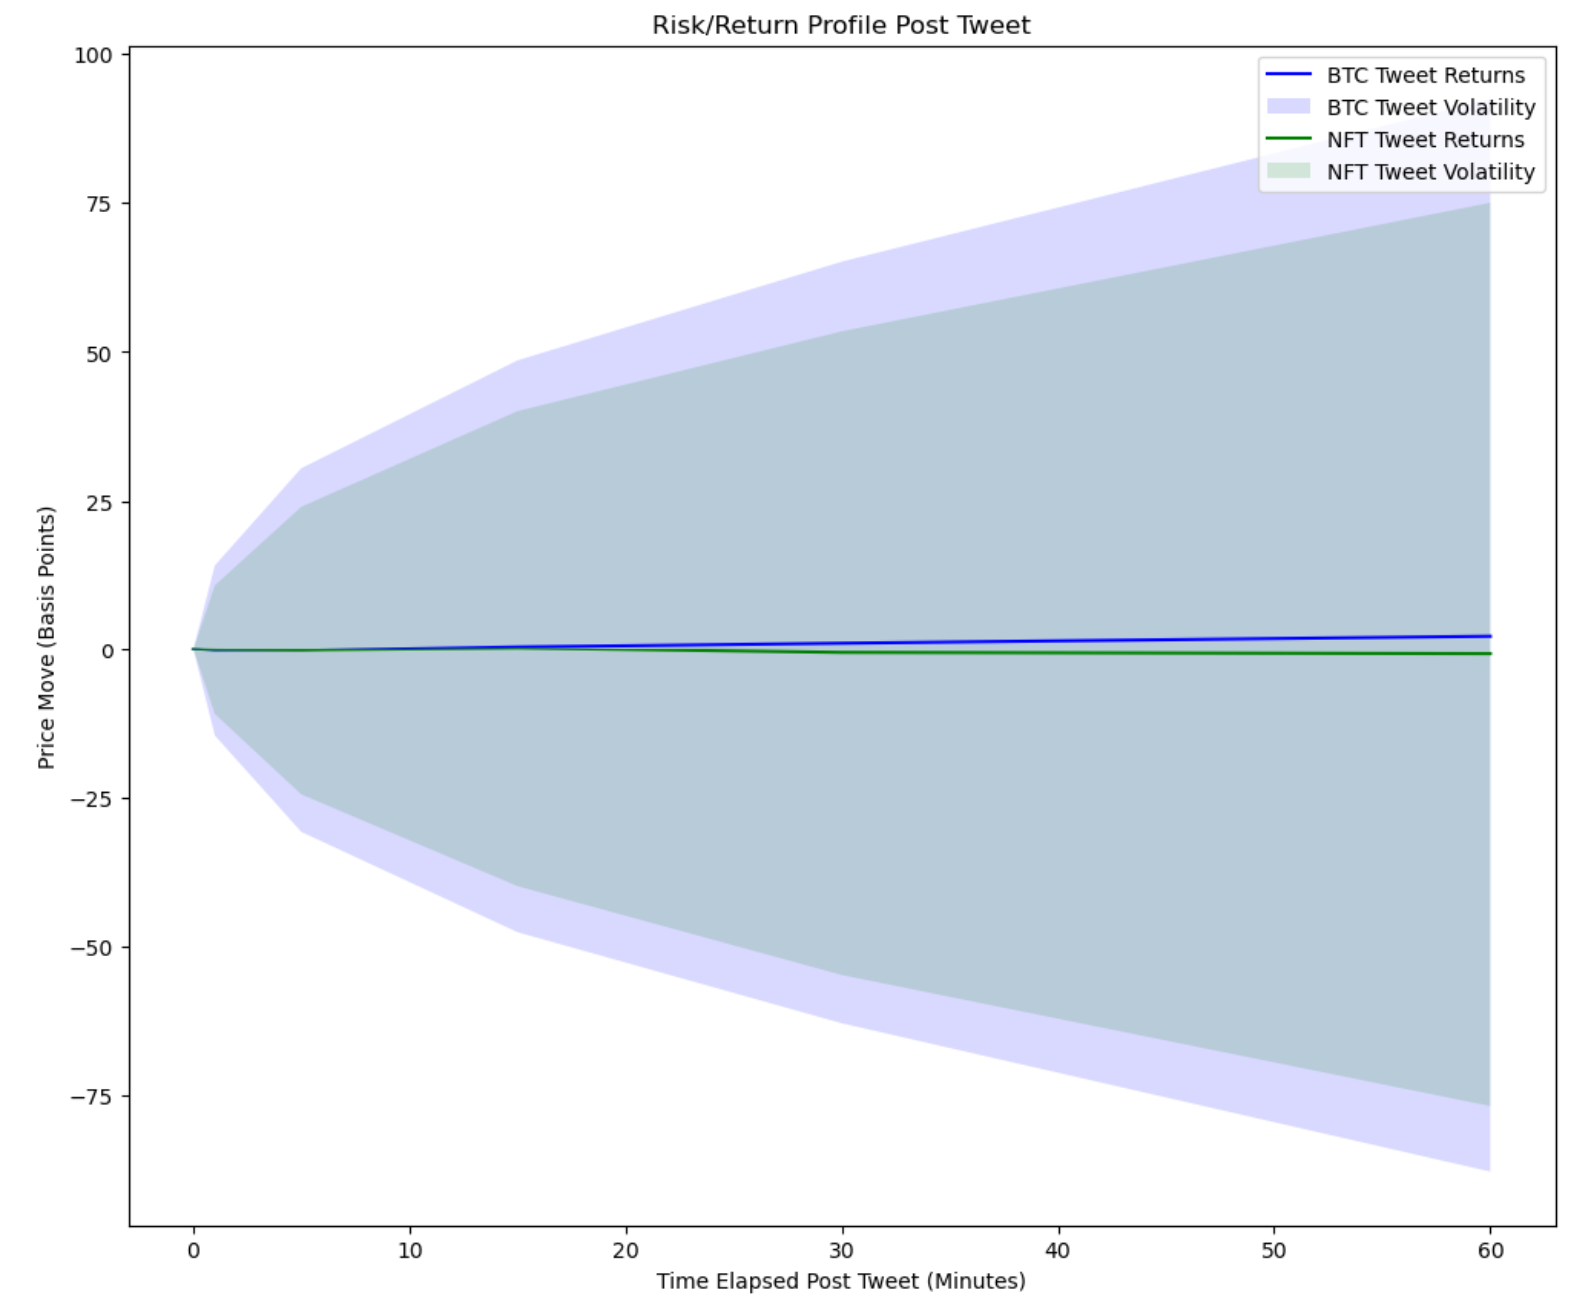 Figure 15. Risk/Return profile post tweet
9. To demonstrate RAG, we ask a time-specific query without pre-filtering. We will use KDB.AI as a retriever, but only pass the N nearest neighbors to consider. In this example, we rely on the LLM to interpret what 'in May and June 2021' means.
%%time
Q = 'What was the sentiment around BTC in May and June 2021 ?'
K = 20000
semantic_search_result = tweets.search([sentenceTransformer.encode(Q).tolist()], n=K)[0]
prompt = '''
CONTEXT:
%s
QUESTION: Answer using the context coming from Twitter. %s Use only the context, not your own knowledge.
ANSWER: ''' % ('\n'.join(semantic_search_result['text']), Q)
print(ollama.generate(prompt=prompt, model=LLM)['response'])
In May and June 2021, the sentiment around Bitcoin (BTC) on Twitter was mixed. Some users were optimistic, predicting that BTC would reach new highs, while others saw it as a bubble ready to burst. There were also concerns about market manipulation and regulatory crackdowns. Additionally, there were reports of large BTC transactions decreasing and Bitcoin's charts being "really exciting" with the price potentially breaking out to the upside. Some users also suggested that smart investors were not just buying dips but dollar-cost averaging. There was also a noticeable decrease in trading volume and buyers taking profits, which some saw as a bearish sign. Overall, there seemed to be a sense of uncertainty and caution among Twitter users regarding BTC's price movements during this period.
CPU times: user 2.1 s, sys: 176 ms, total: 2.28 s
Wall time: 39.7 s