
Performance test validation
Performance test validation
-
This section describes the tests that we ran on a MySQL database server to validate the performance on a bare metal server using PowerFlex storage volumes over NVMe/TCP. HammerDB, a popular benchmarking tool is used for the database performance tests.
Overview
HammerDB is installed on a VM deployed on VMware infrastructure. It is used to generate load on the three bare-metal SUSE Enterprise Linux 15 SP5 servers that have MySQL database application installed.
Each instance is populated with 2,700 warehouses (approximately 200 GB of data) running the schema build from HammerDB.
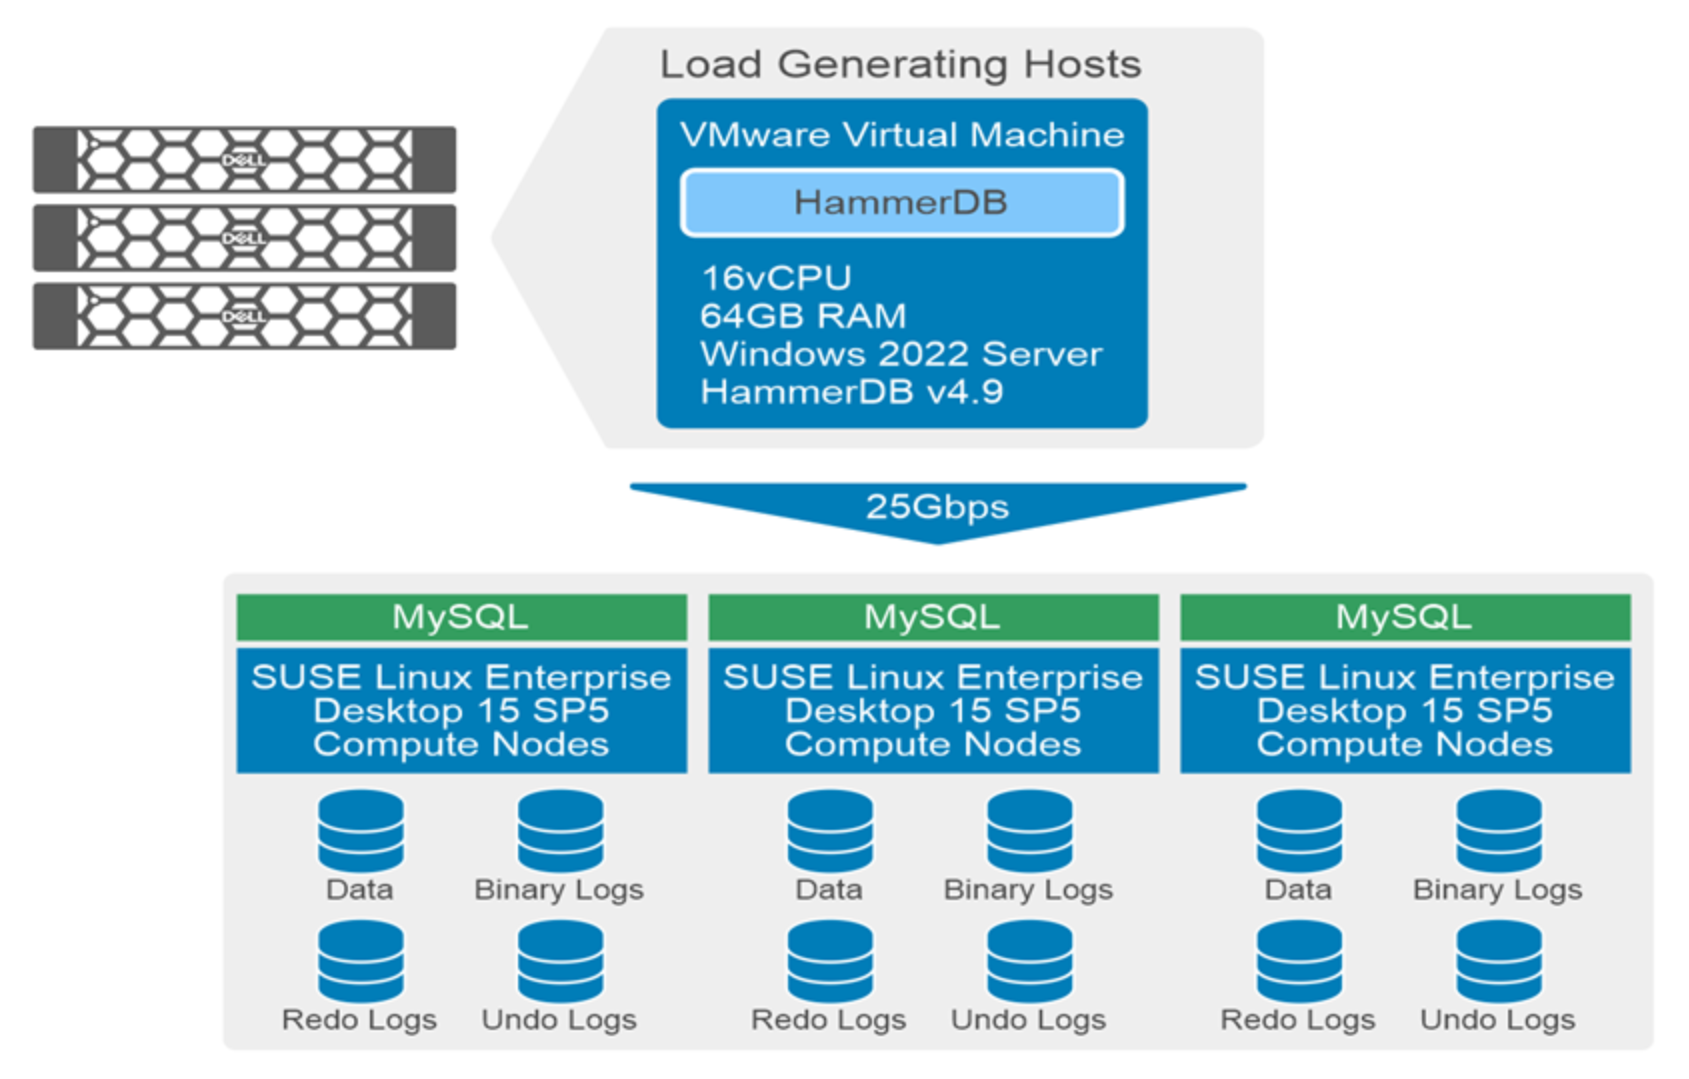
Figure 10. Load testing setup using HammerDBThe data is populated, and tests are performed by varying the number of virtual users from 50 to 300. Individual HammerDB instances are connected to each of the MySQL databases servers. The test lasts for approximately 18 minutes. The first three minutes are used for ramping up, and the remaining fifteen minutes are used to run the workloads. The workload is run on all warehouses simultaneously.
Benchmarking tool
HammerDB is benchmarking and stress testing software for many of the most popular databases, supporting Oracle Database, SQL Server, IBM Db2, MySQL, MariaDB, and PostgreSQL. HammerDB offers various features such as:
- Complex transactional and analytic workloads based on industry standards
- Bulk data generation and schema build to populate the database
- A UI and command-line interface that offers full automation
- Database insights with metrics and performance reports
We used HammerDB to run TPROC-C OLTP workloads on all our database instances.
For more information about HammerDB, see the HammerDB Documentation.
Test results
For performance validation, a mixed workload of read and write transactions, which is a more common database activity pattern for most applications, was run for a varying number of users. This test demonstrates the storage system ability to service a mix of read and write transactions while maintaining high IOPS and low latencies.
Performance of MySQL database
The following chart shows New Orders per minute (NOPM) and Transactions per minute (TPM) as seen in HammerDB:
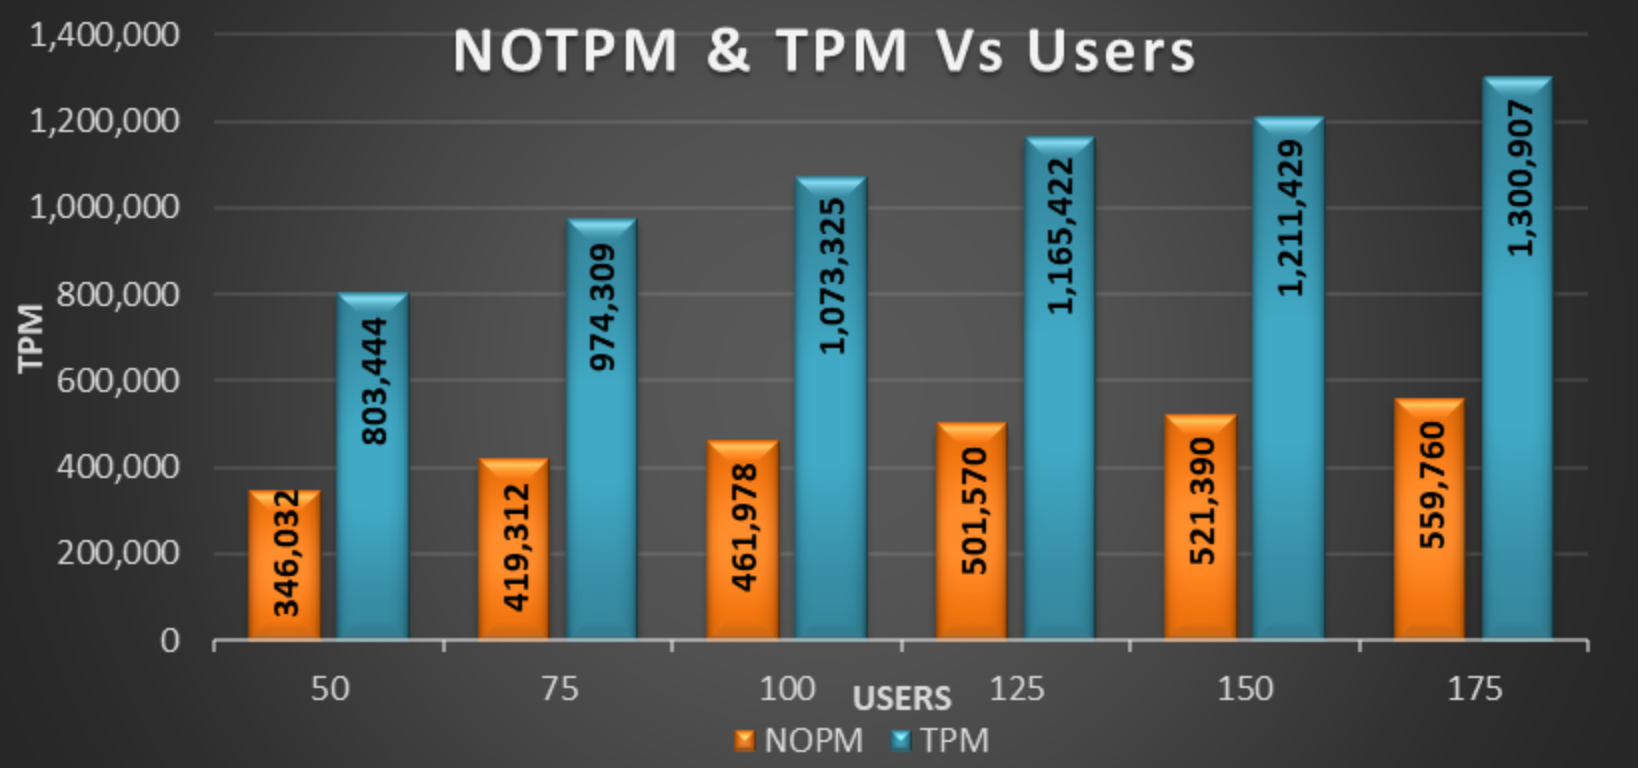
Figure 11. TPM increases with increased virtual usersAs seen in the chart, TPM of 1.3 million was achieved while the benchmarking was performed against 175 virtual users running queries on each of the database instances. Performance peaked at around 175 virtual users, after which the TPM did not see any substantial increase with the increase of number of users.
The following figure shows PowerFlex performance data seen during the tests:
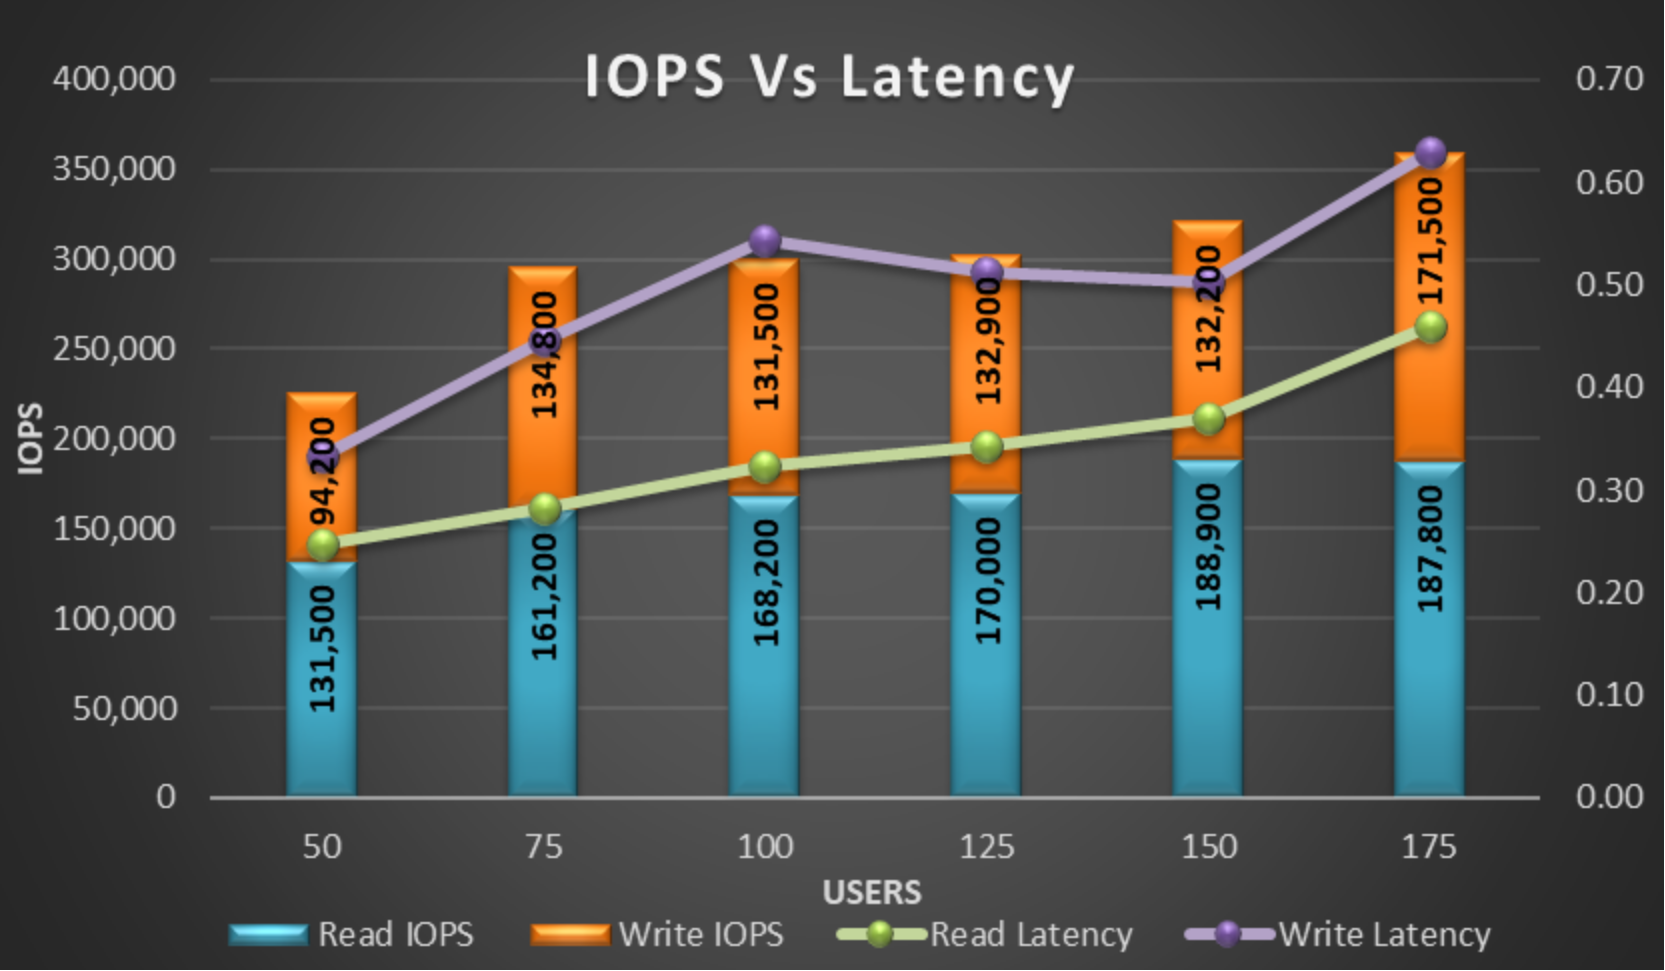
Figure 12. IOPs and LatencyThe IOPs and latency increase proportionally with the increase of virtual users. PowerFlex achieved a total of 350,000 IOPs with write latency of 0.6 milliseconds and read latency of 0.4 milliseconds. PowerFlex can be configured to achieve higher IOPs with an increase of additional compute nodes. There were no limitations or bottlenecks seen on the PowerFlex storage.
The following figure shows that compute node CPU use continues to increase with the increase of virtual users and reaches 60 percent use beyond which there is no significant improvements in TPMs.
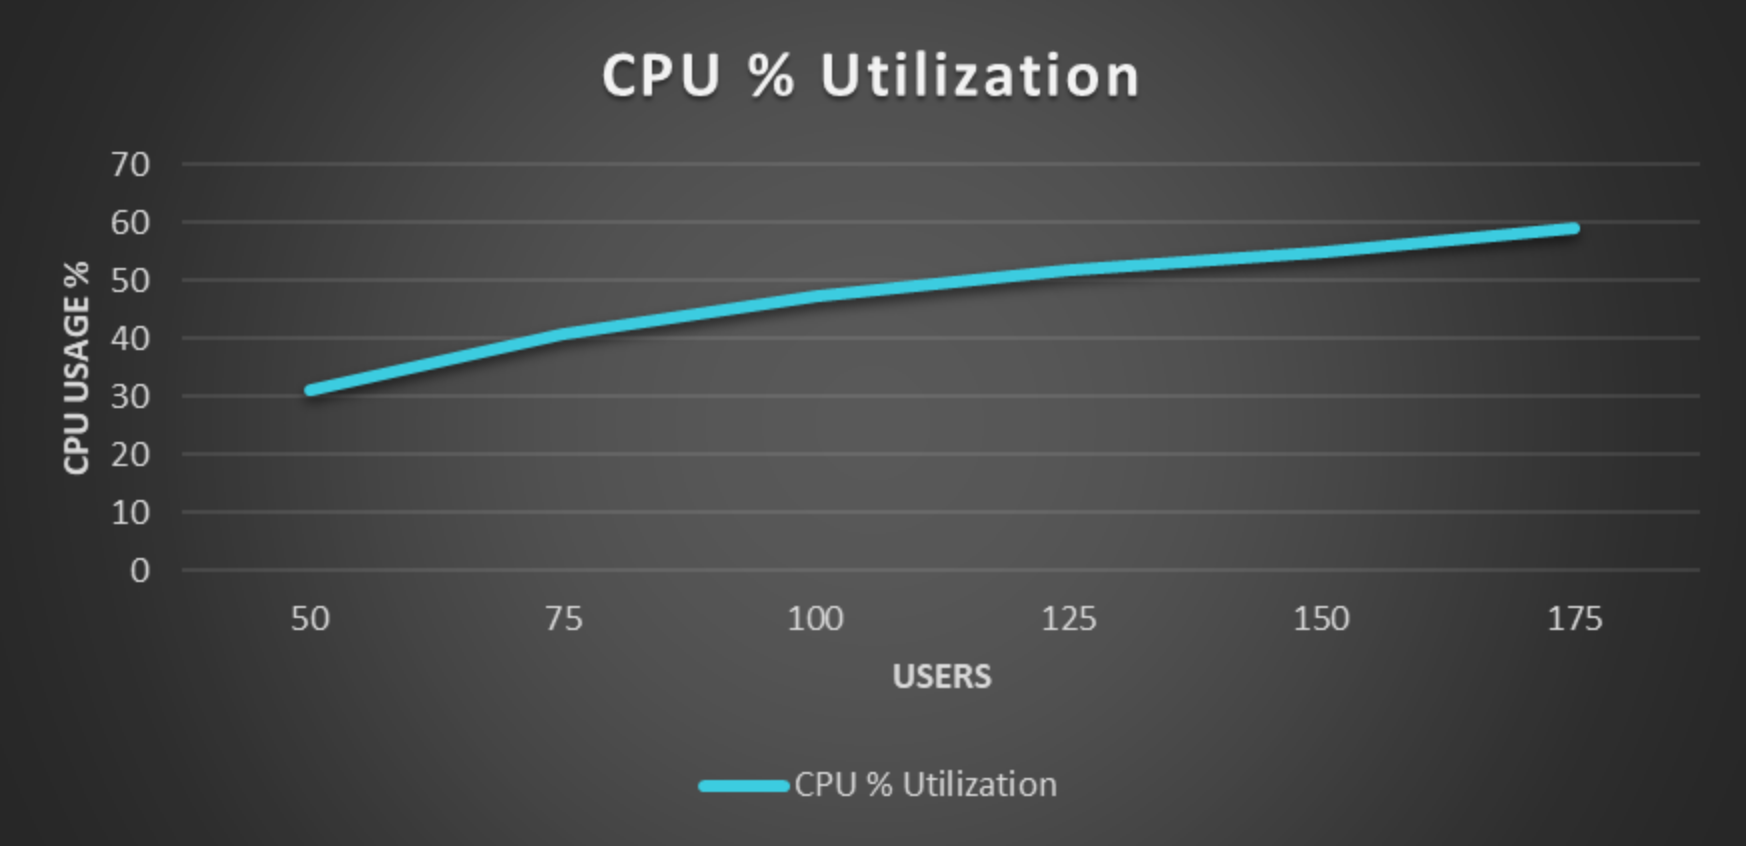
Figure 13. CPU usage