


VMware Visibility in CloudIQ

Introduction
In the last several years, there has been an increased desire for deeper visibility and insights into what is going on within customers’ data centers. Especially with wider adoption of AI/ML, demand for insight-driven outcomes has increased. Customers are looking to have a single pane of glass that has visibility into their infrastructure.
Benefits
One of the major benefits I see for customers who invested with Dell across our broad portfolio is that CloudIQ truly becomes that single pane of glass. It enables customers to integrate toCloudIQ using WebHooks and REST API with external tools and create actionable processes. One example would be integration with ServiceNow. The other benefit is the breadth of the insights based on AI/ML algorithms and our capability to not only be descriptive in our recommendations, but also become more prescriptive.
I can go on and on describing the benefits of CloudIQ, but in this blog, I would like to focus on the CloudIQ Collector. Although customers are accustomed to using VMware vCenter to look up configuration and performance details specific to Virtual Machines and vVols, with AIOps-based tools like CloudIQ, the goal is to bring this information together in a single management pane of glass. Customers using Dell primary storage solutions can leverage the CloudIQ Collector to bring visibility at the VMware Virtual Machine level inside the CloudIQ portal. I can see this capability enabling customers to use CloudIQ for the following use cases:
- See the end-to-end map making up the virtual infrastructure. This information includes the ESXi cluster, the ESXi host, the switch, the storage array, the datastore, and the virtual machine.
- Simplify troubleshooting. You will see later in this blog that having visibility at the entire end-to-end map allows customers to view performance impacts (IOPs, Bandwidth, Latency) as well as ESXi host-specific performance metrics.
- Leverage CloudIQ integration through WebHooks and REST API with external tools for notifications, alerting, reporting, and so on.
CloudIQ Collector
The Dell CloudIQ Collector is a VMware Open Virtual Appliance (OVA) using Open Virtualization Format (OVF) and is installed as a virtual machine that collects data from VMware environments, Dell Connectrix switches, and Dell PowerSwitch devices. The Collector retrieves information from the target objects (vCenter or switches) and sends the collected data back to CloudIQ using a Secure Connect Gateway. For VMware, the Collector communicates to vCenter by using the VMware API and requires a user with read-only privileges. For Connectrix and PowerSwitch devices, the Collector communicates to the individual switches using REST API and uses a nonprivileged user. A single collector can be used for VMware, Connectrix, and PowerSwitch.
The theme again is to provide overall visibility across different pieces of infrastructure to our customers. The CloudIQ Collector Overview white paper does a nice job on how to implement the Collector, but here I will go more into the functionality and what data we present to our customers.
Once the CloudIQ Collector is installed and fully configured, VMware data will appear in CloudIQ within 24 hours and will be accessible within the following views in the CloudIQ portal.
- On the Virtualization page:
- Monitor > Virtualization
- On a system inventory page:
- Monitor > Systems (click an array, click the inventory tab, click the virtual machines tab)
- On a hosting storage object (Pool, LUN/Volume, or Storage Group) inventory page:
- Monitor > Systems (click an array, click the inventory tab, click the pools tab, click a pool, click the virtual machines tab)
- Monitor > Systems (click an array, click the inventory tab, click the storage groups tab, click a storage group, click the virtual machines tab)
- Monitor > Systems (click an array, click the inventory tab, click the storage tab, click a storage object (LUN/volume/file system), click the virtual machines tab)
- On a host or server properties page:
- Monitor > Systems (click an array, click the inventory tab, click the hosts or servers tab, click a host, click the virtual machines tab)
- Through global search
VMware visibility in management tools
Traditionally customers with Dell’s primary storage have had a certain level of visibility into their VMware environment. It typically was accomplished by linking VMware vCenter with our management tools for products like PowerMax, PowerStore, and Unity XT. For reasons of keeping this blog concise, I will focus on PowerStore, but as mentioned above, other Dell primary storage products have visibility into the VMware environment from their respective element managers.
The Dell PowerStore management UI is called PowerStore Manager. Integrating PowerStore Manager with VMware vCenter is straightforward. If integration is successful, you will see the status turn to green and show OK.
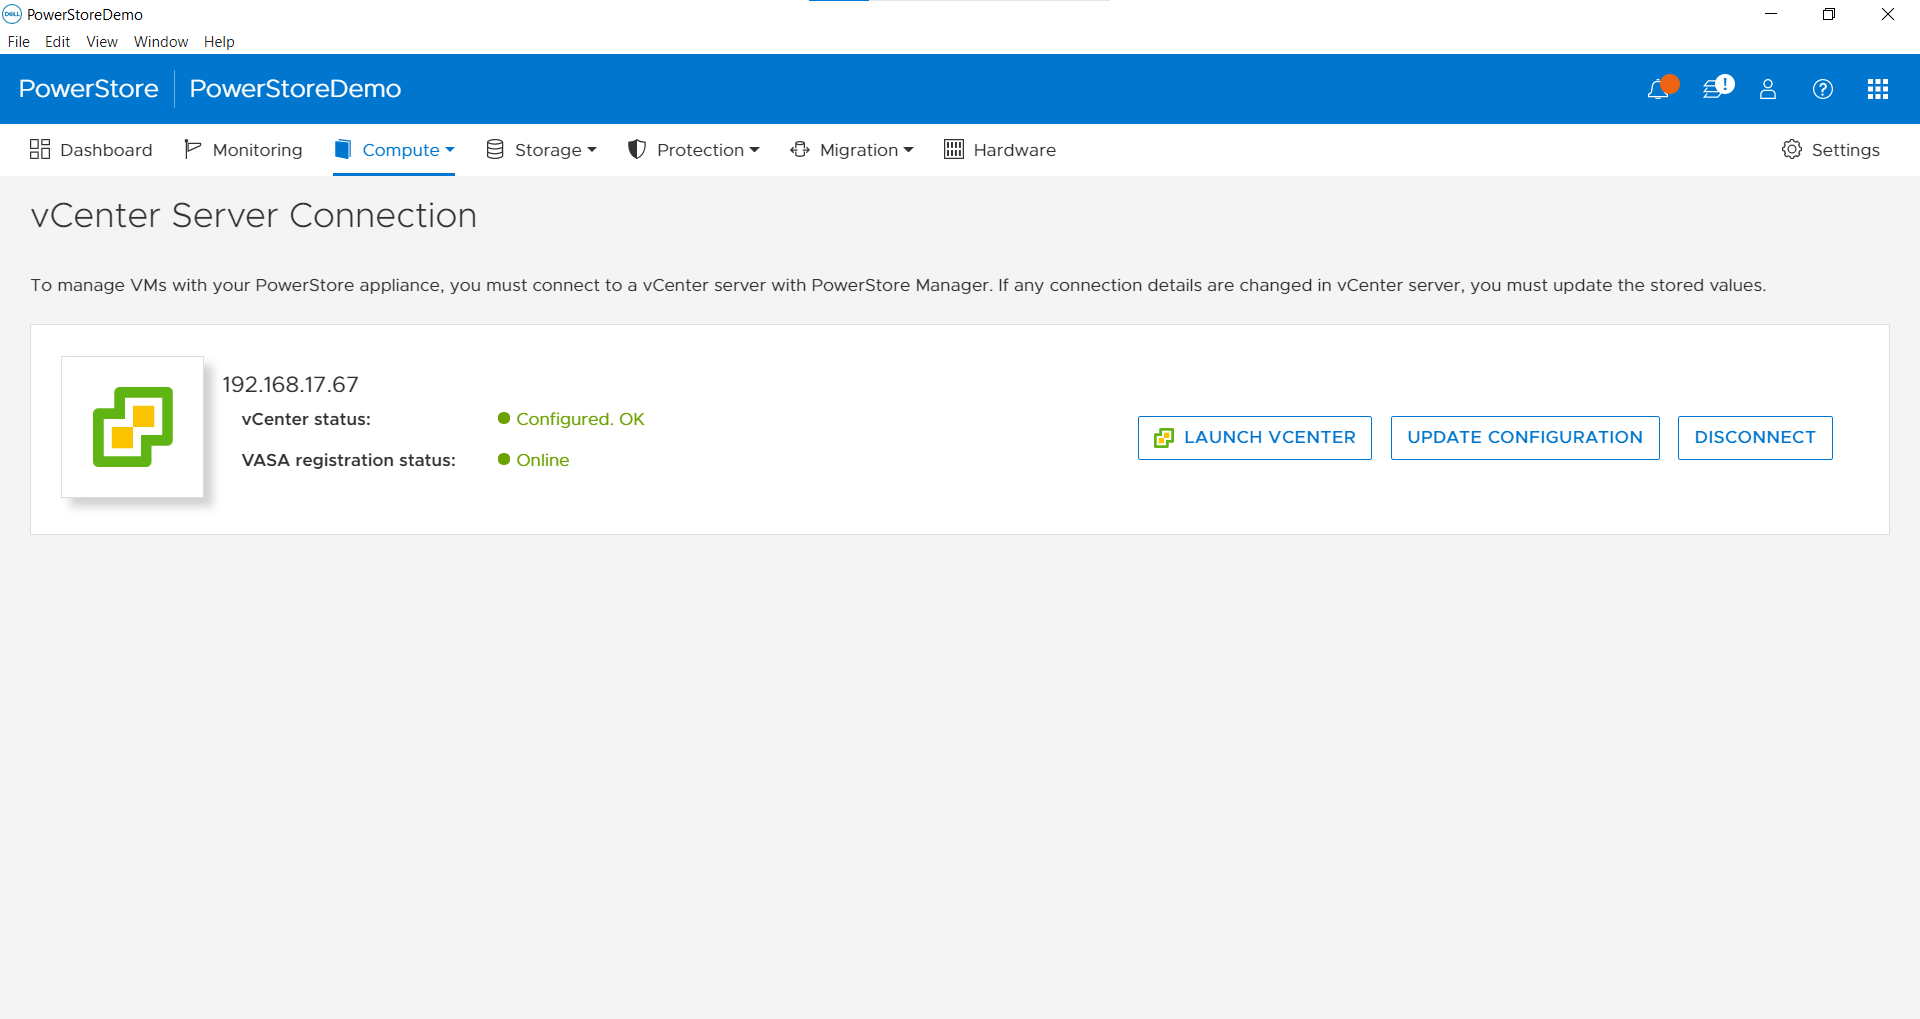
Figure 1. Registered vCenter in PowerStore Manager
This integration with vCenter will populate the Virtual Machine tab in PowerStore Manager.
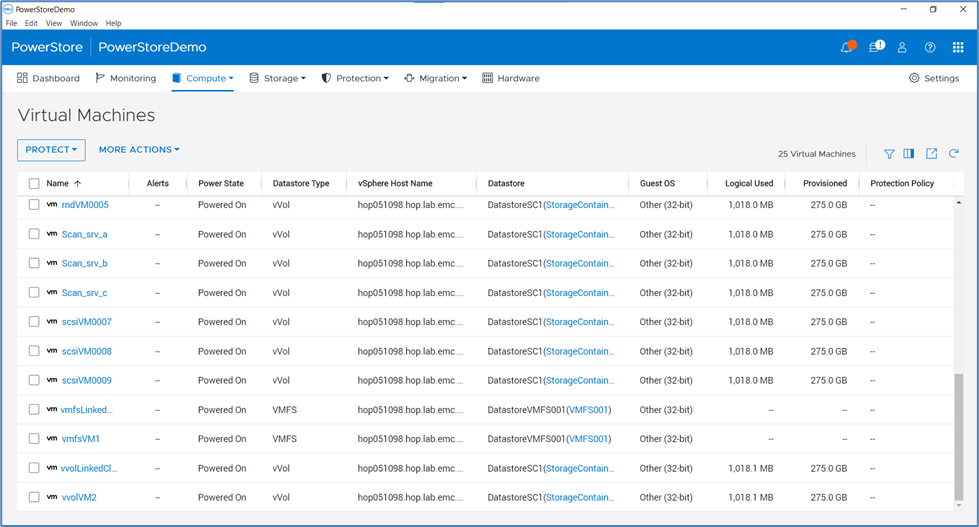
Figure 2. Virtual Machines page in PowerStore Manager
As you can see, we support vVol, VMFS, and NFS based virtual machines. You can also expand the view by adding additional columns by clicking “Show/Hide Table Columns” on the right side of the screen.
The virtual machine names column allows users to click each virtual machine and see additional details.
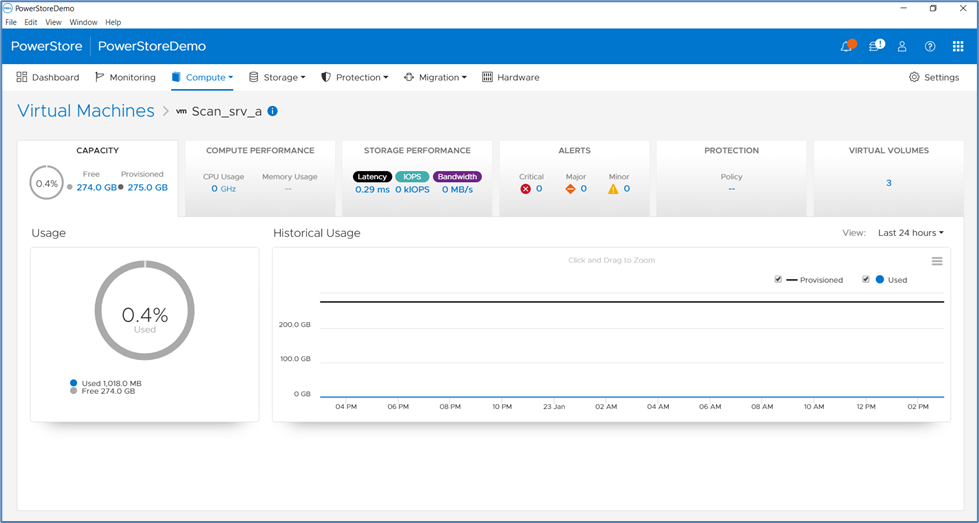
Figure 3. Virtual machine details
The above image demonstrates a detailed view of a vVol virtual machine. You can navigate through multiple tabs that show additional and deeper details, such as performance and storage-related metrics, data protection policies applied, and so on.
The other integration point you can explore is the datastore a virtual machine resides in. This comes in handy when customers need to troubleshoot a specific issue, or simply map out the components. A PowerStore administrator can trace the virtual machine directly to either Storage Container, VMFS block LUN, or an NFS-based datastore, without leaving the virtual machines view of the PowerStore Manager.
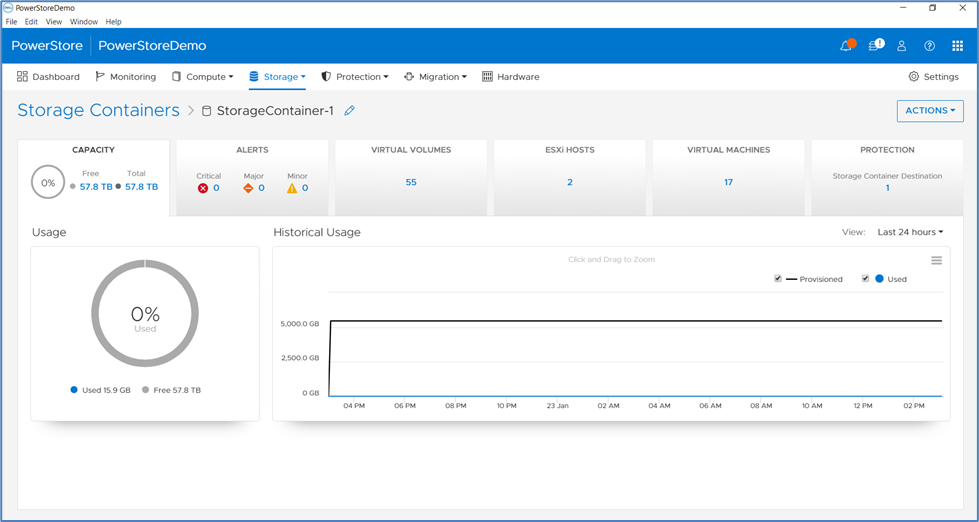
Figure 4. Storage container details
In the above image, I selected a Storage Container that holds one of the vVols. Once again, you see a consistent view, with multiple tabs allowing you to easily navigate and look up additional details.
VMFS or NFS based virtual machines follow the same logic. We collect and present slightly fewer details than vVol based virtual machines, but this is where CloudIQ Collector supplements this view.
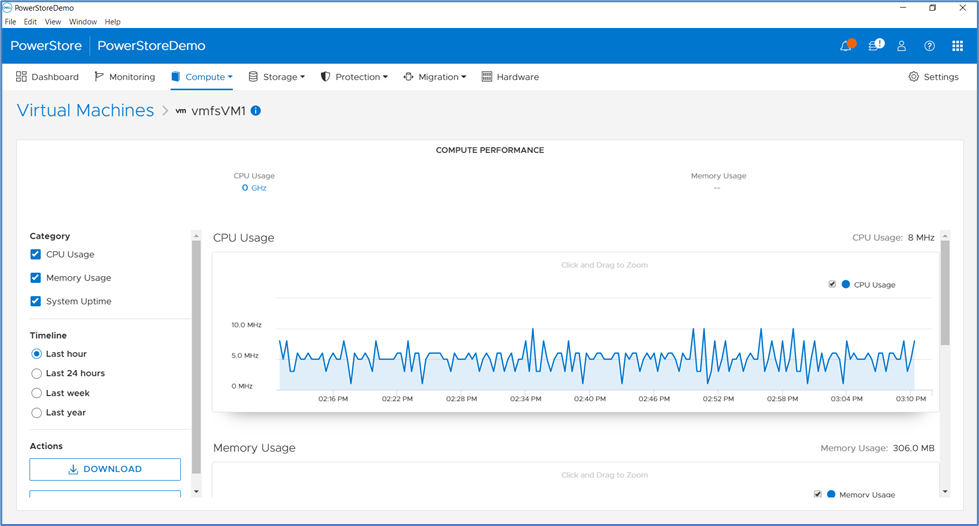
Figure 5. VMFS virtual machine performance chart
VMware visibility in CloudIQ
I have been guiding all my customers to embrace CloudIQ over the past several years. And although CloudIQ is provided to customers as a Software-as-a-Service application, the CloudIQ Collector is one of the elements that will need to be installed inside the customers’ data center to monitor VMware, Connectrix switches, and PowerSwitch devices.
Logging in to CloudIQ is based on the customers’ accounts registered with a Dell support contract. In addition to this, customers can leverage Role-Based Access Control (RBAC) implemented within the CloudIQ portal.
Once logged in, customers can explore the categories shown on the left side of the CloudIQ portal. The categories that we will be focusing on in this blog are under the ‘Monitor’ category.
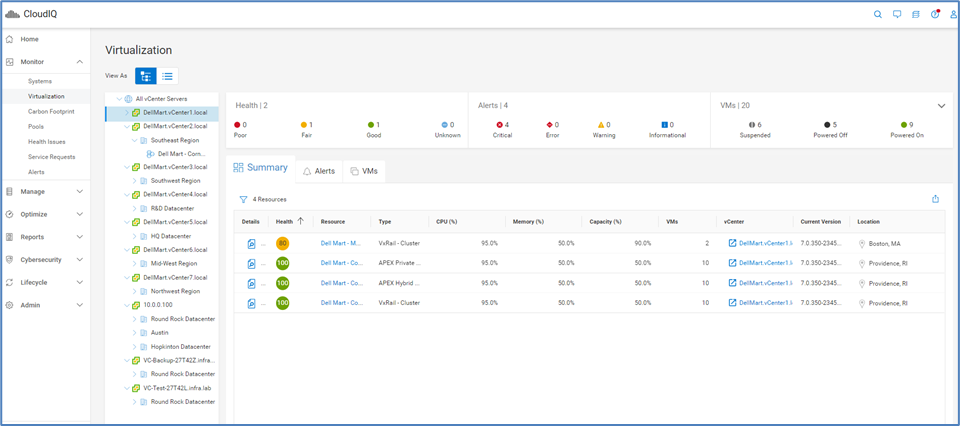
Figure 6. Virtualization View in CloudIQ
The Virtualization view enables you to view and manage components such as the vCenter, data center, and clusters using the tree view and the table view. It also displays information about each VMware vCenter server in the system. For those customers who use Dell HCI solutions like VxRail, and Dell primary storage products, like PowerStore, or simply a VMware ESXi environment managed by a vCenter, this view will have a consolidated view of all these environments.
Across the top, customers can see a quick snapshot of the overall status of the environment.
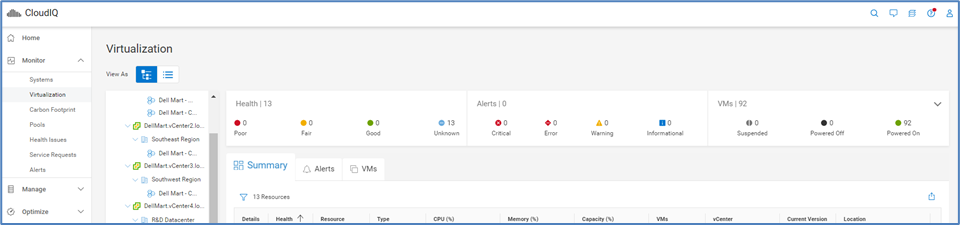
Figure 7. Summary banner
The navigation panel on the left shows you all vCenters with their respective clusters and data centers. Customers can browse through the list and select a particular cluster. As the image below shows, you can start zooming in on each virtual machine listed under the VMs tab. The areas I highlighted below are hyperlinks and allow customers to get additional details for each virtual machine.
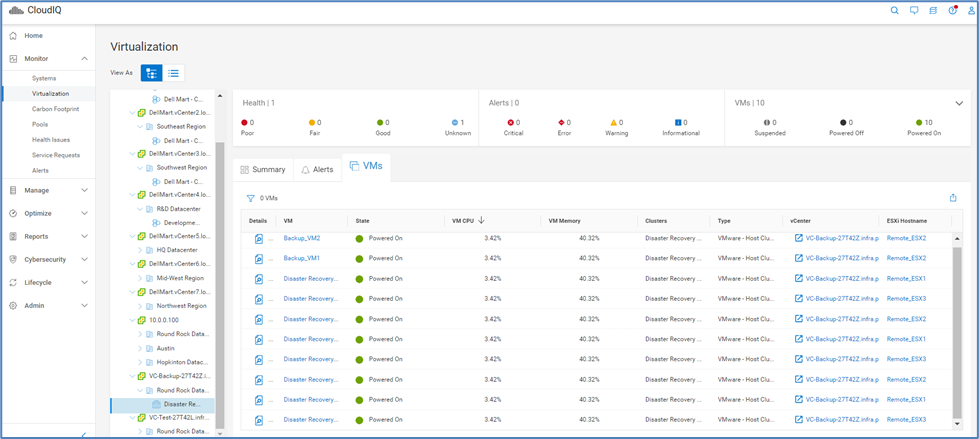
Figure 8. Virtual Machines tab
Clicking the Backup_VM1 virtual machine leads me to the VM details page.
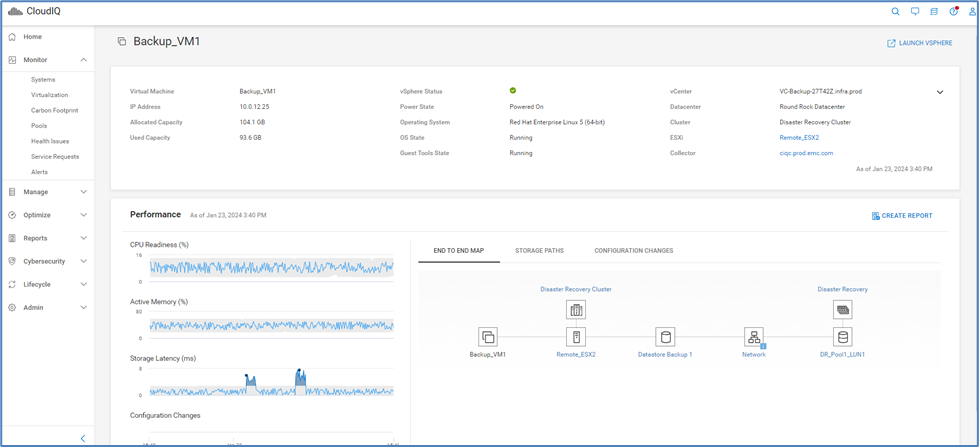
Figure 9. Virtual machine details page
This is where it starts to get interesting. For example, customers can see our AI/ML algorithms in action in the form of anomaly detection. CloudIQ collects telemetry data and compares metrics against historical seasonality. We can identify issues, like increased latency, as we compare data against what we saw in the past for the same period.
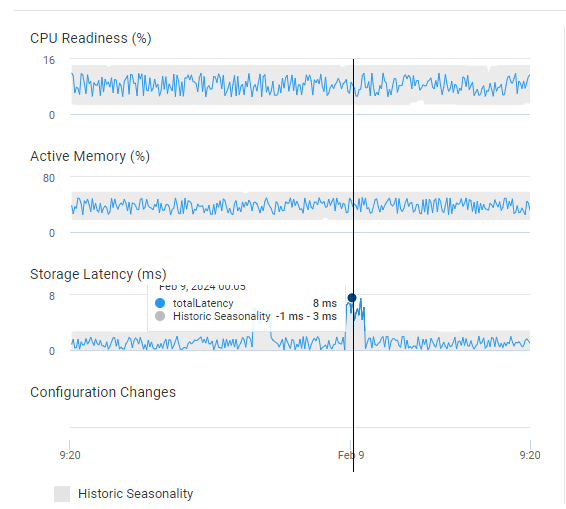
Figure 10. Performance anomaly detection
Toward the bottom of the view, you can see a section called “Configuration Changes.” We display hourly aggregated configuration changes that have been made to this Virtual Machine and by charting them along the time access, you can potentially correlate a configuration change with a change in performance profile.
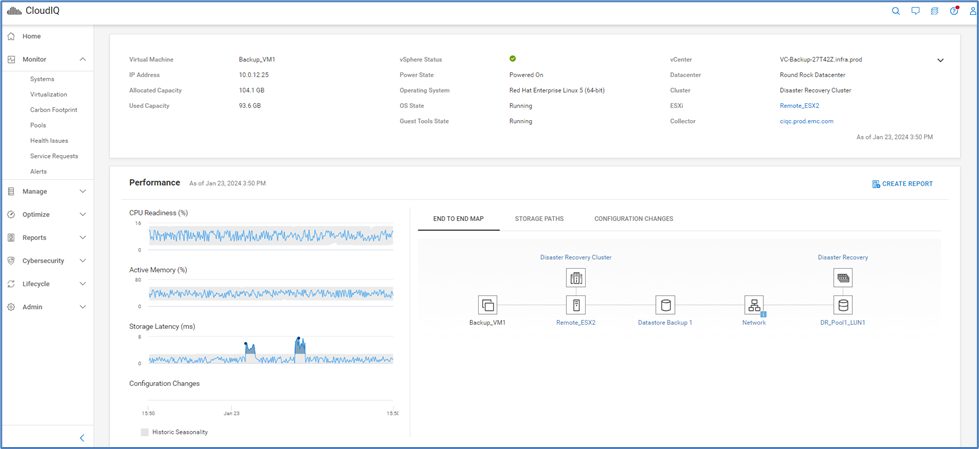
Figure 11. Configuration change tracking
The right side of this view is showing three tabs:
- End to end map
- Storage paths
- Configuration changes
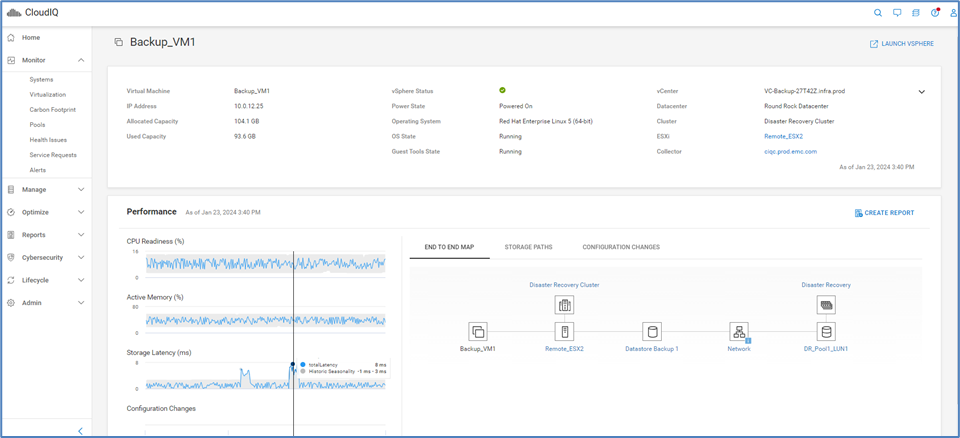
Figure 12. End to end map
End to End Map displays an interactive topology map showing the components including inventory and basic performance. Selecting the cluster, host, datastore, network, storage entity, or array displays more object details underneath the topology map.
Storage Paths provides information for the datastore storage paths including the associated host adapter worldwide name (WWN), fabric, and array adapter.
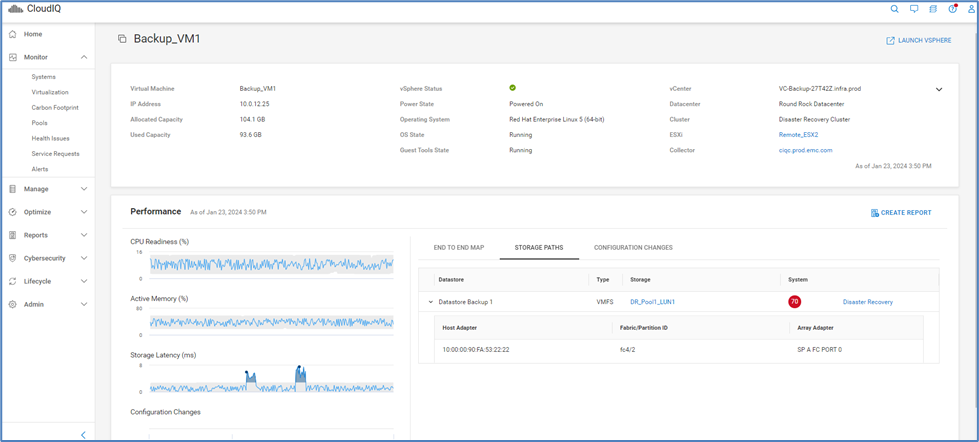
Figure 13. Storage paths
Configuration Changes displays configuration changes for the last 24 hours for the virtual machine.
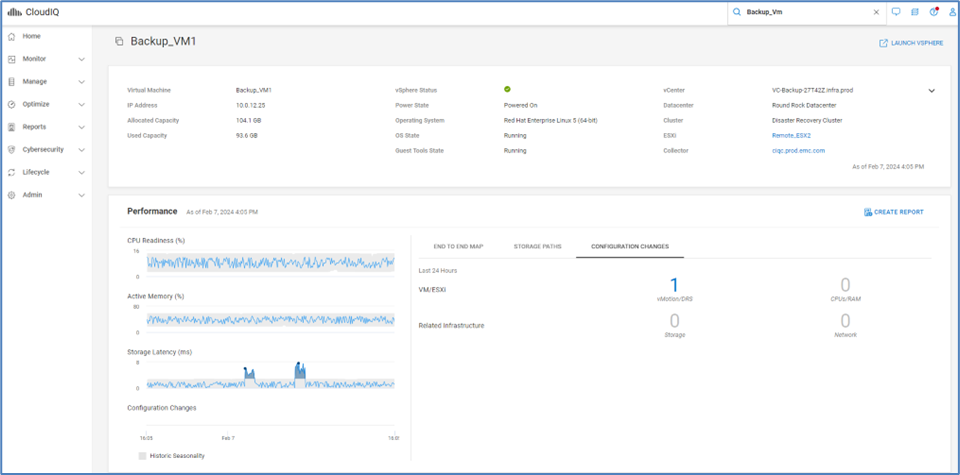
Figure 14. Configuration changes
If you use other solutions from the Dell Technologies portfolio, such as PowerEdge servers for your VMware ESXi clusters, there is yet another option/view you can explore. You can navigate between the VM details page and the PowerEdge details page to quickly see related information.

Figure 15. PowerEdge system details page
Custom Reports
To round off our discussion, customers also have reporting capabilities that can be leveraged.
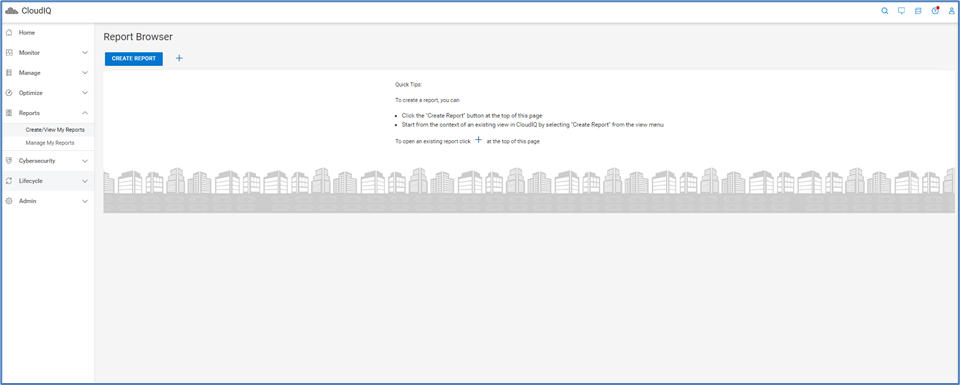
Figure 16. Report browser
Customers can generate several types of reports:
- Anomaly Chart
- Line Chart
- Table
If you would like to report on the inventory of Virtual Machines, a table would be sufficient.
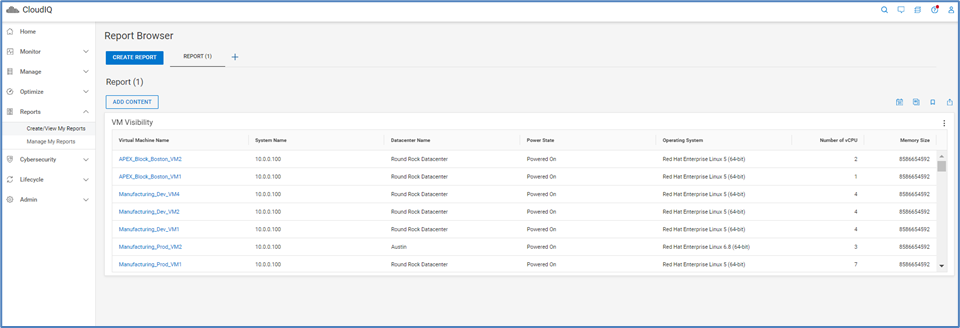
Figure 17. Example of a custom table
When creating a table, there is a set of default columns preselected. You can choose to include additional columns from the available columns list or remove some of the preselected ones.
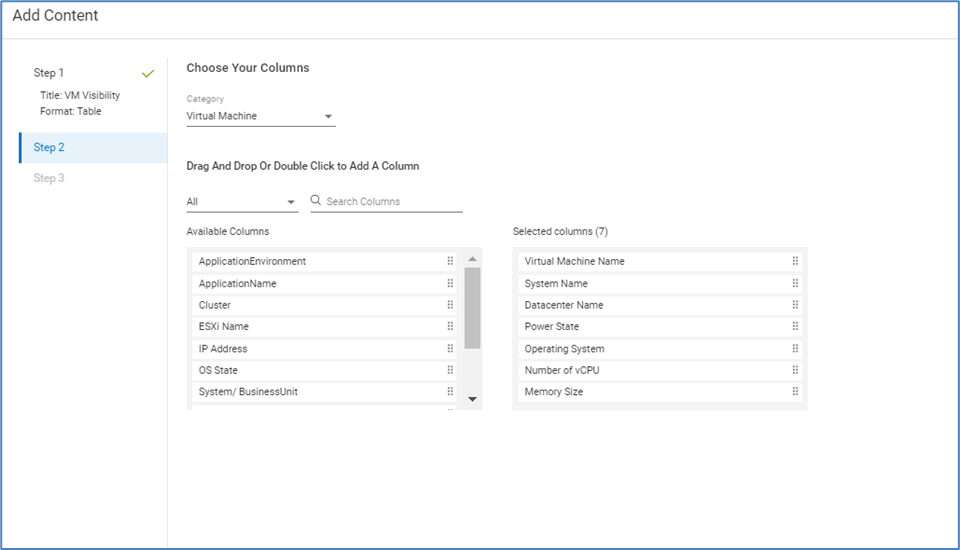
Figure 18. Customizing columns in a table
The second option is to generate a line chart which shows historical performance data. As I am demonstrating below, you can select ‘VMware’ as the product category and ‘Virtual Machine’ as the subcategory. This selection will show you all the virtual machines available in the inventory. Feel free to select one or more virtual machines and go to the next screen. Filtering capabilities are available to display and select specific VMs.
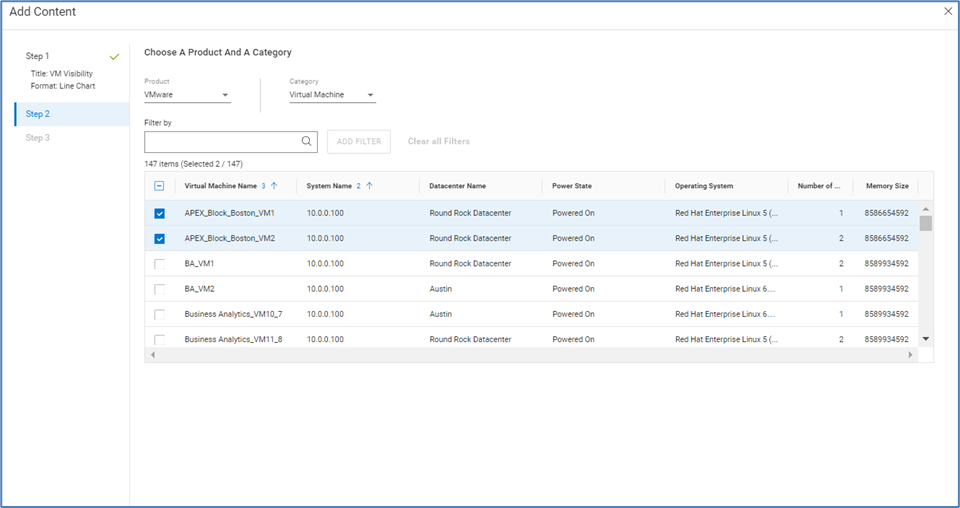
Figure 19. Configuring a line chart
The next screen is where you select the metrics you want to include in your report.
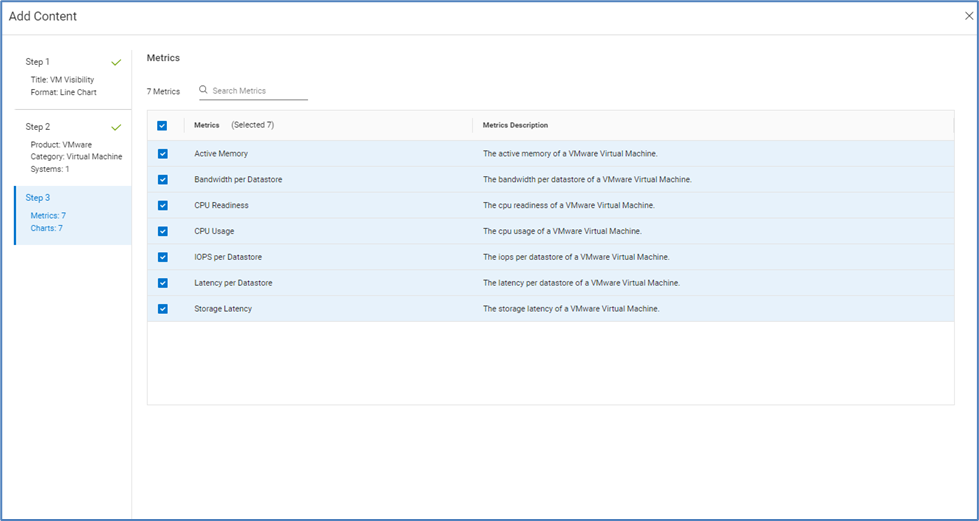
Figure 20. Metric selection
By default, the resulting report shows you data for the last 24 hours. Since CloudIQ keeps 2 years of historical data, you can define a larger window by clicking the drop-down menu.
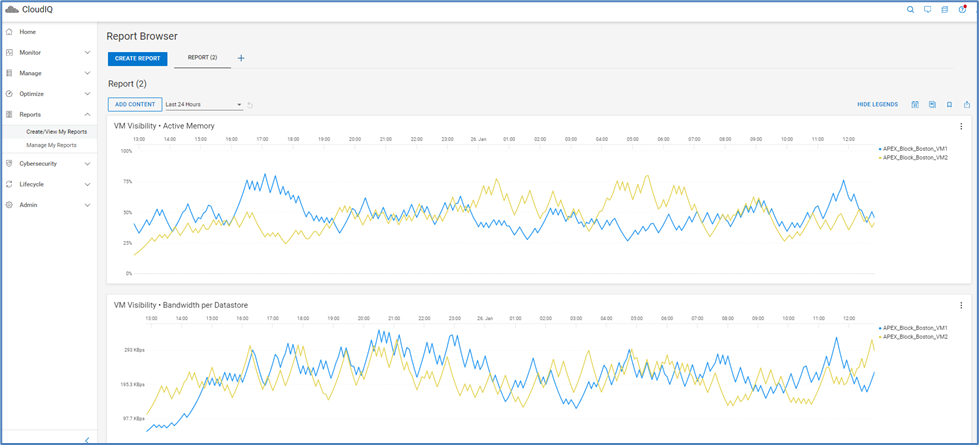
Figure 21. Line chart example
As you can see above, you can correlate performance for virtual machines that might have dependencies, but you can also click either virtual machine on the right side and dim down the graph, so it doesn’t interfere or crowd the screen.
Once you are happy with the data on the screen, you can schedule the report and save it in a PDF format.
Conclusion
As you can see, there is a plethora of information available to customers across Dell management software. In CloudIQ, there are many other views that can show additional details about virtual machines and volumes, for example when browsing a server or a datastore. I encourage you to connect with a Dell representative and schedule a full demo of this product.
Resources
Important Links:
https://www.dell.com/en-us/dt/solutions/cloudiq.htm
https://infohub.delltechnologies.com/t/cloudiq-a-detailed-review/
https://infohub.delltechnologies.com/t/dell-cloudiq-collector-an-overview/
https://developer.dell.com/apis
Authors:
Michael Aharon, Advisory Solutions Consultant;
Derek Barboza, Senior Principal Engineering Technologist