


Talking CloudIQ: Custom Reports with Custom Tags

Introduction
Every organization must report on their IT infrastructure. Whether it be to provide an inventory of assets or determine resource utilization, CloudIQ custom reporting with custom tags helps automate this task, saving time and delivering these reports right to your inbox.
Custom tags
Custom tags are customer-specific metadata that you can enter into CloudIQ to identify resources with customer information, such as application name, service level, business unit, department, and so on. You can enter custom tags against the system or against components of a system. Examples of component tags include hosts, PowerMax storage groups, volumes, file systems, storage pools, and virtual machines. We can quickly see the benefit of applying an application name to a storage group, or a business unit to a virtual machine. By doing so, we can generate application-level reports or asset reports by department.
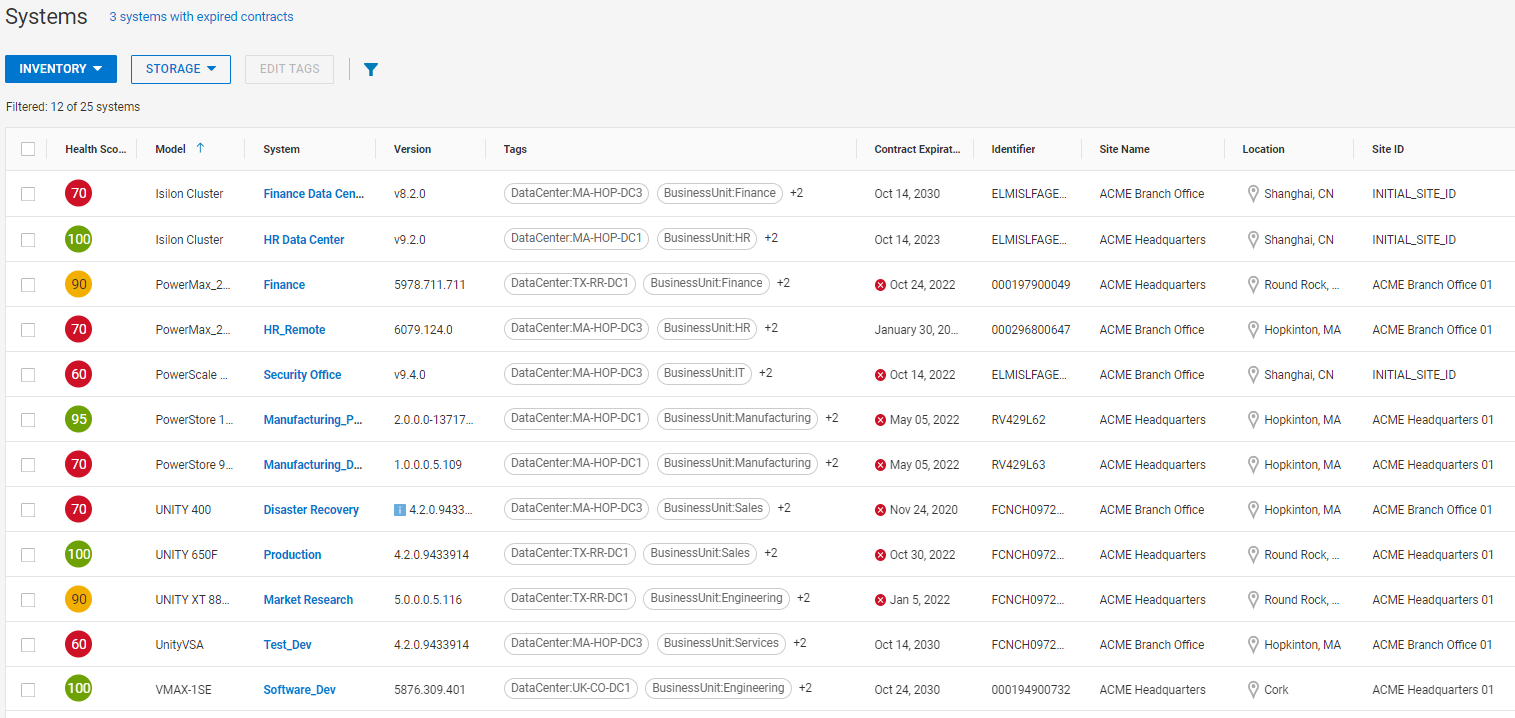
Figure 1. Custom tags in the Storage Inventory View
Custom reports
Custom reports in CloudIQ can contain tables, charts, or a combination of both. Charts can be either common line charts or anomaly charts. Anomaly charts allow users to see unexpected activities in performance by charting the metric along with the expected range of the metric – which has been determined by CloudIQ’s machine learning algorithms.
Tables
Tables are available to provide lists of assets, code versions, contract information, capacity metrics, and average performance metrics. You can also take advantage of custom tags to either be included in the report or to be used as a filter to capture only those assets that meet your business needs, based on the values of those custom tags. For example, you can create a list of PowerEdge servers in a certain business unit with their BIOS and firmware versions, contract expiration dates, average power consumption, and service tags.
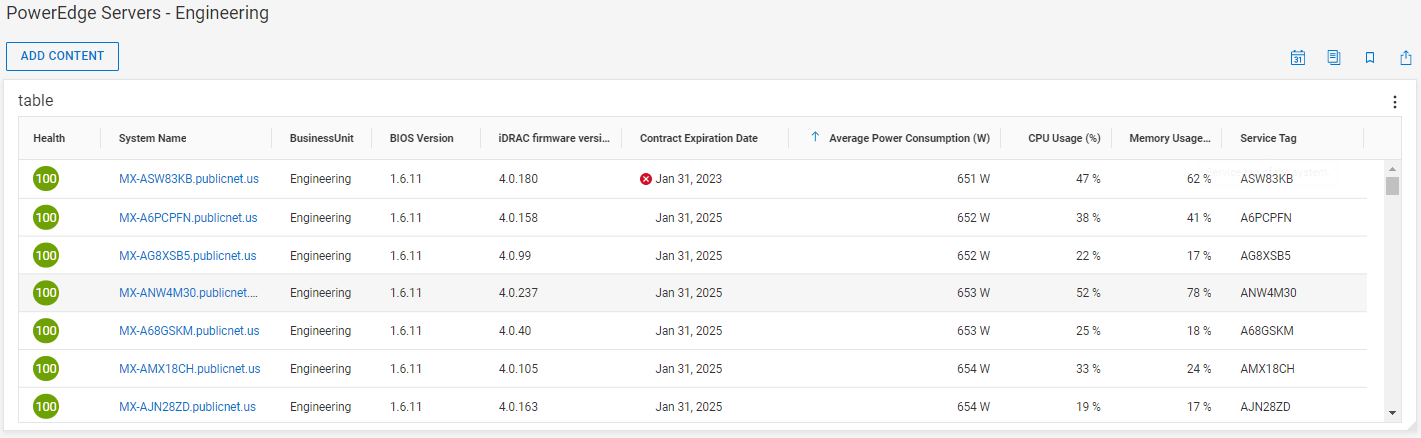
Figure 2. Table showing a business unit’s custom tag
Line and anomaly charts
Perhaps you want to keep an eye on the performance profile of a critical storage system, tracking system bandwidth and IOPS looking for any unusual activity. With just a few clicks you can create the report to chart the metrics, along with the expected lower and upper bounds. A few additional clicks and you can schedule this report to be delivered to yourself or anyone else at the interval you choose. You can give this report a quick look to identify if there are any unusual spikes that could be from an unexpected workload or even from some type of malicious attack.
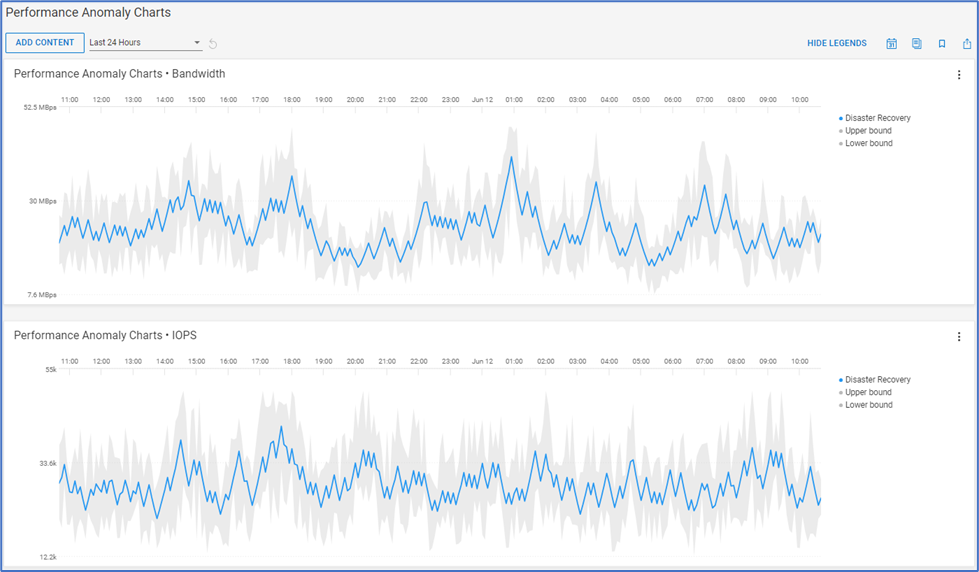
Figure 3. Examples of performance anomaly charts
Conclusion
An IT infrastructure monitoring tool must be flexible and have automated ways to extract and report on assets, capacity, and performance in a meaningful way for your organization. By applying customer-specific metadata in the form of custom tags to assets in CloudIQ, you have the power to generate and automate the delivery of insightful and information rich custom reports to IT infrastructure stakeholders. Extracting the powerful information and machine learning data from CloudIQ allows you to efficiently maintain existing infrastructure and plan for future resource needs.
Resources
For a quick demo on custom reports and other CloudIQ features, see the CloudIQ videos section on the Info Hub.
For other informative blogs, see: Overview of CloudIQ, Proactive Health Scores, Capacity Monitoring and Planning, and Cybersecurity.
How do you become more familiar with Dell Technologies and CloudIQ? The Dell Technologies Info Hub site provides expertise that helps to ensure customer success with Dell Technologies platforms. We also have CloudIQ demos, white papers, and videos available at the Dell Technologies CloudIQ page. And feel free to reference the CloudIQ Overview White Paper which provides in-depth summary of CloudIQ.
Author: Derek Barboza, Senior Principal Engineering Technologist