


Talking CloudIQ: Capacity Monitoring and Planning

Introduction
This is the third in a series of blogs discussing CloudIQ. In my first blog, I provided a high-level overview of CloudIQ and some of its key features. My second blog talked about the CloudIQ Proactive Health Score. I will continue the series with a discussion of the capacity monitoring and planning features in CloudIQ.
Planning ahead
Capacity monitoring helps you plan for expansions of storage arrays, data protection appliances, storage-as-a-service, and hyperconverged infrastructure (HCI) to help overcome unexpected spikes in storage consumption. CloudIQ uses advanced analytics to provide short-term capacity prediction analysis, longer-term capacity forecasting, and capacity anomaly detection. Capacity anomaly detection is the identification of a sudden surge in utilization that may result in a space full condition in less than 24 hours.
The CloudIQ Home page displays the Capacity Approaching Full tile which identifies storage entities that are full or expected to be full in each of the following time ranges:
- Imminent (predicted to run out of space within 24 hours)
- Full
- Within a week
- Within a month
- Within a quarter
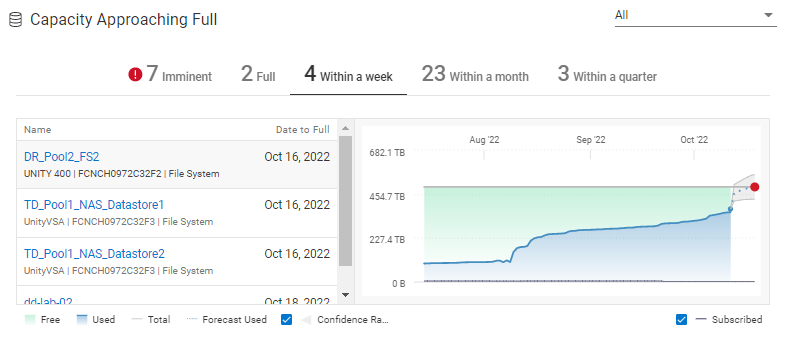
Figure 1. The Capacity Approaching Full tile
In situations where there is a storage entity in the Imminent category, CloudIQ identifies the components of the entity that are experiencing the sudden increase in utilization. This gives users the necessary information about where to look to correct the offending behavior. In the following example, CloudIQ has identified a storage pool that is expected to run out of space in five hours. The pool details page identifies the file systems and LUNs that are the top contributors to the expected rise in utilization.
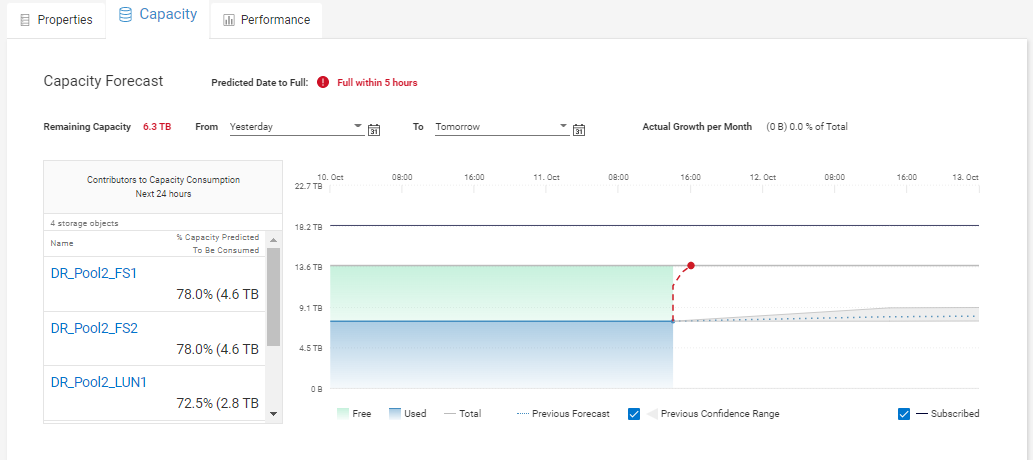
Figure 2. Capacity Forecast for a pool that has a capacity anomaly
Two other CloudIQ features help you quickly find a solution for storage that is fast approaching full. First, there is the identification of reclaimable storage that shows you where you can recover unused capacity in a system. Second, there is the multisystem capacity view that lets you scan all your storage systems to pinpoint which have excess capacity to relieve approaching-full systems of their workloads.
Reclaimable storage
CloudIQ identifies different types of storage that are potentially reclaimable. The following criteria are used to identify reclaimable storage:
- Block objects with no hosts attached
- File objects with no front end I/O in the past week
- Block objects with no front end I/O in the past week
- Block-based virtual machines that have been shut down for the past week
- File-based virtual machines that have been shut down for the past week
Users can quickly see the storage objects, where the object resides, and the amount of reclaimable space. The Last IO Time is provided for block and file objects that have no detected IO activity in the last week. For VMs that have been shut down for at least a week, the storage object on which the VM resides along with the vCenter and time that the VM was shut down is available. The following figure shows an example of reclaimable storage for block objects that have had no front-end IO activity in the past week.
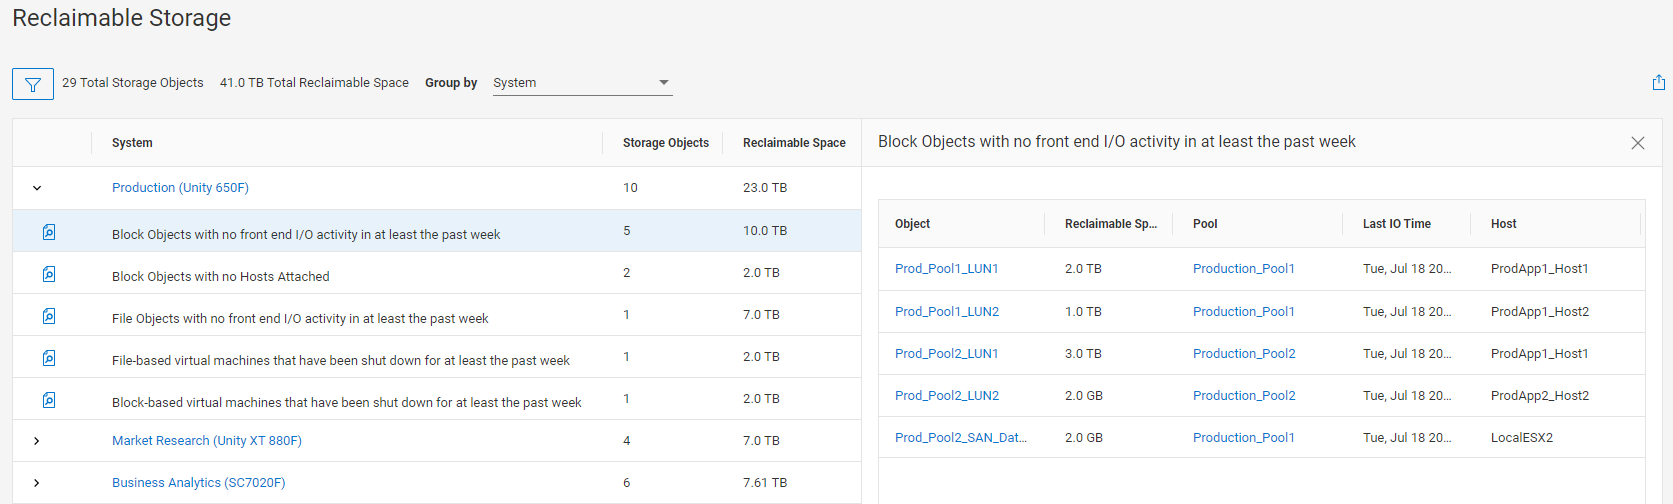
Figure 3. The Reclaimable Storage page – Block Objects with no front end IO activity
Multisystem capacity view
The multisystem capacity view provides a quick view of physical usable, used, free, and storage efficiencies across all storage, HCI, and data protection systems monitored by CloudIQ. This allows users to see quickly which systems are low on usable space, determine which systems are good targets for workload migration, and verify that their storage efficiencies and data reduction numbers are what they are expecting.
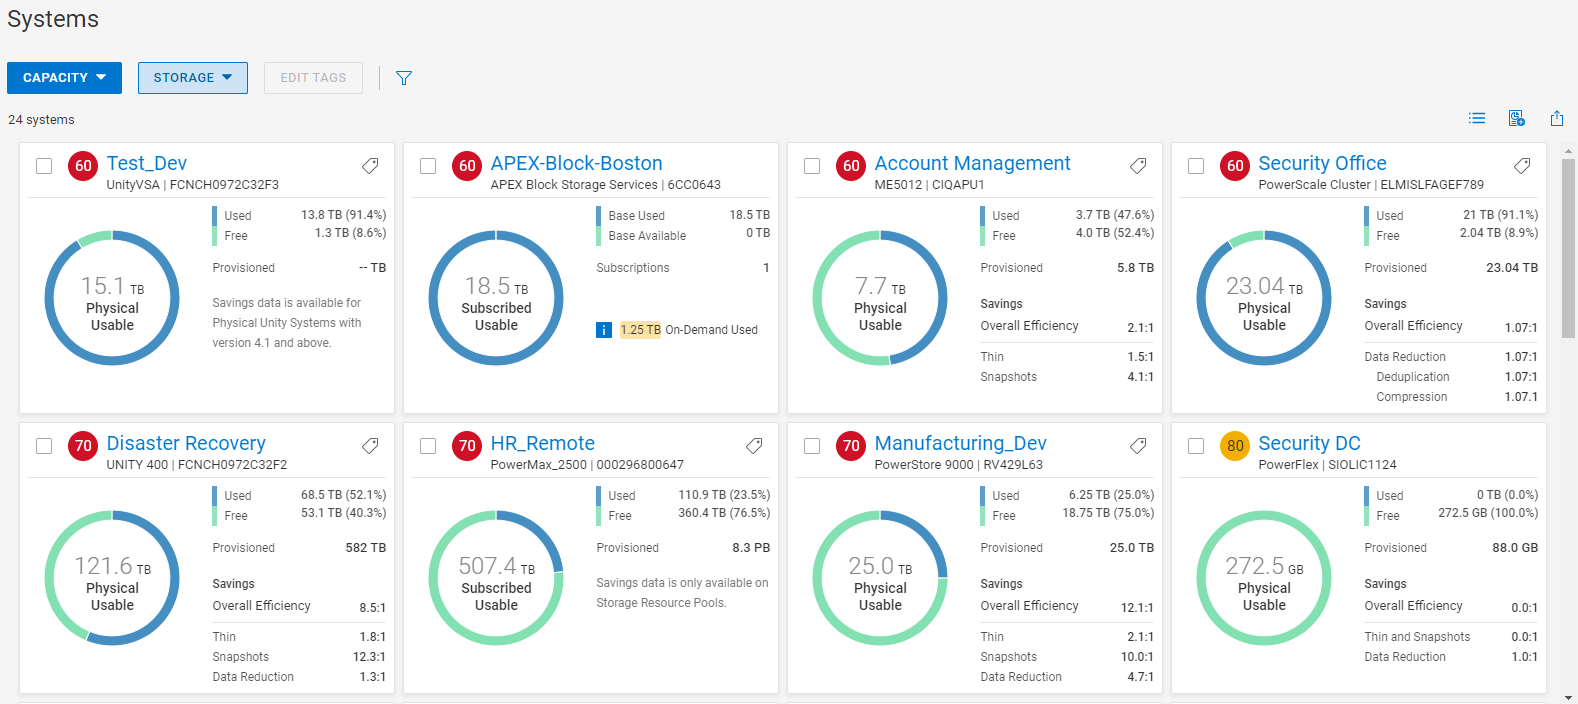
Figure 4. Multisystem capacity view for storage
Storage system details
Detailed capacity views for storage systems and storage objects provide additional information, including data efficiencies and data reduction metrics. The following figure shows the physical and logical storage breakdown and data reduction charts for a PowerStore cluster.
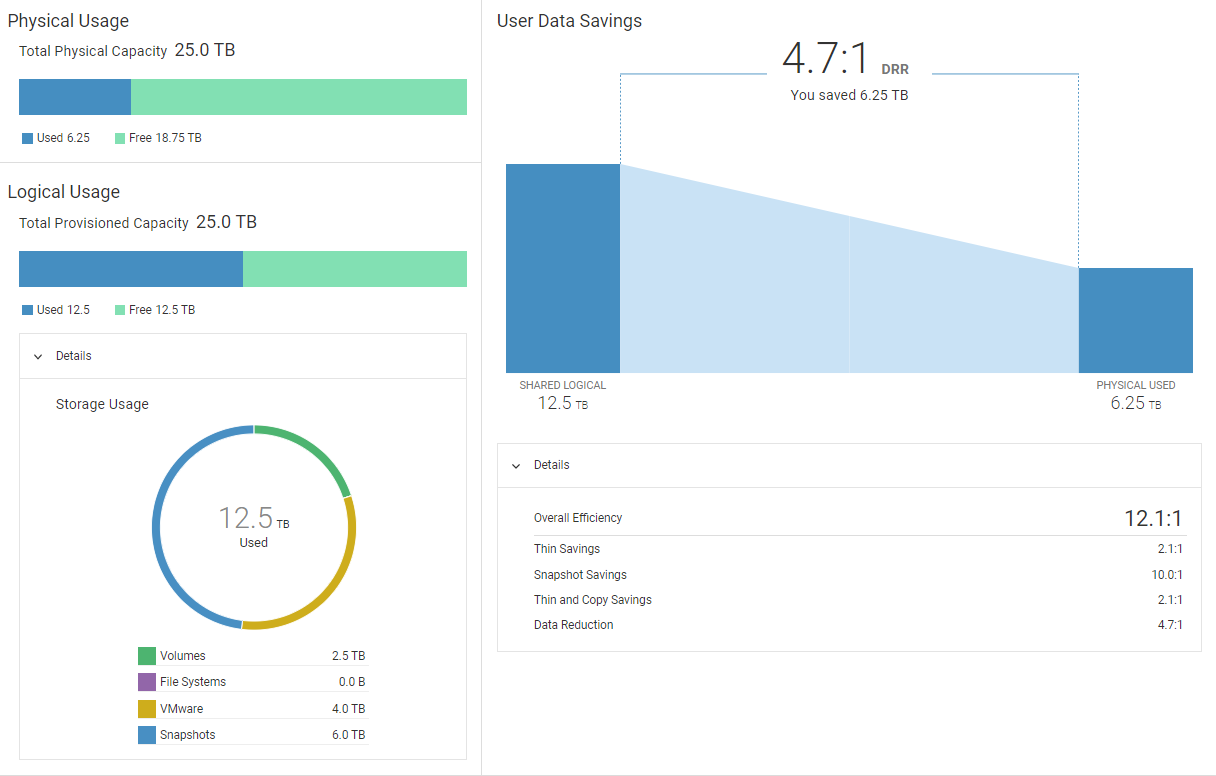
Figure 5. PowerStore cluster storage details
For APEX block storage service subscriptions, CloudIQ provides both subscribed and physical storage views. Subscribed views provide the storage usage including base and on-demand storage usage.
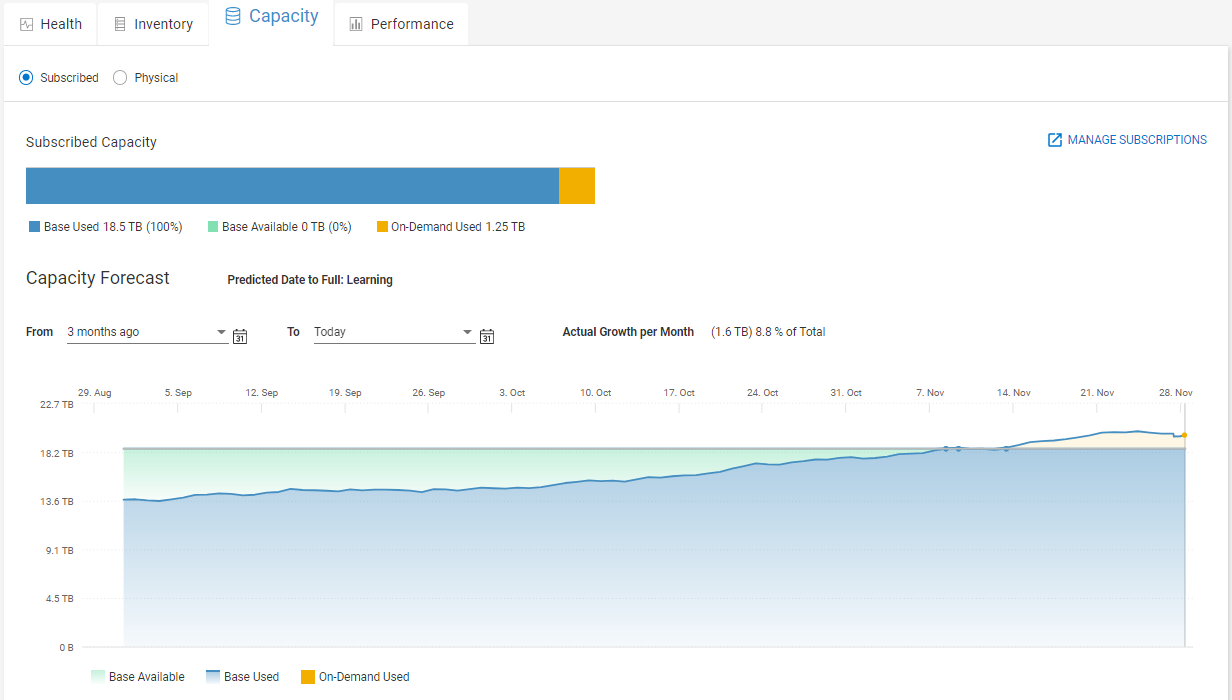
Figure 6. APEX block storage services subscription view
Custom reports
With custom reports and the use of custom tags, users can create meaningful business reports and schedule those reports to be delivered to the required end users. Reports can include both line charts and tables and can be filtered on any field. The following figure shows a simple table that includes used and free capacities, data reduction values, and several custom tags.
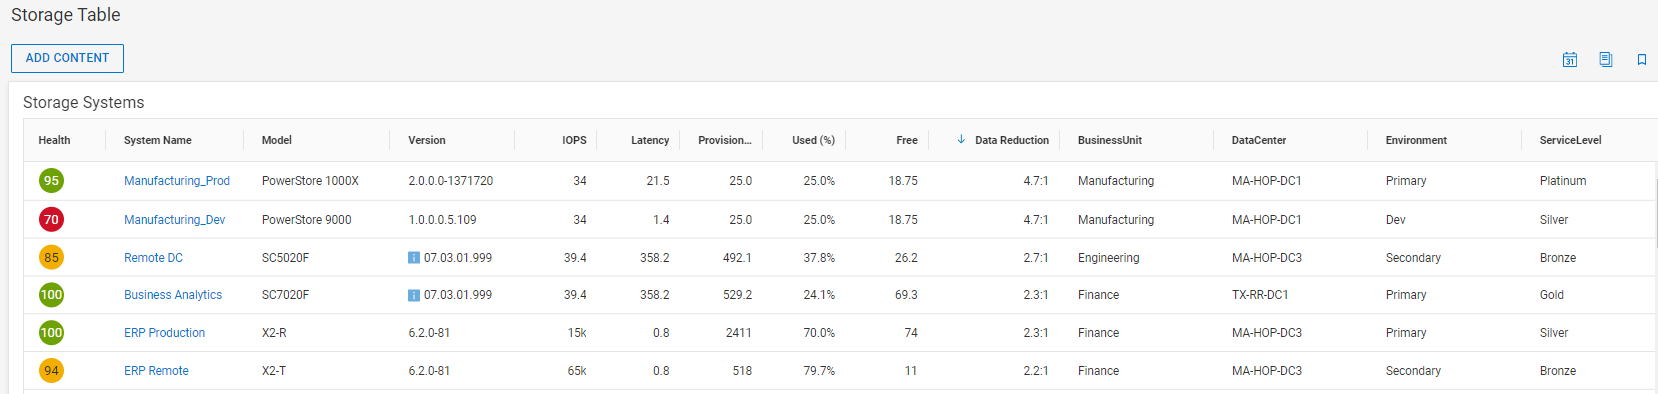
Figure 7. Custom report for storage
Conclusion
CloudIQ’s intelligence and predictive analytics helps users proactively manage and accurately plan data storage and workload expansions, and to act quickly to avoid rapidly approaching capacity full conditions. Custom reports and tagging allows users to create, schedule, and deliver reports with technical and business information tailored to a wide variety of stakeholders. And for users looking to integrate data from CloudIQ with existing IT management tools, CloudIQ provides a public REST API.
Resources
How do you become more familiar with Dell Technologies and CloudIQ? The Dell Technologies Info Hub site provides expertise that helps to ensure customer success with Dell Technologies platforms. We have CloudIQ demos, white papers, and videos available at the Dell Technologies CloudIQ page. Also, feel free to reference the CloudIQ Overview Whitepaper which provides an in-depth summary of CloudIQ. Interested in DevOps? Go to our public API page for information about integrating CloudIQ with other IT tools using Webhooks or REST API.
Author: Derek Barboza, Senior Principal Engineering Technologist