


Comparing the NVIDIA H100 and A100 GPUs in Dell PowerEdge R760xa and R750xa Servers
Wed, 04 Oct 2023 16:47:00 -0000
|Read Time: 0 minutes
Abstract
Dell Technologies recently submitted results to the MLPerf™ Inference v3.1 benchmark suite. This blog highlights Dell Technologies’ closed division submission made for the Dell PowerEdge R760xa and Dell PowerEdge R750xa servers with NVIDIA H100 and NVIDIA A100 GPUs.
Introduction
This blog provides comparisons that draw relevant conclusions about the performance improvements that are achieved on the Dell PowerEdge R760xa server with the NVIDIA H100 GPU compared to their respective predecessors, the Dell PowerEdge R750xa server with the NVIDIA A100 GPU. In the Dell PowerEdge R760xa server section of this blog, we compare the performance of the PowerEdge R760xa server to the PowerEdge R750xa server while keeping the NVIDIA H100 GPU constant to demonstrate the improvement of the new generation of PowerEdge servers. Also, we compared the performance of the PowerEdge R760xa server with the NVIDIA H100 GPU to the PowerEdge R750xa server with the NVIDIA A100 GPU to showcase the server plus the GPU generation-to-generation improvements. In the Dell PowerEdge R750xa server section of this blog, we kept the server constant and compared the performance of the NVIDIA H100 GPU to the NVIDIA A100 GPU. For an additional angle, we held the PowerEdge R750xa server and the NVIDIA A100 GPU constant to showcase the performance improvements delivered by software stack updates.
System Under Test (SUT) configuration
Table 1: SUT configuration of the Dell PowerEdge R760xa and Dell PowerEdge R750xa servers for MLPerf Inference v3.1 and v3.0
| Platform | R750xa | R750xa | R760xa |
| MLPerf Version | V3.0 | V3.1 | V3.1 |
| GPU | NVIDIA A100 PCIe 80 GB | NVIDIA A100 PCIe 80 GB NVIDIA H100 PCIe 80 GB | NVIDIA H100 PCIe 80 GB |
| GPU Count | 4 | ||
| MLPerf System ID | R750xa_A100_PCIE_80GBx4_TRT | R750xa_A100_PCIe_80GBx4_TRT R750xa_H100_PCIe_80GBx4_TRT | R760xa_H100_PCIe_80GBx4_TRT |
| CPU | Intel Xeon Gold 6338 CPU @ 2.00 GHz | Intel Xeon Platinum 8480+ | |
| Memory | 512 GB | 512 GB 1 TB | 2 TB |
| Software Stack | TensorRT 8.6 CUDA 12.0 cuDNN 8.8.0 Driver 525.85.12 DALI 1.17.0 | TensorRT 9.0.0 CUDA 12.2 cuDNN 8.9.2 Driver 535.86.10 DALI 1.28.0 | |
The following table shows the technical specifications of the NVIDIA H100 and NVIDIA A100 GPUs:
Table 2: Technical specification comparison of the NVIDIA H100 and NVIDIA A100 GPUs
GPU | NVIDIA A100 | NVIDIA H100 | ||||||
Form factor | SXM4 | PCIe Gen4 | SXM4 | PCIe Gen4 | PCIe Gen5 | NVL PCIe Gen5 | SXM5 | |
GPU architecture | Ampere | Hopper | ||||||
CUDA cores | 6912 | 14592 | 2x 16895 | 16895 | ||||
Memory size | 40 GB | 80 GB | 80 GB | 2x 94 GB (188 GB) | 80 GB | 94 GB | ||
Memory type | HBM2e | HBM2 | HBM2e | HBM2e | HBM3 | HBM2e | ||
Base clock | 1095 MHz | 765 MHz | 1275 MHz | 1065 MHz | 1095 MHz | 1080 MHz | 1590 MHz | 1605 MHz |
Boost clock | 1410 MHz | 1755 MHz | 1785 MHz | 1980 MHz | ||||
Memory clock | 1215 MHz | 1593 MHz | 1512 MHz | 1593 MHz | 2619 MHz | 1593 MHz | ||
MIG support | Yes | Yes/2nd Gen | ||||||
Peak memory bandwidth | 1555 GB/s | 2039 GB/s
| 1935 GB/s | 2039 GB/s | 3938 GB/s | 3352 GB/s | 2359 GB/s | |
Total board power | 400 W | 250 W | 400 W | 300 W | 310/350 W | 400 W | 700 W | |
Dell PowerEdge R760xa server
The PowerEdge R760xa server shines as an Artificial Intelligence (AI) workload server with its cutting-edge inferencing capabilities. This server represents the pinnacle of performance in the AI inferencing space with its processing prowess enabled by Intel Xeon Platinum processors and NVIDIA H100 PCIe 80 GB GPUs. Coupled with NVIDIA TensorRT and CUDA 12.2, the PowerEdge R760xa server is positioned perfectly for any AI workload including but not limited to Large Language Models, computer vision, Natural Language Processing, robotics, and edge computing. Whether you are processing image recognition tasks, natural language understanding, or deep learning models, the PowerEdge R760xa server provides the computational muscle for reliable, precise, and fast results.
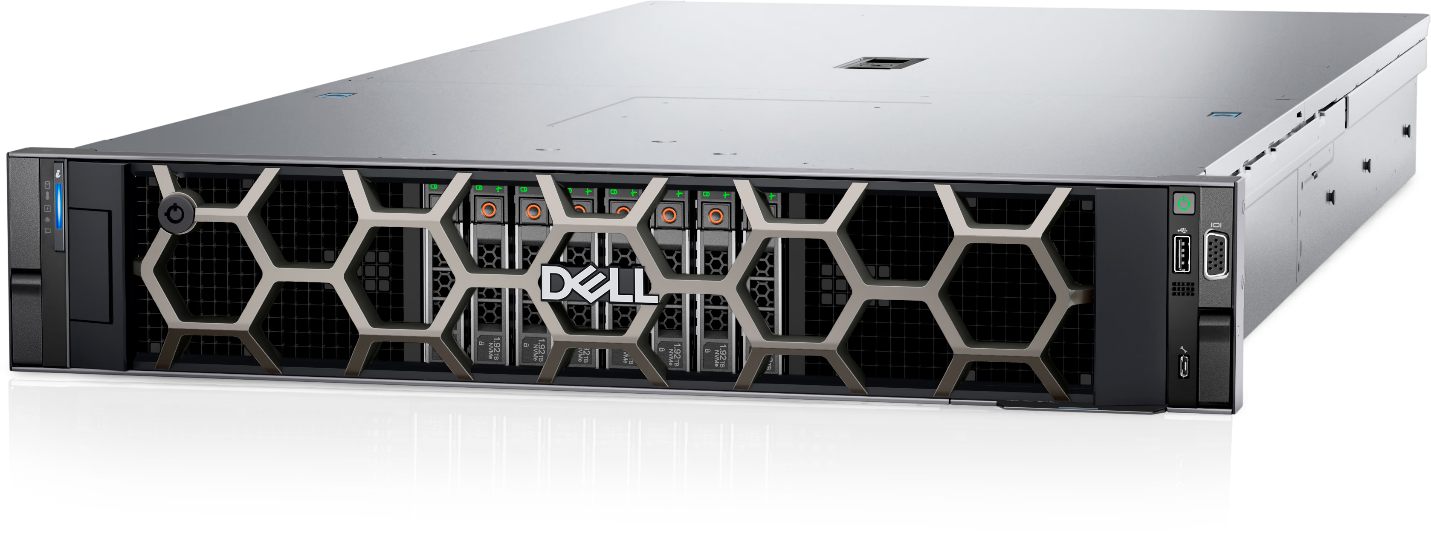
Figure 1: Front view of the Dell PowerEdge R760xa server
 |
|
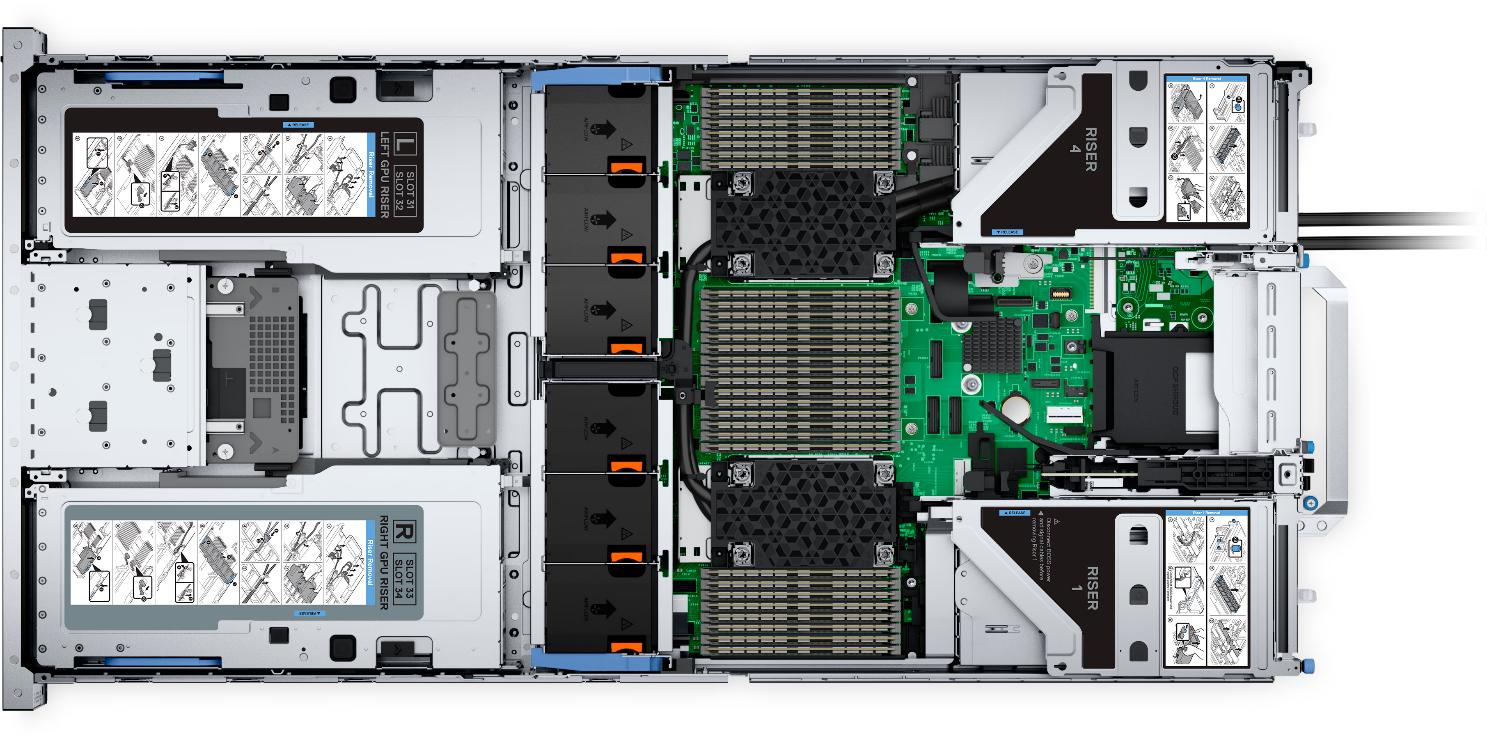
Figure 2: Top view of the Dell PowerEdge R760xa server
The results in the following figures are represented as percentage differences while maintaining a single SUT as the baseline. To determine the percentage difference between the two results, we subtracted the performance value achieved on the first server from the performance value achieved on the second server. We divided the difference by the performance achieved on the second server and multiplied it by 100 to get a percentage. By applying this formula, we obtain the performance delta between the second and first server. This result provides an easy-to-read comparison across two systems and several benchmarks.
The following figure shows the percent difference between the PowerEdge R760xa and PowerEdge R750xa servers while maintaining the NVIDIA H100 GPU constant. Both results were collected from the latest official MLPerf Inference v.3.1 submission with the identical software stack. Across all the benchmarks, the PowerEdge R760xa server comprehensively outperformed its predecessor. The PowerEdge R760xa server shined in the Natural Language Processing task with a noticeable 15 percent improvement. On average, it performed approximately 6 percent better for all workloads.
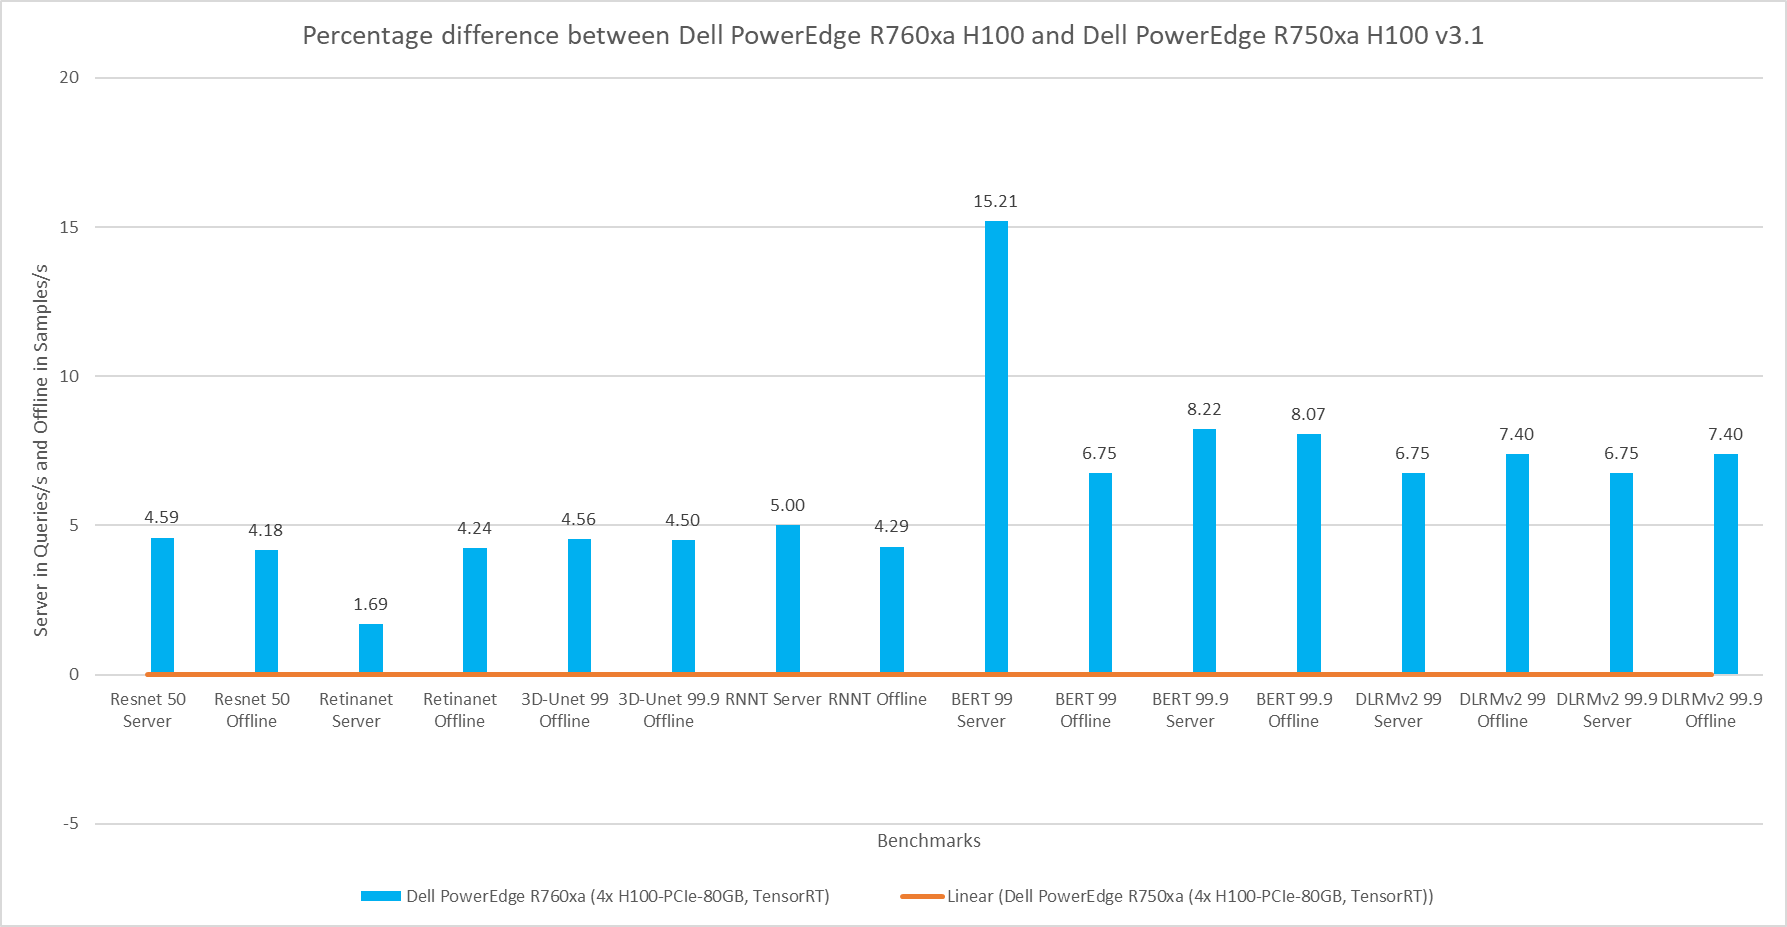
Figure 3: Percentage difference between the Dell PowerEdge R760xa server with the NVIDIA H100 GPU and the Dell PowerEdge R750xa server with the NVIDIA H100 GPU for the v3.1 submission
The following figure shows a comparison of the PowerEdge R760xa server with the NVIDIA H100 GPU to the PowerEdge R750xa server with the NVIDIA A100 GPU. This comparison is expected to yield the highest delta in performance due to the hardware upgrades of both the server and GPU. Both submissions were made to the MLPerf Inference v3.1 round in which the software stack was kept the same. The PowerEdge R760xa server paired with the NVIDIA H100 GPU thoroughly outperformed its predecessor in all workloads. In the high accuracy category of the Natural Language Processing workload, the PowerEdge R760xa server boasts an impressive 178 percent and 197 percent performance improvement in the Server and Offline modes respectively. On average, the newer configuration showcased a noteworthy 71 percent improvement across all the benchmarks.
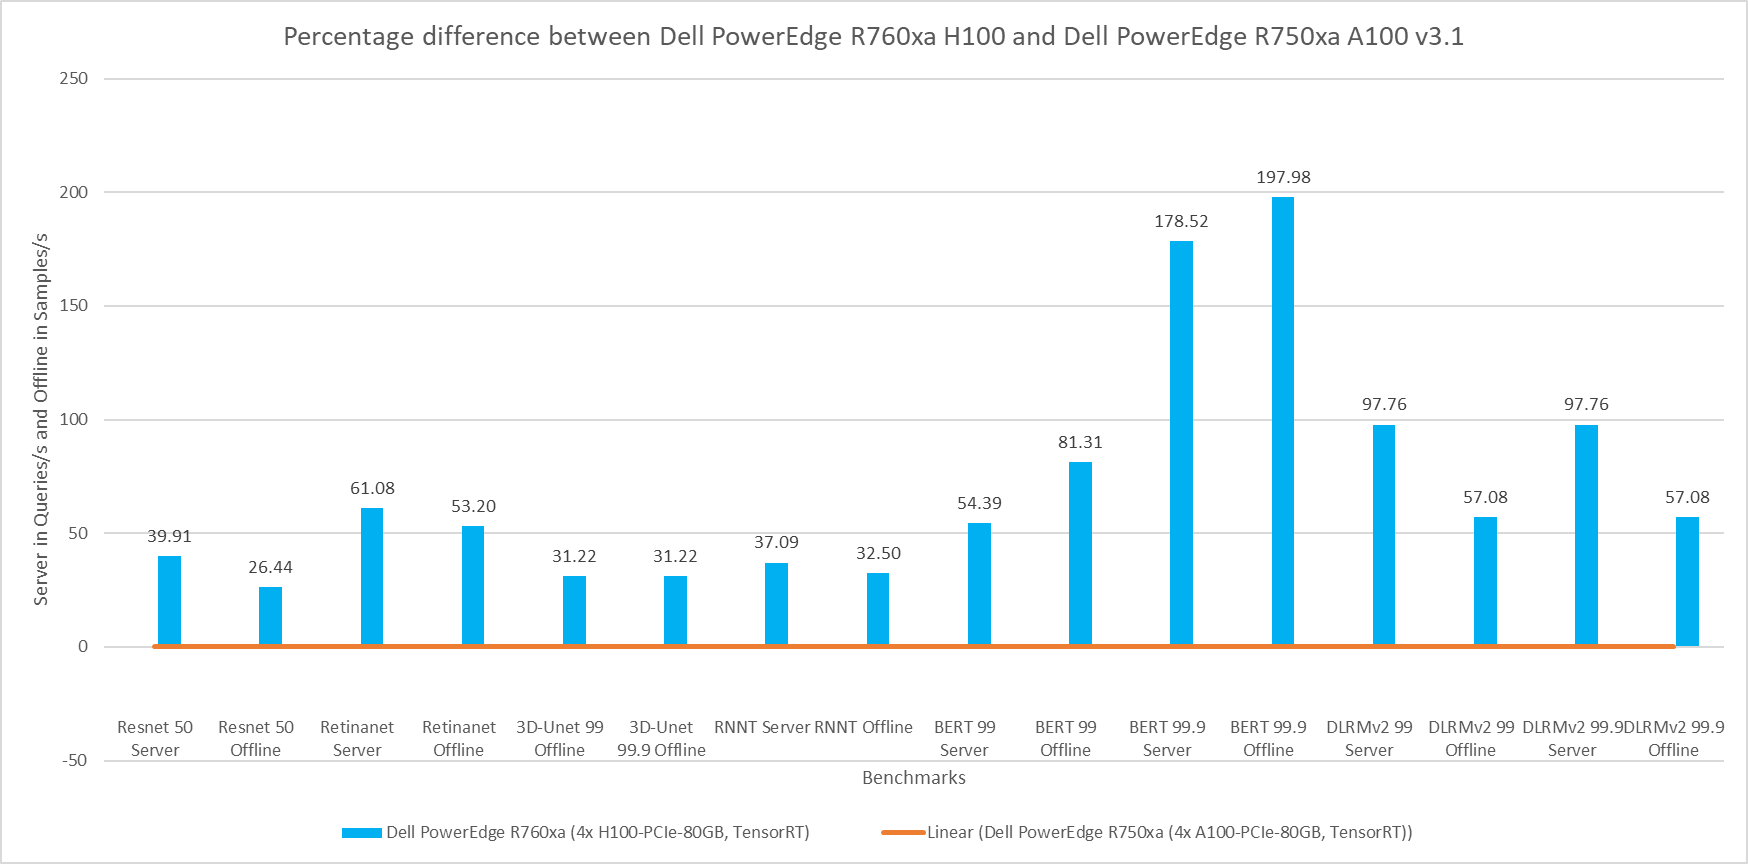
Figure 4: Percentage difference between the Dell PowerEdge R760xa server with the NVIDIA H100 GPU and the Dell PowerEdge R750xa server with the NVIDIA A100 GPU for v3.1
Dell PowerEdge R750xa server
The PowerEdge R750xa server is a perfect blend of technological prowess and innovation. This server is equipped with Intel Xeon Gold processors as well as with the latest NVIDIA GPUs. The PowerEdge R760xa server has been designed for the most demanding AI/ML/DL workloads as it is compatible with the latest NVIDIA TensorRT engine and CUDA version. With up to nine PCIe Gen4 slots and availability in a 1U or 2U configuration, the PowerEdge R750xa server is an excellent option for any demanding workload.
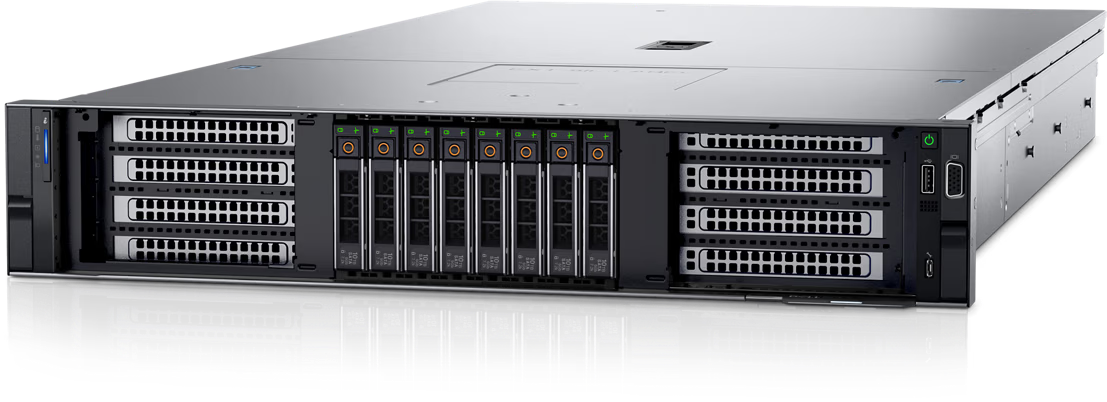
Figure 5: Front view of the Dell PowerEdge R750xa server
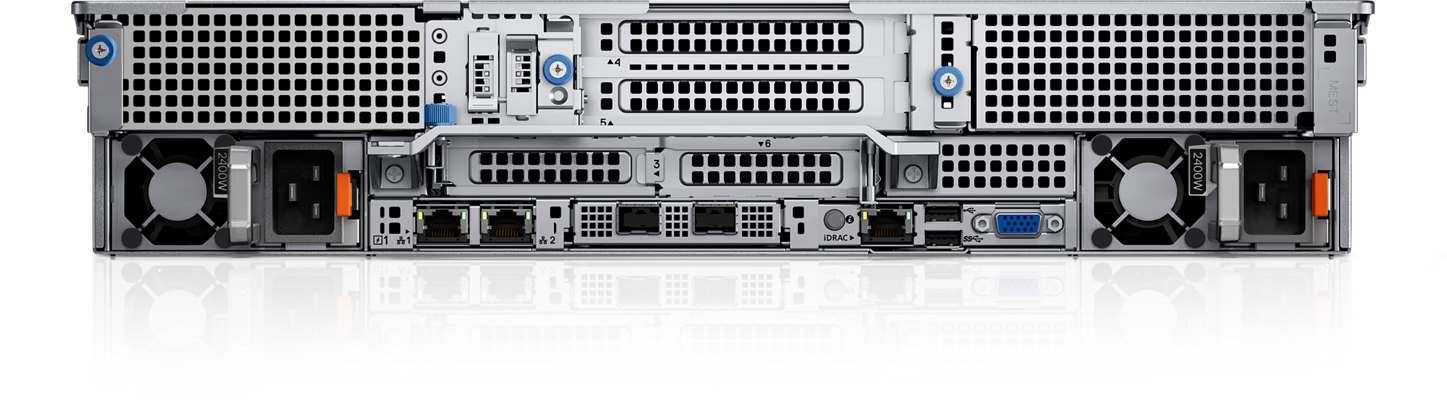
Figure 6: Rear view of the Dell PowerEdge R750xa server
For the following comparison, the Dell PowerEdge R750xa server is held constant but the GPU is updated from the NVIDIA A100 GPU to the NVIDIA H100 GPU. This comparison is useful if you are interested in keeping the server that you already have but are upgrading the GPU. As expected, the server with the NVIDIA H100 GPU shows significant performance improvements across all the workloads. Similar to the previous comparison, the high accuracy Natural Language Processing task on the NVIDIA H100 GPU shows promising performance improvements. In the high accuracy Server scenario for BERT, the NVIDIA H100 GPU showed a 156 percent improvement and in the Offline scenario a 174 percent improvement. On average, the PowerEdge R750xa server paired with the NVIDIA H100 GPU performed approximately 60 percent better than its GPU predecessor.
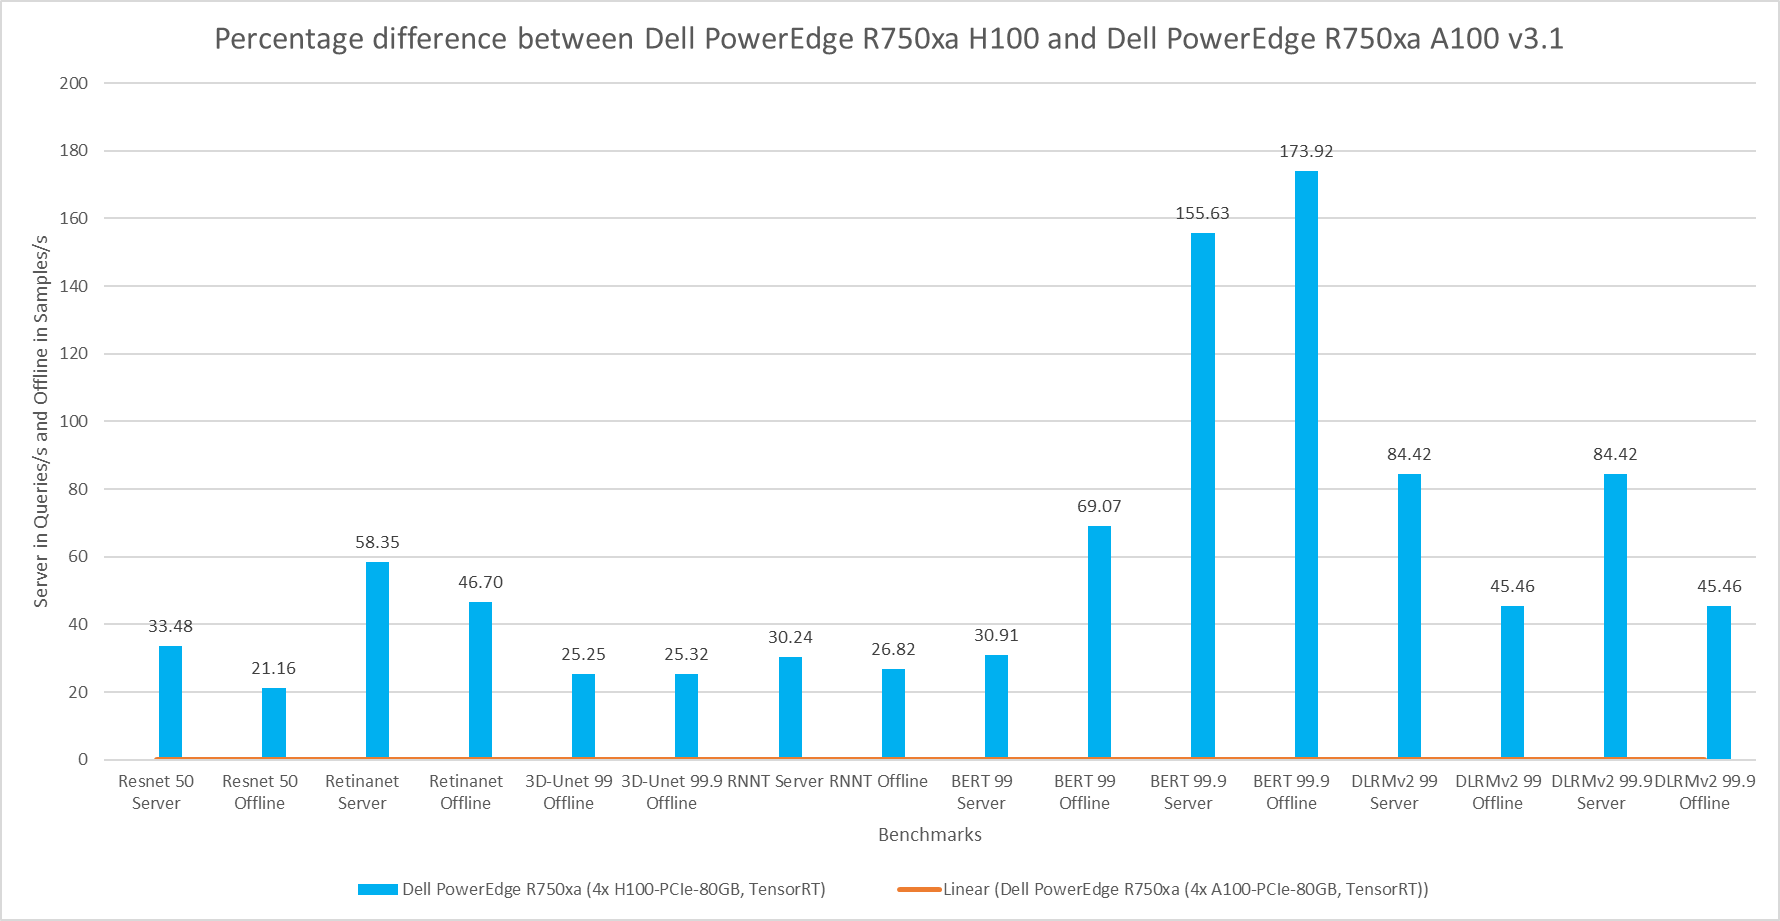
Figure 7: Percentage difference between the Dell PowerEdge R750xa H100 and Dell PowerEdge R750xa A100 for MLPerf Inference v3.1
The comparison shown in the following figure is an interesting comparison across two rounds of submissions. The hardware for the SUT is identical with the Dell PowerEdge R750xa server paired with the NVIDIA A100 GPU. The performance delta from this graph can be attributed to the changes in the software stack. For the vision tasks, RetinaNet and 3D-UNet, the NVIDIA H100 GPU showed a considerable improvement in performance. For the BERT Server scenario, the performance is approximately the same. However, for the BERT Offline scenario in both the default and high accuracy modes, there was a slight regression in performance. This result can be attributed to regressions in the BERT model.
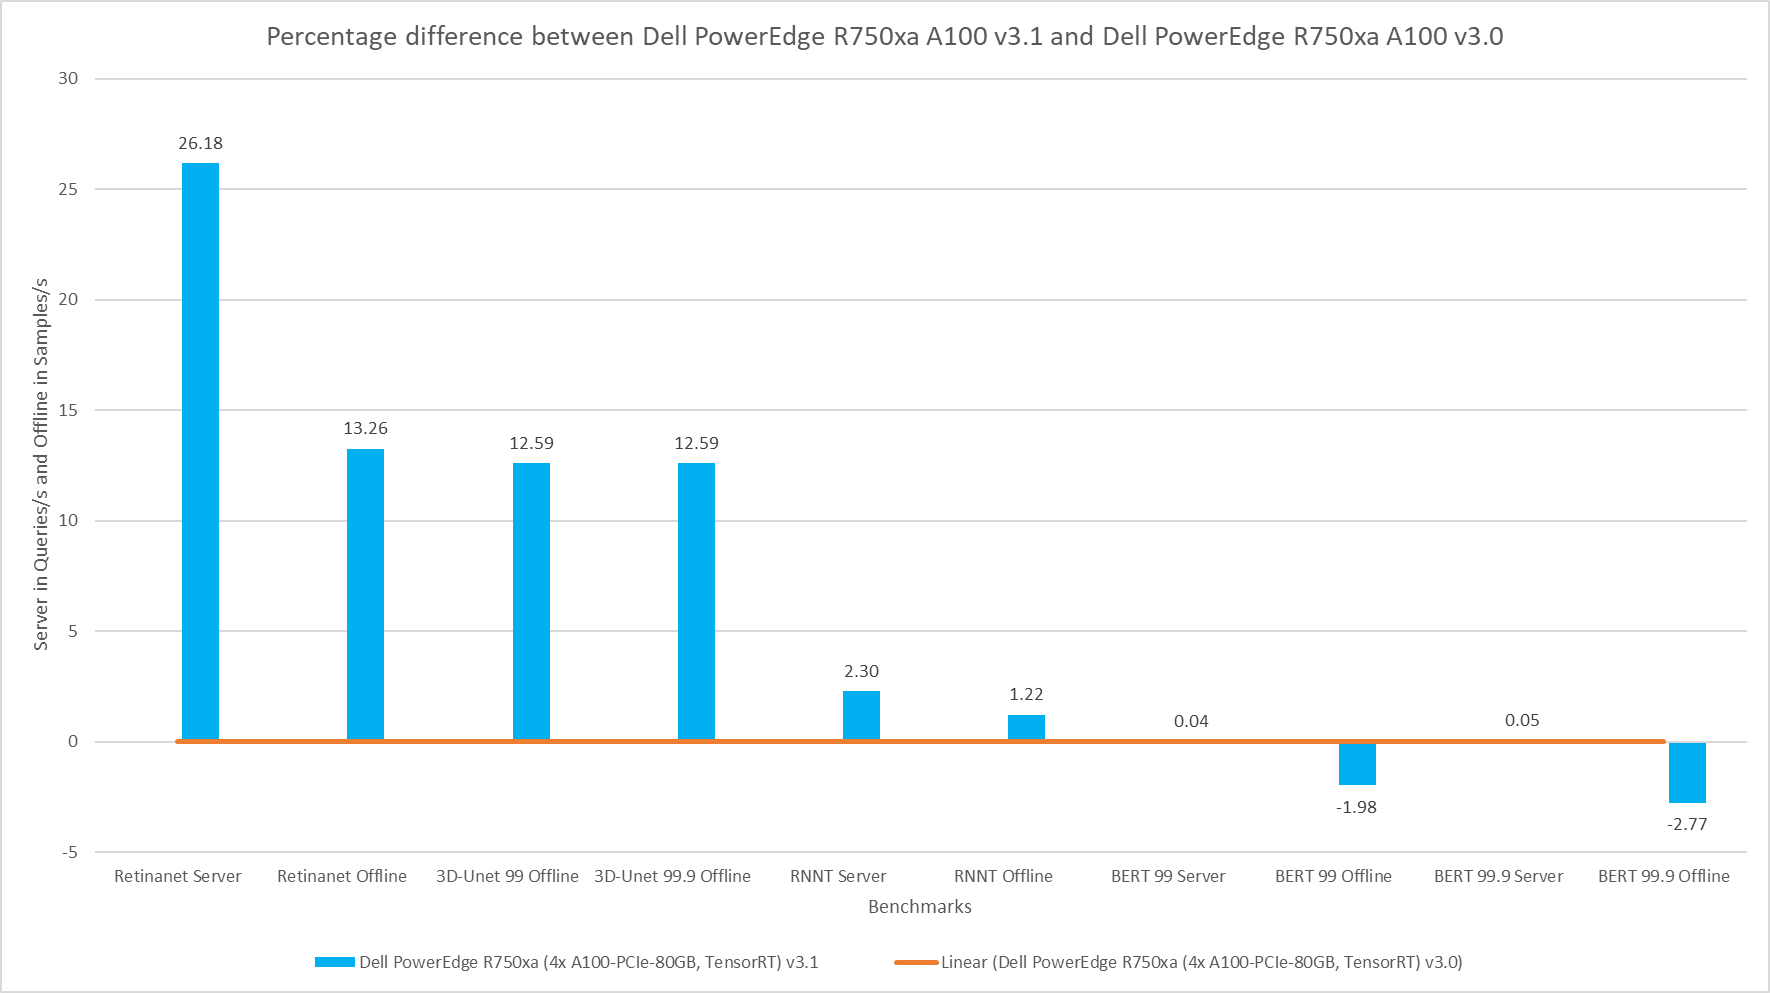
Figure 8: Percentage difference between the Dell PowerEdge R750xa server with the NVIDIA A100 GPU v3.1 submission and the Dell PowerEdge R750xa server with the NVIDIA A100 GPU v3.0 submission
Conclusion
The MLPerf Inference submissions always elicit insightful comparisons. This blog highlighted these comparisons between the MLPerf Inference v3.1 and v3.0 rounds of submission:
- A generation-to-generation comparison of the Dell PowerEdge R760xa server and the Dell PowerEdge R750xa server while keeping the GPU constant on average boasts an impressive 6.22 percent performance improvement.
- An upgrade of the server as well as the GPU from the Dell PowerEdge R750xa server paired with the NVIDIA A100 GPU to the Dell PowerEdge R760xa server paired with the NVIDIA H100 GPU shows a noteworthy boost in performance. You can expect about an average of 71 percent increase in performance across benchmarks by upgrading both the server and the GPU.
- While maintaining the Dell PowerEdge R750xa server and upgrading the GPU from the NVIDIA A100 GPU to the NVIDIA H100 GPU, you can expect an approximate 60 percent increase in performance across benchmarks.
- While maintaining the same SUT across rounds with the Dell PowerEdge R750xa server and the NVIDIA A100 GPU, you can expect on average an 11.36 percent increase in improvement for RetinaNet, 3D-UNet, and RNNT tasks, thanks to software improvements. However, there are minor regressions in performance in the BERT benchmark.
Across the first three comparisons, a pattern of improvement in the Natural Language Processing task was noticeable. With the advent of new Large Language Models, the Dell PowerEdge server is positioned well to handle Generative AI workloads. For the last comparison, we kept the Dell PowerEdge R750xa server and NVIDIA A100 GPU consistent but looked at the performance across different rounds of submission.
MLCommons™ results
Note: We ran the RetinaNet Offline results for the Dell PowerEdge R760xa and Dell PowerEdge R750xa servers with the NVIDIA H100 GPU again after the submission with a larger GPU batch size. These results significantly improved the performance and are a true representation of Dell servers as we saw a 78 percent and 114 percent increase in performance on the PowerEdge R760xa server and PowerEdge R750xa servers respectively. For the Dell PowerEdge R760xa server with four NVIDIA H100 GPUs, the RetinaNet Offline results improved from 2069.79 to 4550.67. The RetinaNet Offline results for the system ID 3.1-0063 and 3.1-0065 submissions are not official due to MLCommons rules because they were rerun after the submission and not officially submitted before the deadline.
MLPerf Inference v3.1 and v3.0 system IDs:
- 3.1-0058, 3.1-0061 Dell PowerEdge R750xa (4x A100-PCIe-80GB, TensorRT)
- 3.1-0062 Dell PowerEdge R750xa (4x H100-PCIe-80GB, TensorRT)
- 3.1-0064 Dell PowerEdge R760xa (4x H100-PCIe-80GB, TensorRT)
- 3.0-0008 Dell PowerEdge R750xa (4x A100-PCIe-80GB, TensorRT)
The MLPerf™ name and logo are trademarks of MLCommons Association in the United States and other countries. All rights reserved. Unauthorized use strictly prohibited. See www.mlcommons.org for more information.