
Login phase
Login phase
-
Login VSI
Login VSI version 4.1.40.1 Pro is used in this test to run workload tests that closely simulate a real VDI environment. Login VSI manages the process of automatically logging users on and running common daily worker tasks. Tasks include Microsoft Office document creation and editing, email, web browsing, viewing videos, creating .zip files, and so on. Login VSI also logs all users off at the end of steady state. Login VSI captures performance metrics during the login phase that are used to generate performance results including graphs.
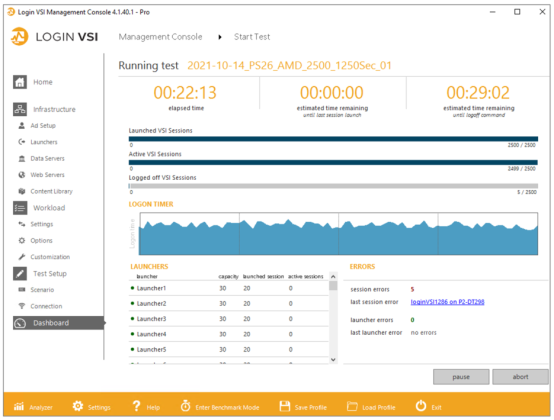
Figure 13. Running a test with the Login VSI management console
Test parameters
This test is configured to log in 2,500 Login VSI knowledge worker users in less than 21 minutes, at a steady rate of two users each second. The desktop VMs in the pool run Windows 10 version 21H1 with 2 vCPUs and 4 GB of memory each. This login rate is more aggressive than might be typical in a user environment. This configuration shows how well the PowerEdge servers and PowerStore 9000 perform when a short time window is specified to log in 2,500 users.
VDI user login rates are typically gradual and spread out at the beginning of a workday or work shift. User log offs are also typically gradual and spread out. However, rapid login and log off events are possible and should be planned for. For example, a power outage forces all desktops to reset simultaneously. Once power resumes, the array experiences a burst in I/O and CPU demand as instant clone desktops refresh. In addition, many users may attempt to log back into their VDI desktop VMs simultaneously causing a login storm. For this reason, for large VDI deployments, it is desirable to dedicate a PowerStore array to VDI to avoid impacting other workloads when these events occur.
User environments where boot storm, mass login, and mass log off events are typical may support fewer total VDI users. Running more recent versions of Windows 10 may also reduce the user count due to higher memory, CPU, and I/O demands. A lower VDI user count helps ensure adequate host server and storage array performance where boot, login, or log off storms are anticipated. Other factors unique to each environment may result in a lower or higher VDI user count for a similarly configured scenario as shown in this test. Understanding key design elements, user needs, and workload behavior (and in particular, unexpected behavior) is critical to right-sizing a VDI environment.
Server and storage test results
The login phase is where users connect to virtual desktops and start running Knowledge Worker tasks. The login phase for this test is set to less than 21 minutes for 2,500 users (two new users log in every second). The figures below show the PowerEdge and PowerStore performance results during the login phase.
PowerStore shows a steady and gradual increase in IOPS and bandwidth while maintaining submillisecond latency throughout the period.
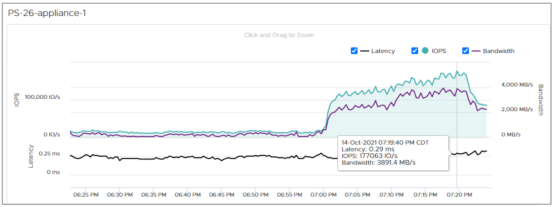
Figure 14. Login phase – PowerStore 9000 IOPS, bandwidth, and latency
Peak storage bandwidth during the login phase is 3943.5 MB/s at 0.29 milliseconds latency. As expected, read bandwidth is higher than write bandwidth during the login phase. During steady state, this pattern reverses as shown below.
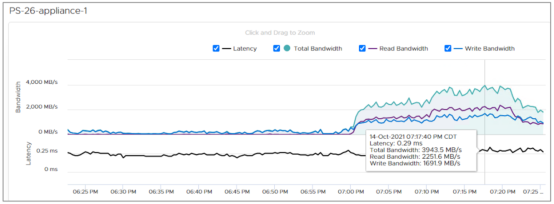
Figure 15. Login phase - PowerStore 9000 bandwidth detail
Peak storage IOPS during the login phase is 177,063 IO/s, with read IOPS higher than write IOPS.
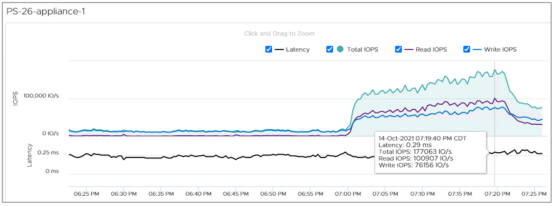
Figure 16. Login phase - PowerStore 9000T IOPS detail
During the login phase, peak storage write latency is 0.54 milliseconds and peak read latency is 0.15 milliseconds.
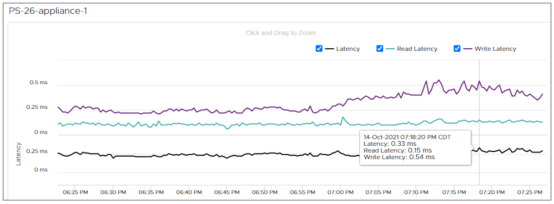
Figure 17. Login phase - PowerStore 9000T storage latency detail
Storage CPU utilization ramps linearly and ranges from 25% to 49% during the login phase.
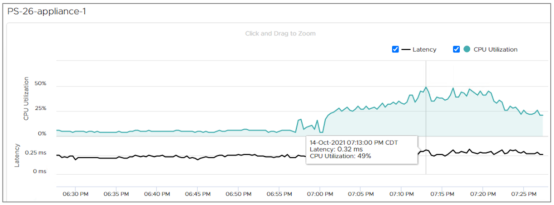
Figure 18. Login phase - PowerStore 9000T CPU utilization detail
Storage I/O size during the login phase averaged 24 KB with steady results.
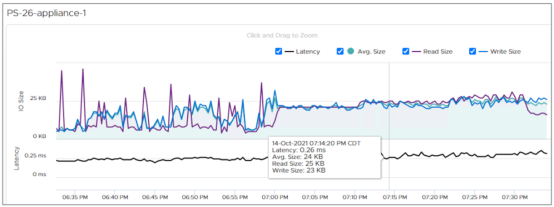
Figure 19. Login phase - PowerStore 9000T I/O size detail
Consumed CPU on the PowerEdge servers toward the end of the login phase briefly exceeds 90% on some hosts. CPU demand quickly diminishes once the test enters steady state. A less aggressive login rate would place less CPU demand on the servers during the login phase. CPU and memory utilization are well balanced in this test as there is no degradation in performance.
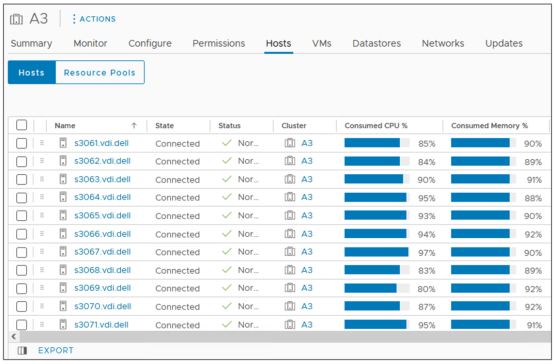
Figure 20. Login phase - PowerEdge 6525 host server CPU and memory at peak demand
The PowerEdge Server iDRAC9 may report different CPU usage than vCenter. In this example, iDRAC for the PowerEdge R6525 host named s3061 reports 69% usage and vCenter reports 85% consumed at the same point in time. This difference is because iDRAC9 and vCenter use different metrics to calculate overall CPU usage.
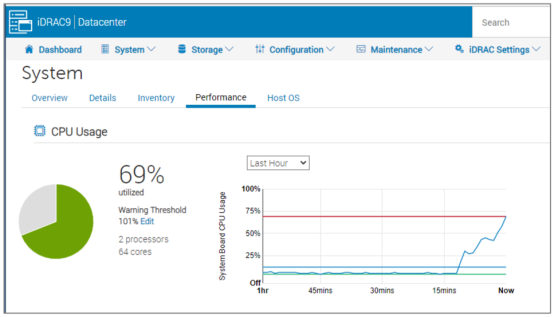
Figure 21. Login phase - PowerEdge 6525 server iDRAC9 CPU usage
For more information, see the Integrated Dell Remote Access Controller 9 User’s Guide, and CPU Counters and VMware KB 2055995 at wmware.com.
Login VSI test results for login phase
Figure 22 and Figure 23 show the Login VSI test results for the login phase. The login phase is typically more resource intensive than the steady state phase when the login rate is aggressive.
For this test, 2,499 of 2,500 sessions launched successfully in 1250 s, with 17 sessions failing during the test. It is typical that a few VM desktops fail when running large automated test scenarios.
The test summary indicates a baseline performance of 622 (very good) which is 838 lower than the performance threshold.
The summary indicates that this configuration could support more sessions. The performance results from the PowerStore 9000 indicate it could support many more VDI users if server capacity is increased. The ability to scale in this testing is a function of the aggregate CPU and memory capacity of the 11 PowerEdge R6525 host servers as configured. Adding additional PowerEdge servers to the VDI workload cluster would permit additional VDI scale for this scenario.
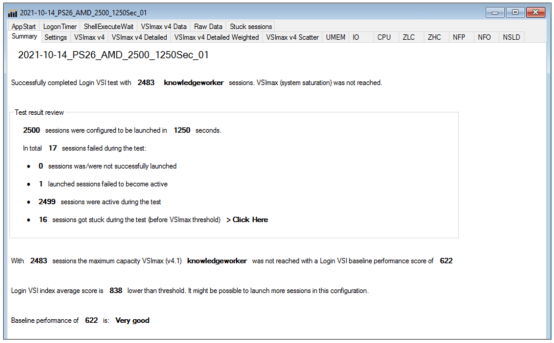
Figure 22. Login phase - Login VSI test summary for 2,500 user test
The VSImax threshold metric helps predict the number of estimated users supported based on performance as the workload increases, as factored against response time from applications. The graphs show that resource demand ramps predictably and linearly under load. The 11 PowerEdge R6525 servers and PowerStore 9000T model appliance perform very well.
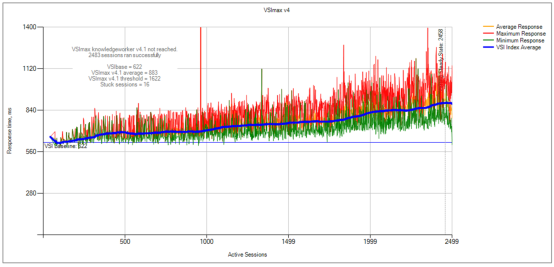
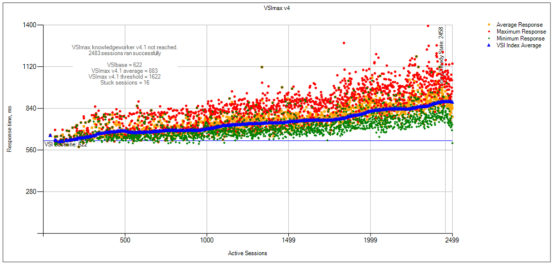
Figure 23. Login VSImax v4 test results for 2,500 user test (line graph and scatter graph)