
Intelligent Power Distribution Unit (iPDU)
Intelligent Power Distribution Unit (iPDU)
-
A common theme Dell hears from our customers is that they are looking for the ability to monitor data center power consumption at rack levels of granularity as they are allocated up to a certain amount of KW per rack. Being able to see how much power the rack is consuming, regardless of the equipment contained inside, is of paramount importance.
Beginning with the PowerMaxOS V10.1 release, all PowerMax 2500 and 8500 systems use Dell designed intelligent power distribution units (iPDUs) as the default rack power distribution option. These iPDUs provide real-time rack level telemetry and monitoring of the system’s power consumption, voltage, current, external temperature, and humidity. Each PowerMax 2500 system comes with a pair of iPDUs, while PowerMax 8500 systems can come with up to two pairs (a pair per rack). The iPDUs can be installed in a daisy chain configuration so aggregate power consumption for the entire systems can be monitored.
At their core, these iPDUs support three power personalities: three-phase Delta, three-phase Wye, and single-phase power. This power distributed through twenty-seven C13 output connecters with twelve breakers per iPDU. Each iPDU also comes with four temperature and two humidity sensors.
These iPDUs offer next generation PowerMax customers the following key advantages:
Enhanced Power Monitoring: The iPDU features a rich set of secure remote power monitoring tools which can collect and display real-time telemetry data. This allows for continuous and detailed power monitoring of the PowerMax at the system / rack level. These tools provide visibility into the total power consumption, voltage levels, current draw, power factor, and other relevant metrics.
Proactive Maintenance and Troubleshooting: By using the rich set of monitoring tools the iPDU provides, customers can monitor power metrics in real-time and identify power-related issues or abnormalities immediately. This allows for take prompt action to address potential problems, minimizing downtime and preventing equipment damage. Earlier detection of power fluctuations or irregularities will help prevent costly disruptions and improve system reliability.
Capacity Planning and Optimization: Accurate and real-time power monitoring data provided by the iPDU facilitates effective capacity planning and optimization. Administrators can analyze PowerMax power consumption patterns, identify trends, and make informed decisions regarding power allocation and resource utilization. This helps ensure optimal utilization of power resources, prevents overloading, and allows for efficient planning of future power requirements.
Energy Efficiency and Cost Savings: Real-time power monitoring empowers next generation PowerMax customers to implement energy-efficient practices and reduce power wastage. This information enables them to implement energy-saving measures, such as load balancing, equipment consolidation, or power capping, leading to reduced energy consumption and additional cost savings.
Compliance and Reporting: The ability to collect and analyze power data in real-time helps next generation PowerMax customers generate accurate reports on power usage, energy efficiency, and environmental impact for the storage environment. This information can be vital for demonstrating compliance, meeting sustainability goals, and reporting to regulatory bodies or stakeholders.
The next section will describe how the iPDUs innovative design and intelligent components help deliver the above advantages to next generation PowerMax customers.
A Modular Design
The next generation PowerMax iPDU is a modular design allowing its core components to be swapped or added using a tool-less approach. This allows for simple power personality changes and enhanced serviceability compared to previous generation PowerMax power distribution options. Each iPDU has the following core components: the iPDU chassis, the intelligent Reporting Module (iRM), and intelligent Power Distribution Panel (iPDP).
The iPDU Chassis
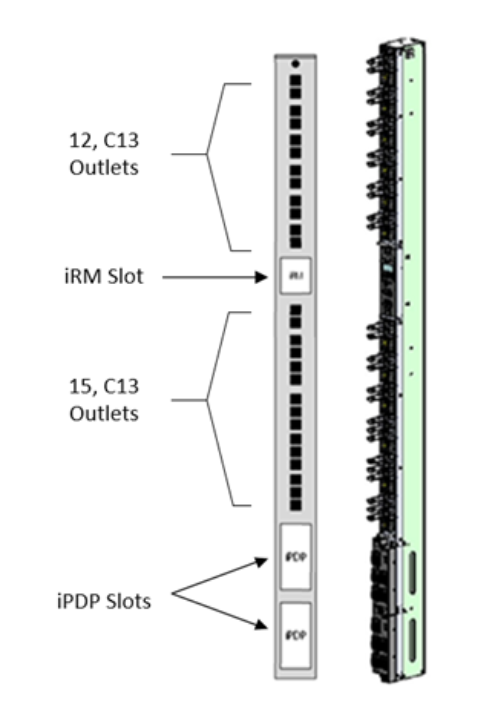
The iPDU chassis is the base element in which all the modular components fit into. The chassis contains all the 27 C13 power outlets, 12 breakers, a slot for the iRM, and two slots for iPDPs. The modular nature of the iPDU chassis allows for:
Vastly improved flexibility and customization as iPDU modules can be easily added, removed, and reconfigured as needed. This flexibility allows for the ability to adapt the next generation PowerMax to different power densities, power profiles, and connectivity options, helping to ensuring compatibility with various equipment and environments.
Improved Scalability and future proofing as the modular iPDU chassis allows for the addition of a second iPDP to provide additional power capacity up to a 28.8 kVA for the entire iPDU. Each iPDP can support a power maximum of 14.4 kVA. A single iPDP can provide power to all 27 C13 outlets; however, when additional power is required, as second iPDP of the same power personality can be added into the iPDU chassis to bring the iPDU’s total supported power to 28.8 kVA.
Greatly simplified maintenance and troubleshooting as the interchangeable modules can be easily identified and replaced without disrupting power distribution to the connected PowerMax. For example, if the reporting module in the iPDU suffers a fault, a tool-less replacement of the faulty reporting module can be performed without impacting the power distribution. This modularity greatly reduces downtime and ensures quick restoration of power in case of module failure. This ensures the overall system availability and minimizing any downtime risk to the mission critical PowerMax operations.
The iPDU Chassis
The intelligent Reporting Module
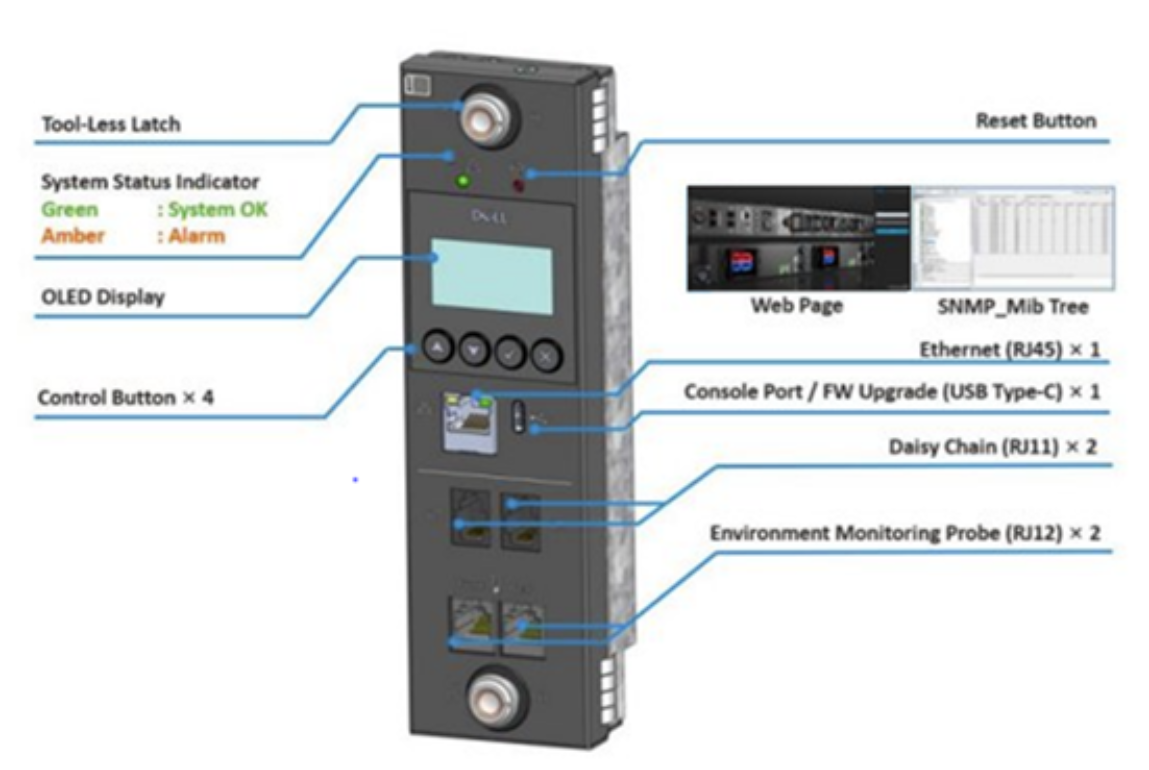
Each iPDUs comes standard with an intelligent Reporting Module (iRM). The iRM unit is a replaceable module that fits into the center of the iPDU chassis. The iRM is “the brains” of the iPDU as it houses all the remote monitoring interfaces which include the Power Consumption Dashboard web interface application, the SNMP interface, and Redfish interface. All data collection duties are performed by the iRM. Customers can access this data real time by connecting the iRM’s RJ45 port into their customer management network and assigning an IP address. The iRM contains two RJ11 ports for the daisy chain connections to other iPDUs in the PowerMax system. It also contains a USB-C connection port which a serial console can be connected for initial configuration activities such as configuring the network requirements for use with as static IP addressing or Dynamic Host Configuration Protocol (DHCP). It also contains two RJ12 ports in which the environmental probes are connected.
It is important to emphasize that there is no control access (i.e. the ability to turn on or off) through the iRM for the 27 C13 power outlets, the iPDP, or any of the internal breakers. The iRM can only be used for data collection and remote monitoring activities. To halt power being distributed through a specific C13 outlet, an individual needs to be physically in front of the rack in which the iPDU is installed, and then manually disconnect the attached rack component power supply from the outlet. The inability to control the power distribution through the iRM (or any of the remote monitoring interfaces) is implemented in this manner by design for security purposes.
The iRM module
The intelligent Power Distribution Panel
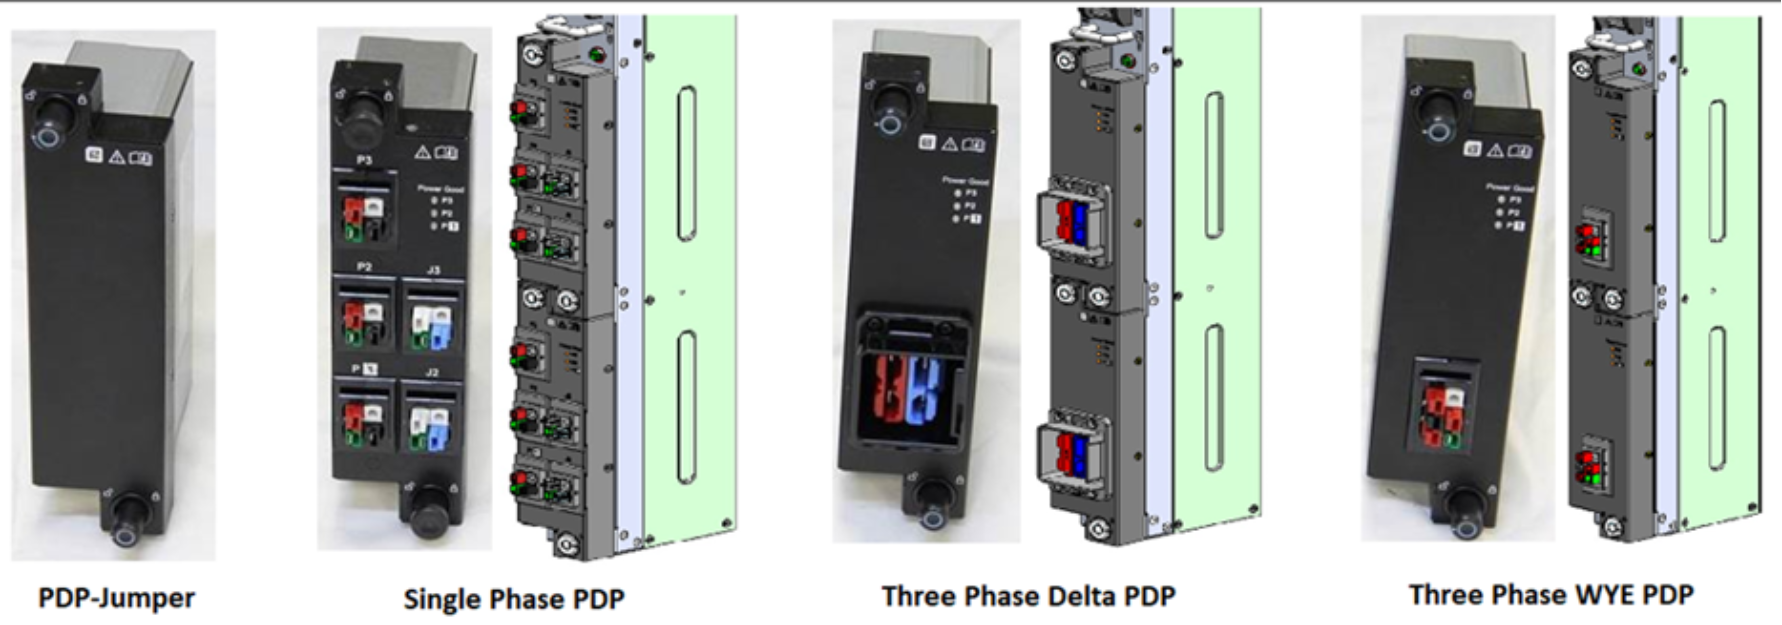
Each iPDU comes with two available slots for intelligent Power Distribution Panels (iPDPs). The iPDP acts as the main receiver and distributor of electrical power within the iPDP. The power being fed into the iPDP is typically from the data center AC main power runs from the electrical grid. The iPDP is an intelligent component as it contains sensors which continuously monitor the incoming voltage, amperage, and power coming in from the AC main it is connected to. This data is fed to the iPDU iRM from which the customer can interface with for remote monitoring.
Each iPDU comes standard with a single 14.4 kVA iPDP, which can be of three phase Delta, three-phase Wye, or single-phase power personalities. In single iPDP configurations, the second iPDP slot in iPDU can be occupied by a PDP jumper component. The use of a jumper allows for the single iPDP to provide power to the upper 12 C13 outlets. Without the jumper component, the single iPDP will only provide power to the lower 15 C13 outlets in the iPDU.
As said earlier, the addition of a second iPDP into the iPDU configuration will allow the customer to double the iPDU’s power capacity to 28.8 kVA. In a dual iPDP configuration, the iPDP jumper is removed from the upper iPDP slot and the second iPDP. The lower iPDP will supply power to the lower 15 C13 outlets, while the upper iPDP will control the upper 12 C13 outlets. The ability to add a second iPDP into the iPDU eliminates the need to add an additional iPDU pair into the rack to increase the power capacity.
intelligent Power Distribution Panel (iPDP) components
The iPDP’s modular nature allows for simple toolless replacement and swap out. For example, to convert the rack power profile from single phase to three phase, the installed single-phase PDPs can be exchanged with three phase PDPs. This provides significant time savings and ease of use benefit for customers as with traditional PDUs, the entire rack zone power infrastructure would need to be disconnected so that the entire PDU can be replaced to accomplish this operation.
In summary, the modular nature of the iPDU provides flexibility, scalability, ease of maintenance, efficient power management, and enhanced reliability. It offers next generation PowerMax customers a customizable power distribution solution that can adapt to changing needs and ensure the uninterrupted availability of power for the mission critical workloads running on the system.
Standard iPDU Rack Deployments
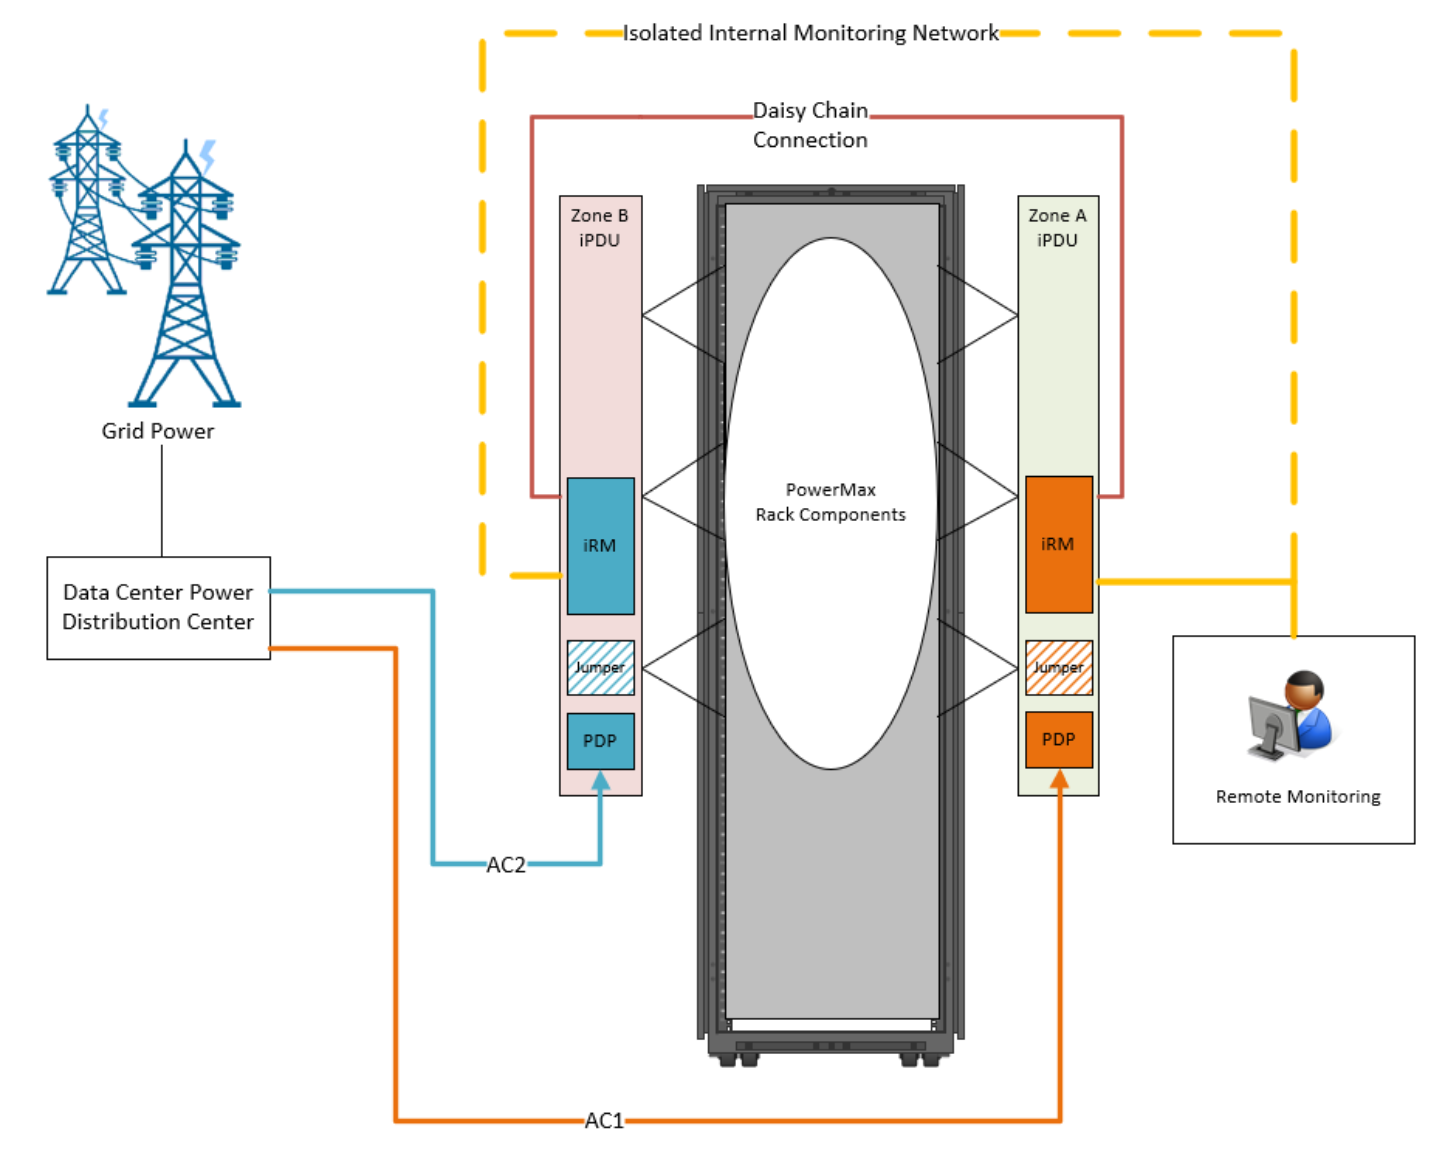
Each PowerMax rack will be deployed with a pair of iPDUs – one for rack power zone A and one for rack power zone B. The AC power mains from the data center’s primary power distribution center will be connected to the iPDPs. The default configuration is that each iPDU will ship with a single iPDP in the lower slot with a PDP jumper in the PDP second slot to deliver 14.4 kVA of power to each rack power zone. An additional iPDP will be shipped with each iPDU only if the shipped PowerMax configuration power requirements warrant it. Other key deployment elements are:
Next generation PowerMax racks are shipped with the iPDUs daisy chained. The rack iPDUs are daisy chained by running a cable between their iRM’s RJ11 ports. Daisy chaining allows for the monitoring of both iPDUs through a single monitoring network IP address, providing aggregate rack level power consumption telemetry to remote monitoring stations.
When daisy chained, only one of the racks iPDUs iRM RJ45 ports need to be connected and assigned an IP address to the monitoring network. Connecting the rack’s other iPDU to the monitoring network is optional; however, it is recommended that both iPDUs be connected to the monitoring network for redundancy purposes.
Standard 14.4 kVA iPDU deployment
Secure Remote Monitoring Capabilities
A key benefit of the next generation PowerMax iPDU is its ability to collect and monitor real-time telemetry of PDU power, voltage, current, frequency, external temperature, and humidity. This telemetry reporting plays a crucial role in monitoring and managing the power consumption of the PowerMax system effectively.
A key design requirement for the iPDU was to remotely monitor its telemetry data and send alerts to centralized network monitoring tools for the quick detection of faults, anomalies, and other abnormal conditions. These real time alerts and notifications can be generated based on user defined thresholds. When these thresholds are exceeded, the iPDU will send an alert allowing administrators to quickly take corrective action to prevent equipment damage, mitigate risks, and ensure the continuity of the power supply to the PowerMax.
The next generation PowerMax iPDU provides customers with three interfaces to perform remote monitoring and alerting: The iPDU’s Power Dashboard application, an SNMP interface, and a Redfish interface. These remote monitoring interfaces are accessible from any device which has a connection to the management network in which the iPDU’s iRM RJ45 port is connected to and is configured for (IP Address, gateway). It is important to re-emphasize that a user can only use these interfaces for monitoring only as they and the iRM itself have no control over the power distribution within the iPDU. For example, a user can reboot and update firmware for the iRM module through the Power Consumption Dashboard. This act, however, does not impact the distribution of power through the iPDU chassis as the iRM is isolated from the power distribution portion of the iPDU by design for security purposes.
The Power Consumption Dashboard Application
The Power Consumption Dashboard provides customers with a web based graphical user interface (GUI) in which the iPDU’s telemetry data can be monitored, exported, and alerted upon. A user can access the Power Consumption Dashboard by entering the IP address assigned to the iPDU in any modern web browser such as Google Chrome and Microsoft Edge (i.e. https://<iPDU_IP_Address>). The Power Consumption Dashboard application uses Secure Socket Layering (SSL) and a specific user definable username and password for access.
Once accessed, the Power Consumption Dashboard has a landing page which provides a high-level view of the iPDUs total power consumption, voltage, and amperage of the phases. It also provides alert status, firmware version, and other key iPDU information.
Power Consumption Dashboard landing page

Power Consumption Dashboard landing page items
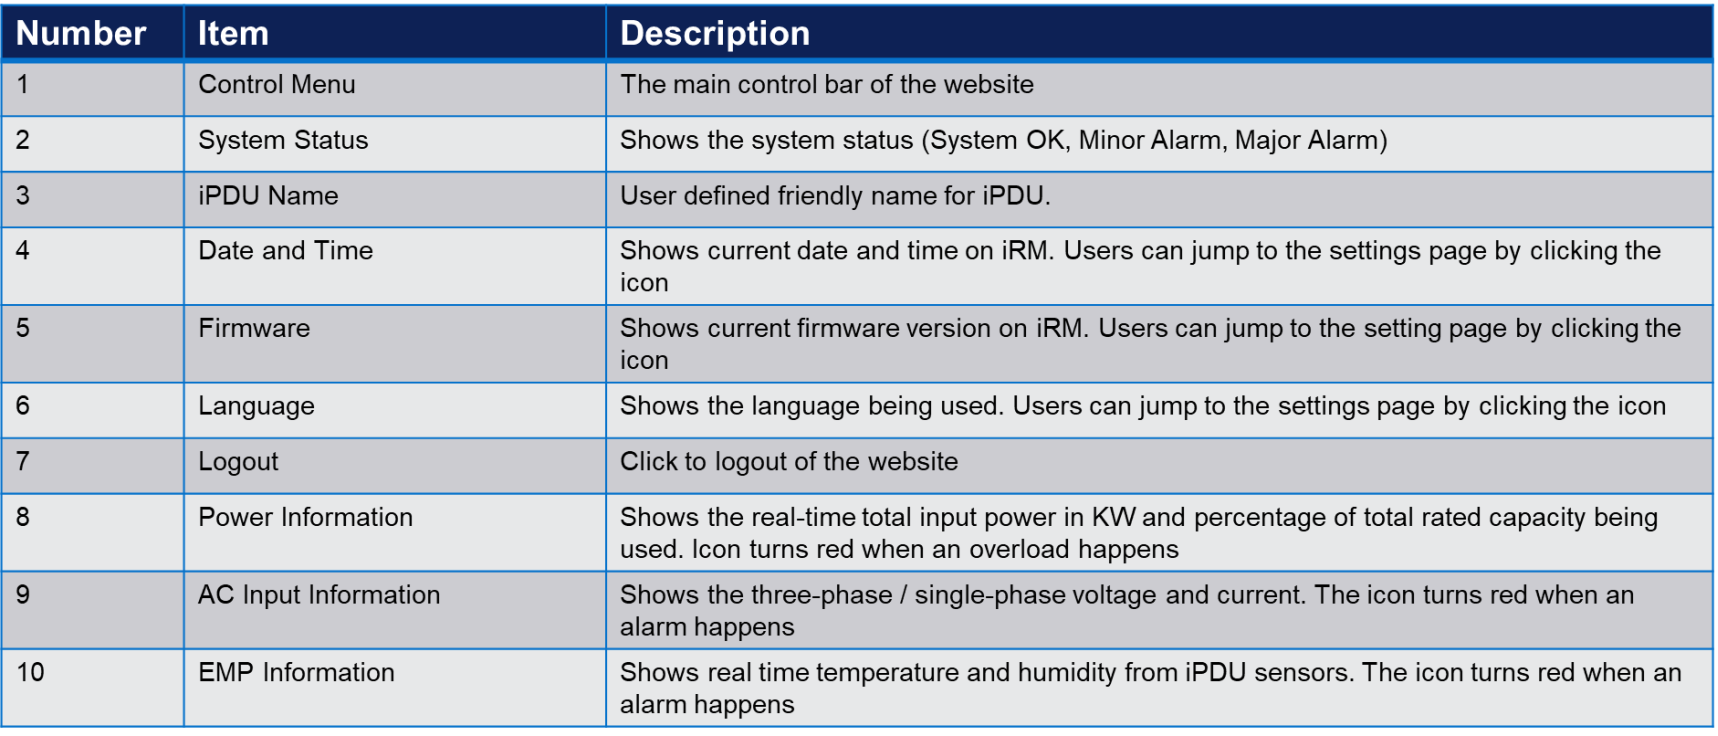
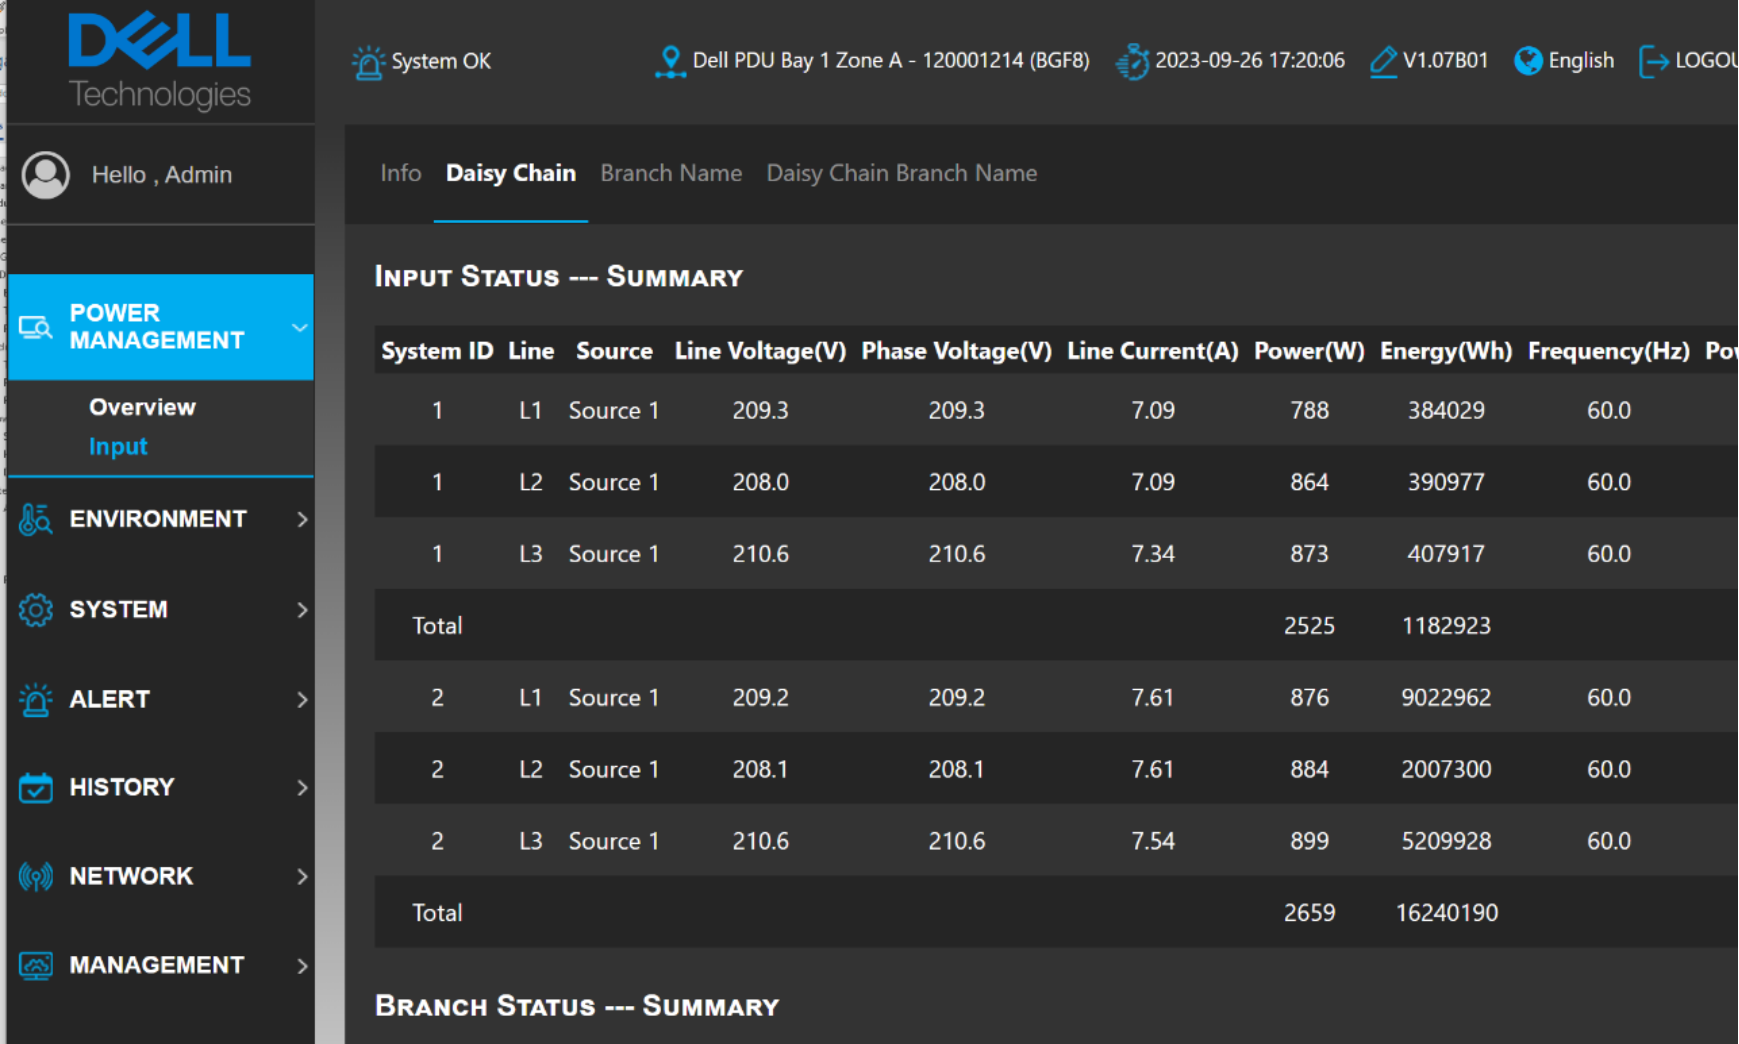
As one navigates the control menu, the aggregate power consumed, voltage, and amperage consumed by the iPDU and its daisy chain connected iPDUs can be seen by selecting the Power Management Daisy Chain tab
Figure 2. Power Consumption Dashboard Daisy Chain tab


The overall design of the Power Consumption Dashboard is simple and basic. Critical iPDU information is provided on the landing page, with other critical information no more than one menu level deep.
In summary, the iPDU’s Power Consumption Dashboard application provides customers with a simple, easy to understand web GUI interface that can be used to remotely monitor the power consumption of the PowerMax at the rack level. Multiple iPDUs from the PowerMax racks can be daisy chained together to provide an aggregate total power consumption view of the entire system.
Scale out monitoring using the SNMP and Redfish interfaces
While the iPDU’s Power Consumption Dashboard application allows for a simple aggregate view of power consumption at the rack and system level, it is equally important to be able to monitor power consumption at scale. Monitoring at scale means being able to not only monitor the rack level power consumption of a single PowerMax system and its daisy chained iPDUs, but also being able to monitor the power consumption of multiple PowerMax systems across the entire SAN fabric. To allow for this, the Dell iPDU includes support for industry standard Redfish and SNMP (V1, V2c, and V3) interfaces for seamless integration into customer custom, other Dell, and third-party network management systems1.
Note: The Dell iPDU will have a full integration into Nlyte Software’s Nlyte Energy Optimizer (NEO) application, Integration into Dell’s Open Manager Enterprise (OME), Storage Resource Manager (SRM), and CloudIQ post release. Please check with your local sales team for more information and availability of these integrations.
Making use of the iPDUs SNMP and Redfish interfaces allows customers to do the following:
Easy integration into existing network management infrastructure: Redfish and SNMP are industry-standard management protocols used for monitoring and controlling devices in large networks. By supporting both interfaces, the Dell iPDU can be seamlessly integrated within existing network management systems that utilize either protocol. This ensures compatibility and allows for easy aggregation of the PowerMax power consumption data into the overall data center monitoring and reporting mechanisms. The key benefit here is that this provides customers a holistic power consumption view of the entire SAN fabric which includes the PowerMax storage, compute, and network elements. This holistic view of the SAN fabric infrastructure facilitates better coordination, troubleshooting, and optimization of power management.
Centralized Alert Management: The iPDU can generate alerts and notifications based on predefined thresholds or events. These alerts can be sent via SNMP traps, Syslog, or Redfish event notifications to fabric network management systems to alert system administrators or about critical conditions such as power failures, overloads, or abnormal temperature levels. This proactive notification helps in timely response and troubleshooting.
- Orchestration and automation: The Redfish and SNMP interfaces enable centralized monitoring and collection of telemetry data of multiple iPDUs through orchestration scripts. This greatly simplifies operations and reduces the time and effort required to monitor the deployed iPDUs. For example, below is a sample PowerShell script which uses the iPDU’s Redfish interface which displays the iPDU’s total power information (Item 8 in Figure 16 and in Figure 17). This example script prompts the user for an iPDU's IP address, validates it, handles authentication, and retrieves power data using the obtained authentication token. It incorporates error handling and displays appropriate messages throughout the process. A more detailed explanation of each script section is provided in this paper's appendix section.
Figure 3. A sample PowerShell Script using the iPDU’s Redfish interface to monitor power data.
# Enter IP Address of iPDU
$isValidIpAddress = $false
do {
$ipAddress = Read-Host -Prompt “Enter the iPDU’s IP address”
$ip = $null
if ([System.Net.IPAddress]::TryParse($ipAddress, [ref]$ip)) {
$isValidIpAddress = $true
} else {
Write-Host “The entered IP address is not valid. Please enter a different IP address.”
}
} until ($isValidIpAddress)
$url = “https://$ipAddress/redfish/v1/SessionService/Sessions”
$powerUrl = “https://$ipAddress/redfish/v1/PowerEquipment/RackPDUs/1/Sensors/PDUPower”
# Create a session to handle the authentication
$session = [System.Net.HttpWebRequest]::Create($url)
$session.Method = “POST”
$session.ContentType = “application/json”
# Set the timeout for the session request
$session.Timeout = 120000 # 120 seconds (change as required)
# Prompt for username and password
$credentials = Get-Credential -Message “Enter your credentials”
# Send a POST request to authenticate and obtain the authentication token
$payload = @{
UserName = $credentials.UserName
Password = $credentials.GetNetworkCredential().Password
} | ConvertTo-Json
$payloadBytes = [System.Text.Encoding]::UTF8.GetBytes($payload)
$session.ContentLength = $payloadBytes.Length
$stream = $session.GetRequestStream()
$stream.Write($payloadBytes, 0, $payloadBytes.Length)
$stream.Close()
$response = $session.GetResponse()
$authenticationToken = $response.Headers[“X-Auth-Token”]
# Check if the authentication was successful
if ($response.StatusCode -eq 201) {
Write-Host “Authentication successful. Authentication Token: $authenticationToken”
$encodedCredentials = [System.Convert]::ToBase64String([System.Text.Encoding]::UTF8.GetBytes(“$($credentials.UserName):$authenticationToken”))
# Use the authentication token for subsequent requests
$powerRequest = [System.Net.HttpWebRequest]::Create($powerUrl)
$powerRequest.Method = “GET”
$powerRequest.Headers.Add(“X-Auth-Token”, $authenticationToken)
$powerRequest.Headers.Add(“Authorization”, “Basic $encodedCredentials”)
# Set the timeout for the power request
$powerRequest.Timeout = 300000 # 300 seconds (change the timeout as needed)
try {
$powerResponse = $powerRequest.GetResponse()
# Check if the power request was successful
if ($powerResponse.StatusCode -eq 200) {
$powerStream = $powerResponse.GetResponseStream()
if ($powerStream.CanRead) {
$powerReader = [System.IO.StreamReader]::new($powerStream)
$powerData = $powerReader.ReadToEnd()
$powerReader.Close()
$powerStream.Close()
# Process the power response data as needed
Write-Host “Power data received:”
Write-Host $powerData
} else {
Write-Host “Power stream is not readable.”
}
} else {
Write-Host “Failed to retrieve power data. Status code: $($powerResponse.StatusCode)”
}
# Close the power response
$powerResponse.Close()
} catch {
Write-Host “An error occurred: $_”
}
} else {
Write-Host “Authentication failed. Status code: $($response.StatusCode)”
}
# Close the session response
$response.Close()
Figure 4. Script output:
Authentication successful.
Power data received:
{
“ElectricalContext”: “Total”,
“Id”: “PDUPower”,
“Name”: “Power reading for the PDU”,
“PhysicalContext”: “Chassis”,
“Reading”:848.24, <-- iPDU Power Data in watts (real time)
“ReadingType”: “Power”,
“ReadingUnits”: “W”,
“SensingInterval”: “PT0.1S”,
“Status”: {
“Health”: “OK”,
“State”: “Enabled”
},
“@odata.id”: “/redfish/v1/PowerEquipment/RackPDUs/1/Sensors/PDUPower”,
“@odata.type”: “#Sensor.v1_5_0.Sensor”
}
The above script could be enhanced to import a CSV file which contains the IP Addresses for all of the iPDUs in the SAN environment by inserting the following code at the beginning of the script:
# Import the CSV file containing iPDU IP addresses
$ipdus = Import-Csv -Path "c:/ipdus/ipdu_ips.csv"
# Iterate through each PDU IP address
foreach ($ipdu in $ipdus) {
$ipAddress = $ipdu.IPAddress
...
The first line of code imports the CSV file into the script in which each row of the file contains information about an iPDU including its IP address. The file is then iterated through row by row using a foreach loop where the IP address is parsed and then passed into the $ipAddress variable for the script. The script will then run through each iPDU in the file line by line gathering its real time power information. Note: the script would need to be modified to account for the various username and password combinations for each iPDU.
Overall, the Dell iPDUs Redfish and SNMP interfaces provide next generation PowerMax customers with enhanced power monitoring at scale, centralized control, and enhanced integration capabilities with third party network management software.
In summary, the Dell iPDU provides next generation PowerMax customers with extensive real-time telemetry and monitoring capabilities that provides valuable insights into the systems power consumption at the rack level. Using the iPDUs SNMP and Redfish interfaces, customers can monitor power consumption for the PowerMax storage environment at scale. This scale out monitoring capability can be used for capacity planning and compliance reporting, which in turn contributes to improved power efficiency and cost savings for the entire SAN infrastructure.