
Job monitoring and reporting
Job monitoring and reporting
-
The OneFS Job Engine provides detailed monitoring and statistics gathering, with insight into jobs and the Job Engine. Various Job Engine specific metrics are available using the OneFS CLI, including per job disk usage and so on. For example, worker statistics and job level resource usage can be viewed with the isi job statistics list CLI command. Also, the status of the Job Engine workers is available using the OneFS isi job statistics view CLI command.
PermissionRepair job events, including pause/resume, waiting, job success, failure, and so on, are reported under the Job Events tab of the WebUI. Additional information is available by clicking View Details for the appropriate job events entry in the WebUI. These events are accessed by going to Cluster Management > Job Operations > Job Events. A filter can be added to display all PermissionRepair job events or a specific job ID:
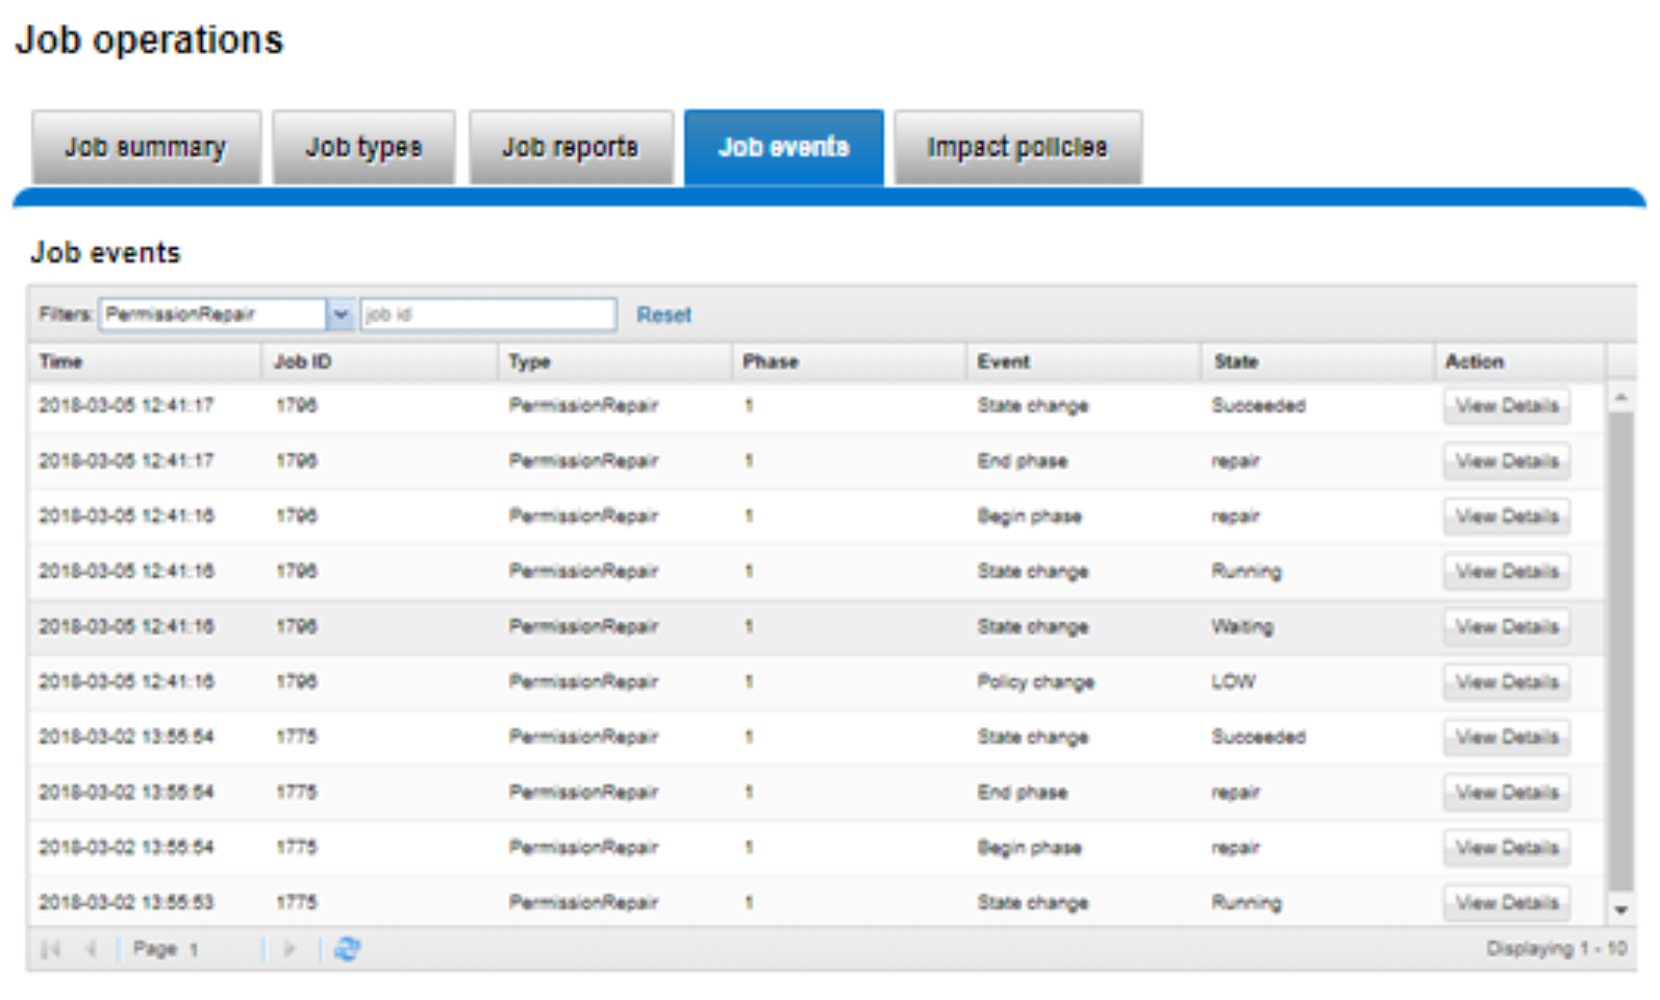
Figure 6. PermissionRepair job events
While the PermissionRepair job is running, an Active Job Details report is also available. This report provides contextual information, including elapsed time, current job phase, job progress status, and so on.
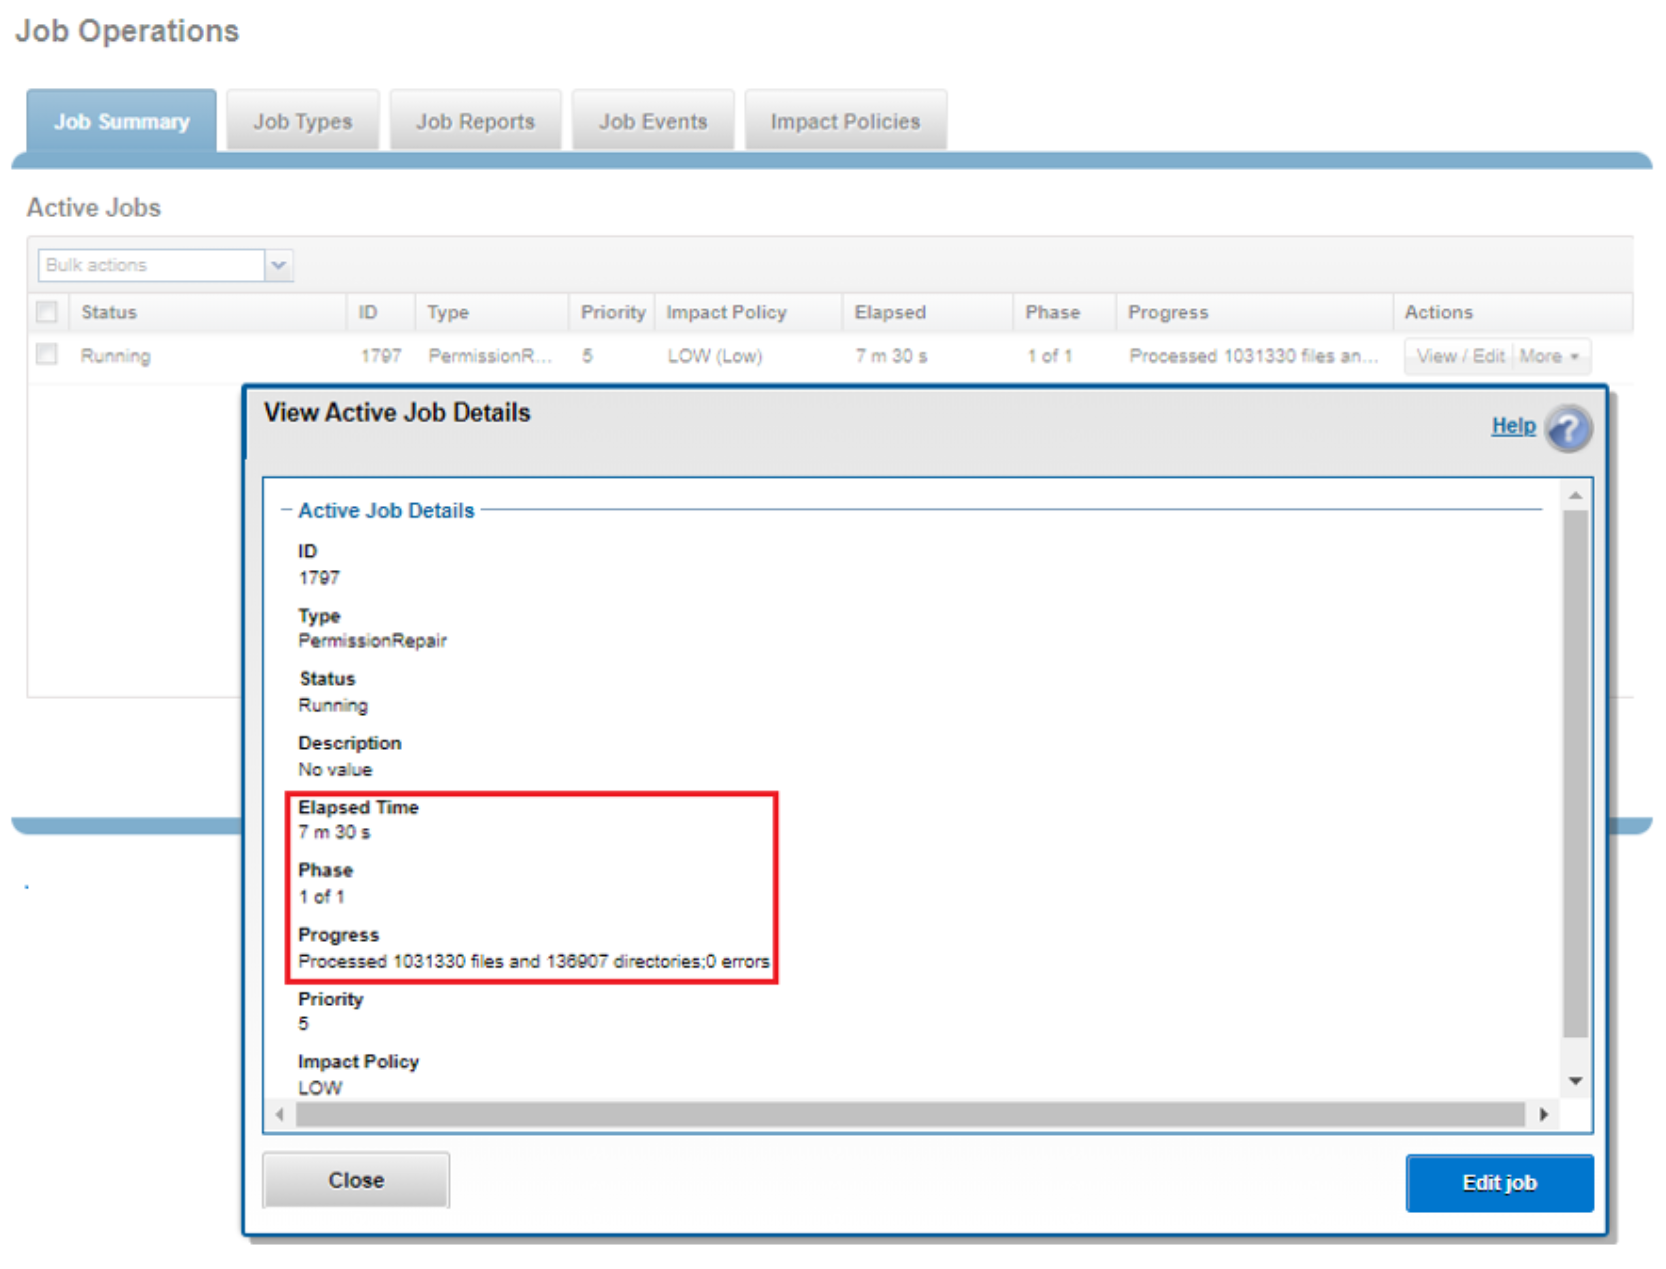
Figure 7. Permission Repair active job details
Job reports
A report is also provided for each PermissionRepair job. This report contains detailed information about runtime, the number of objects scanned, and other work details or errors.
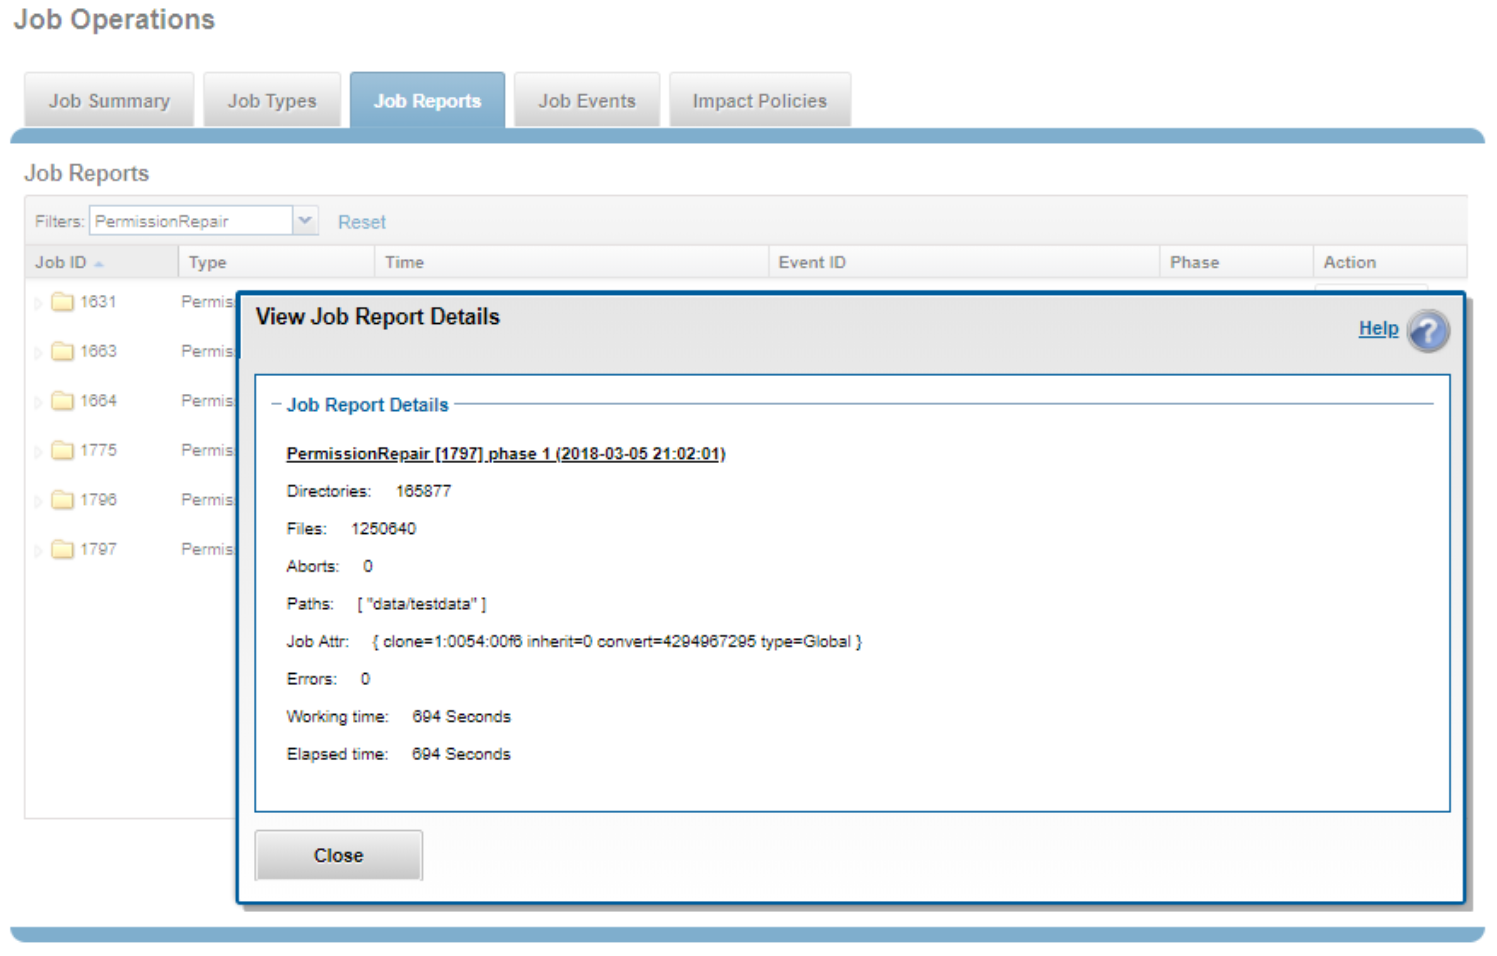
Figure 8. PermissionRepair job report
Similar active job details and job report information are available from the CLI using the following syntax:
# isi job jobs view <job ID>
OneFS performance resource management provides statistics for the resources used by jobs - both cluster-wide and per-node. This information is provided by using the isi statistics workload CLI command. Available in a top format, this command displays the top jobs and processes, and periodically updates the information.
For example, the following syntax shows, and indefinitely refreshes, the top five processes on a cluster:
# isi statistics workload --limit 5 --format=top
last update: 2018-03-05T16:45:25 (s)ort: default
CPU Reads Writes L2 L3 Node SystemName JobType
377.7ms 0.0 5.9k 25.8 0.0 3 Job: 1798 PermissionRepair[0]
368.6ms 0.0 0.0 0.0 0.0 3 system -
328.9ms 0.0 4.9k 18.4 0.0 1 Job: 1798 PermissionRepair[0]
326.2ms 0.0 0.0 0.0 0.0 2 celog -
262.3ms 0.0 3.4k 52.1 0.0 2 Job: 1798 PermissionRepair[0]
The resource statistics tracked per job, per job phase, and per node include CPU, reads, writes, and L2 and L3 cache hits. Unlike the output from the top command, this information makes it easier to diagnose individual job resource issues, and so on.