
isi statistics command
isi statistics command
-
The isi statistics command is an advanced tool that can be used to obtain various kinds of statistics that can help you measure the usage and performance of a PowerScale OneFS cluster. Isi statistics is a versatile utility with the various subcommand-level. It provides two subcommand-levels for protocols:
Protocol: Display cluster usage statistics organized by communication protocol.
Pstat: Generate the specified protocol detailed statistics along with CPU, OneFS, network, and disk statistics.
The NFS operations are grouped according to the classes in isi statistics as the Table 5 shows.
Table 5. NFS operations classes in isi statistics
Port
Service
Protocol
Usage description
4791
RoCEv2
UDP
In RoCEv2, the RDMA payload is encapsulated as UDP payload with the 4791 UDP destination port.
300
mountd
TCP/UDP
NFSv3 mount service.
302
statd
TCP/UDP
NFSv3 Network Status Monitor (NSM)
304
lockd
TCP/UDP
NFSv3 Network Lock Manager (NLM)
111
rpc.bind
TCP/UDP
ONC RPC portmapper that is used to locate services such as NFS, mountd. Only used by NFSv3 if NFSv4.x running on the standard registered TCP port 2049.
isi statistics protocol
You get the detailed NFS protocol operations performance data by running the following command:
isi statistics protocol list --protocols=nfs3,nfs4 --sort=TimeAvg --degraded
isi statistics pstat
The sub-command isi statistics psstat output can help you analysis the approximate mix of read, write, and metadata operations. Figure 19 is an example output by running the following command with --protocol=nfs3 option to get the NFSv3 statistics.
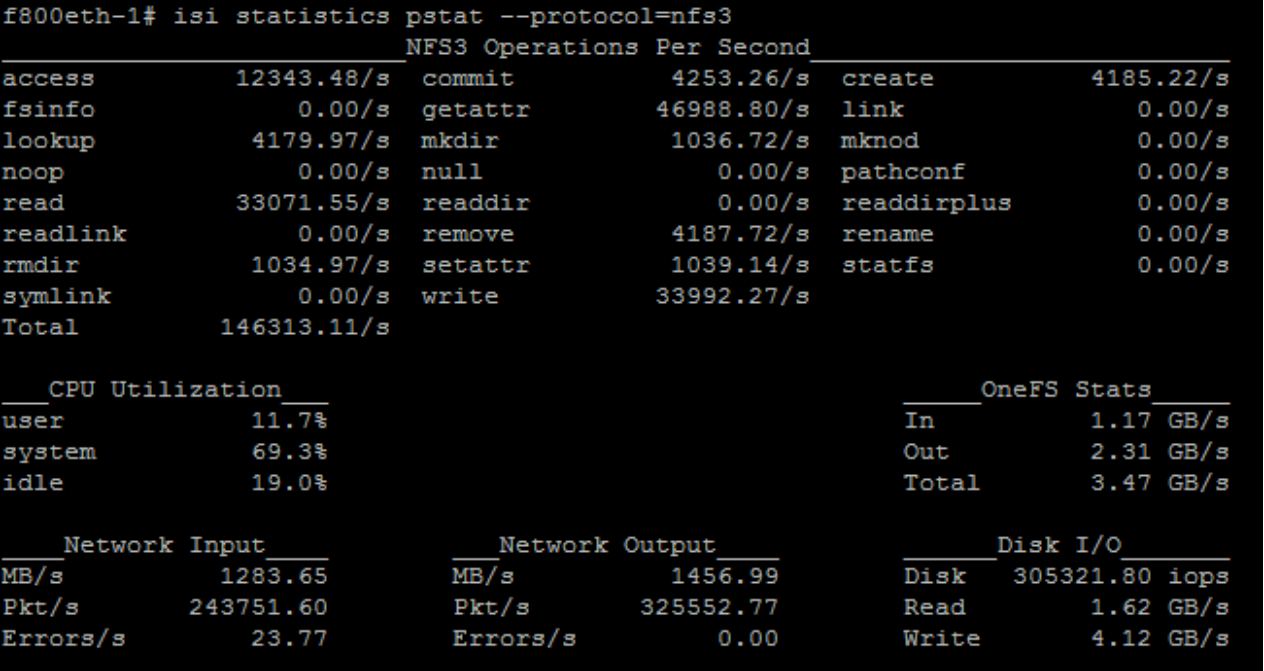
Figure 19. isi statistics pstat result for NFS
You can find each operation rates for NFSv3, in this example, subtract the 33071 ops/s for read and 33992 ops/s for write from the total 146313 ops/s, which leaves 79250 ops/s for metadata operations. So the NFSv3 read, write and metadata ratio approximately: read 22.6%, write 23.2%, metadata 54.2%.