
PowerFlex Historical Reporting
None
None
-
The summary reports are PowerFlex cluster level reports that summarize configuration, performance, and capacity information in an easy-to-read format. The summary reports are available as a card view and table view. The card reports have a similar look and feel to the capacity report on the PowerFlex Manager dashboard (Figure 15).
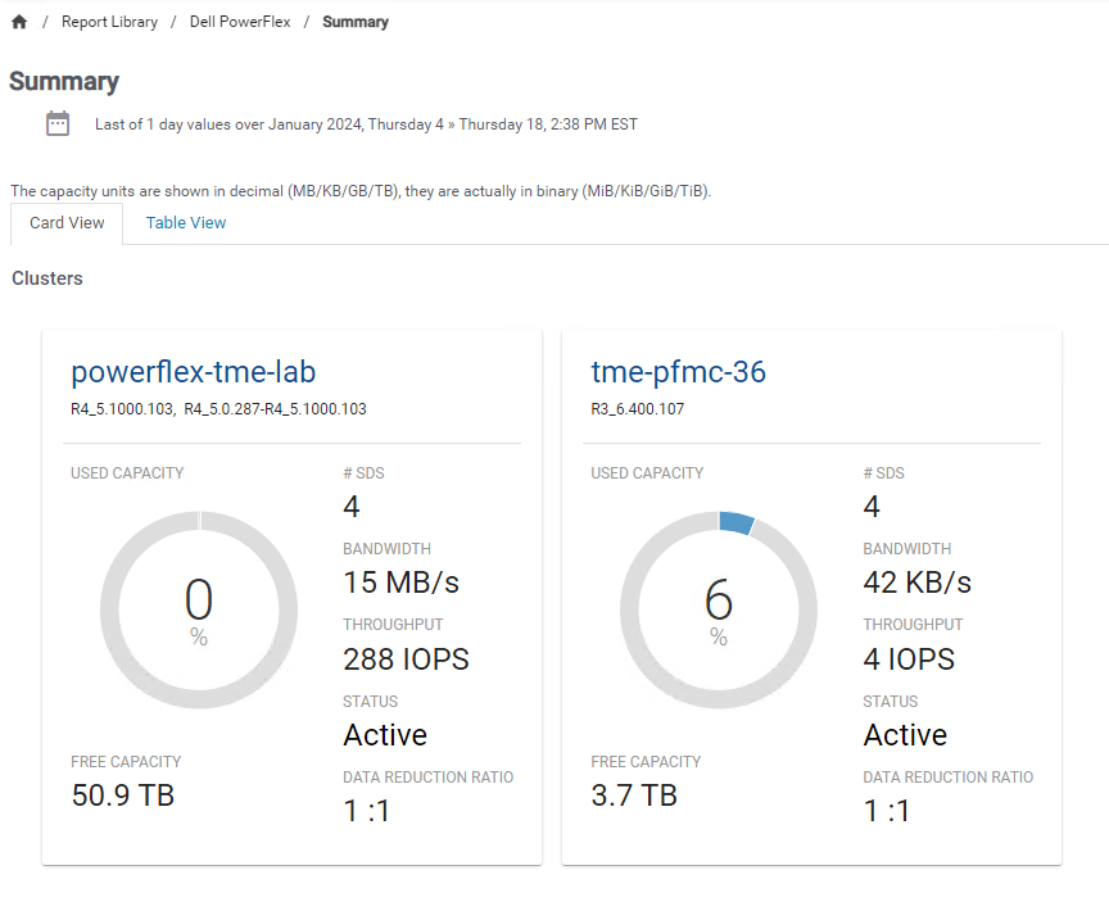
Figure 15. Summary report – card view
Switching to the table view provides more detailed information, such as the SDC count and a capacity summary for all PowerFlex clusters (Figure 16). Performance metrics include a trend line, to give administrators a quick historical reference to some metrics.
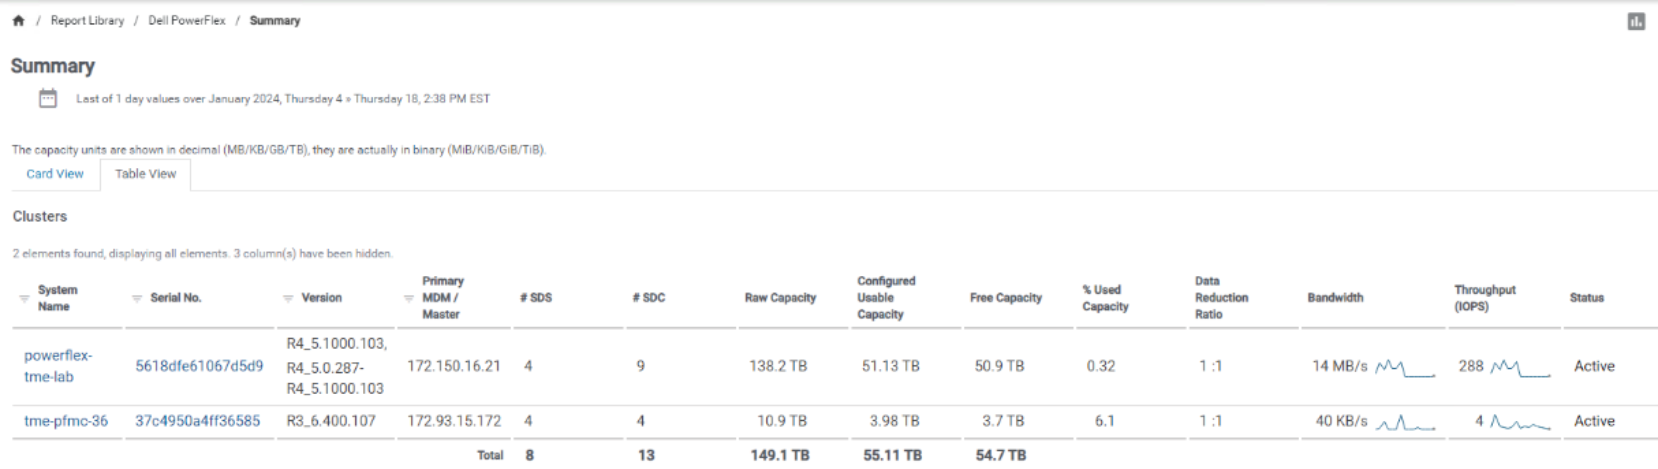
Figure 16. Summary report – table view