
None
None
-
SRM is modular in design, making it simple to add support for hosts, storage, and applications. Support for a device or application is enabled by installing a SolutionPack. A SolutionPack consists of a set of modules, including reports, preconfigured alert definitions, alert consolidation services, and data collection.
Data collection
Data collection modules collect performance, capacity, and alerts at predefined intervals. The default data collection intervals for PowerFlex are five minutes for performance, fifteen minutes for capacity metrics, and five minutes for alerts. The collection intervals are user configurable (Figure 2).
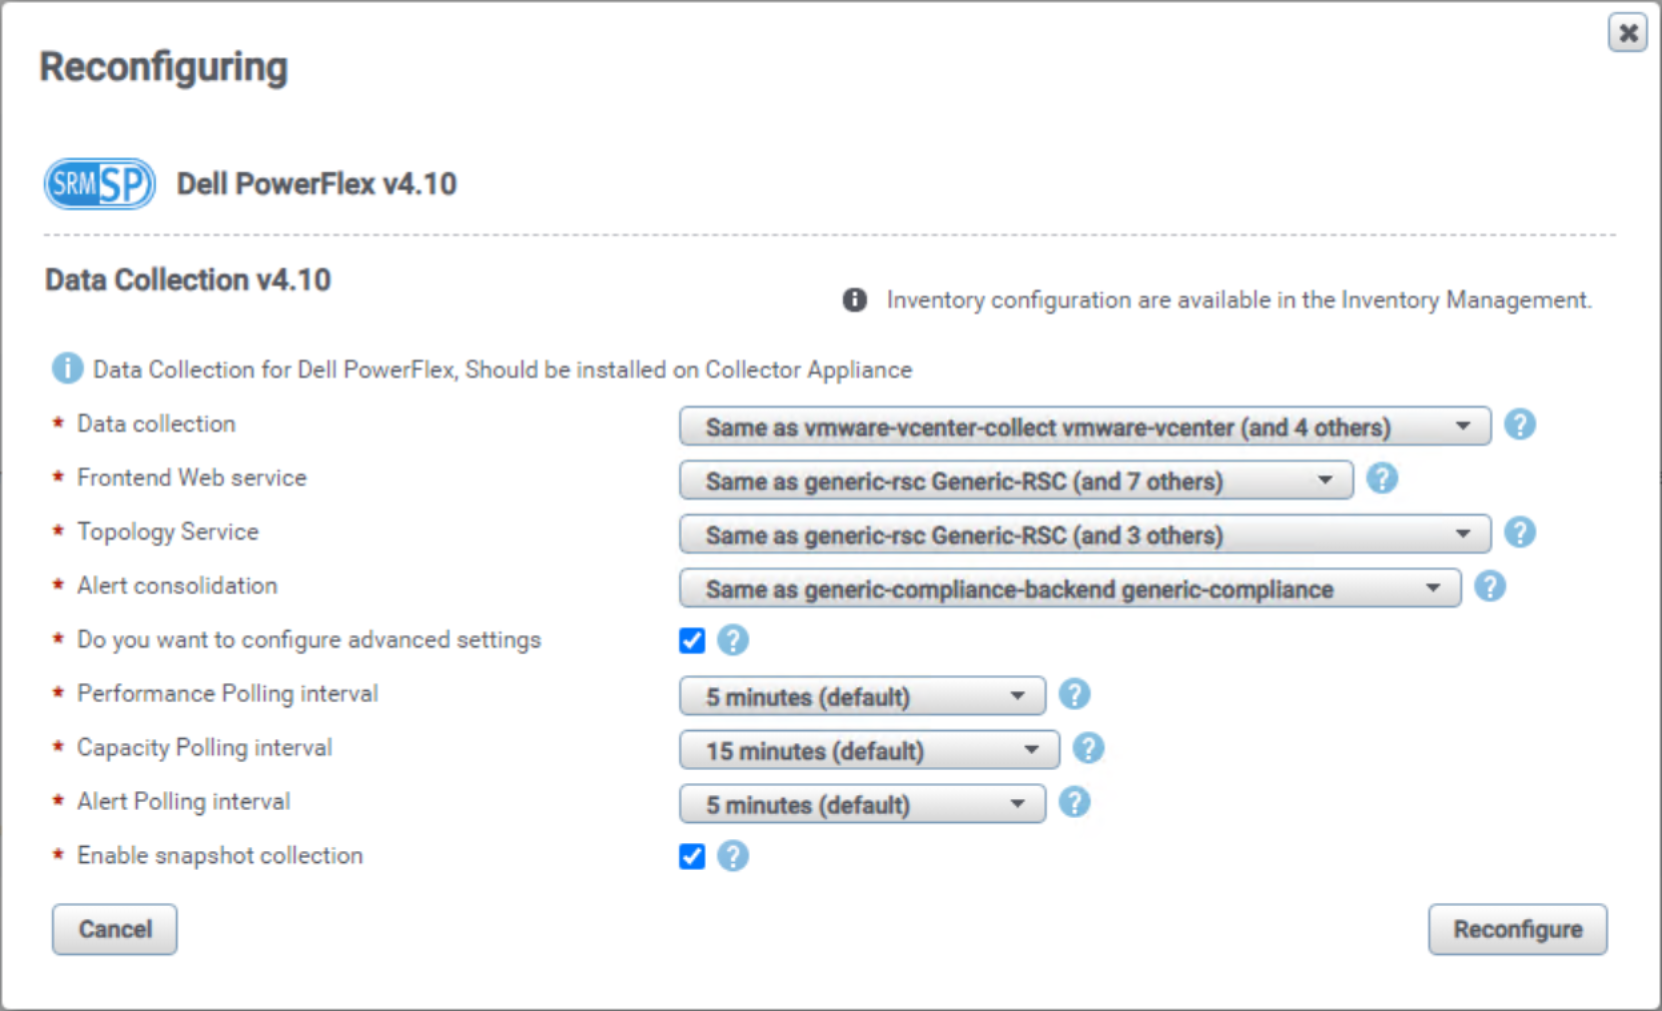
Figure 2. PowerFlex collection intervals
Collectors are installed in the SRM system and require network connectivity to each PowerFlex cluster to be monitored. The collector uses REST API calls to the PowerFlex Gateway (PowerFlex v3.6 and earlier) or PowerFlex Manager (PowerFlex v4.x and later). Because SRM does not monitor the PowerFlex nodes, access to the iDRACs is not required.
Note: A PowerFlex account with the monitor role is required to discover and monitor PowerFlex in SRM.
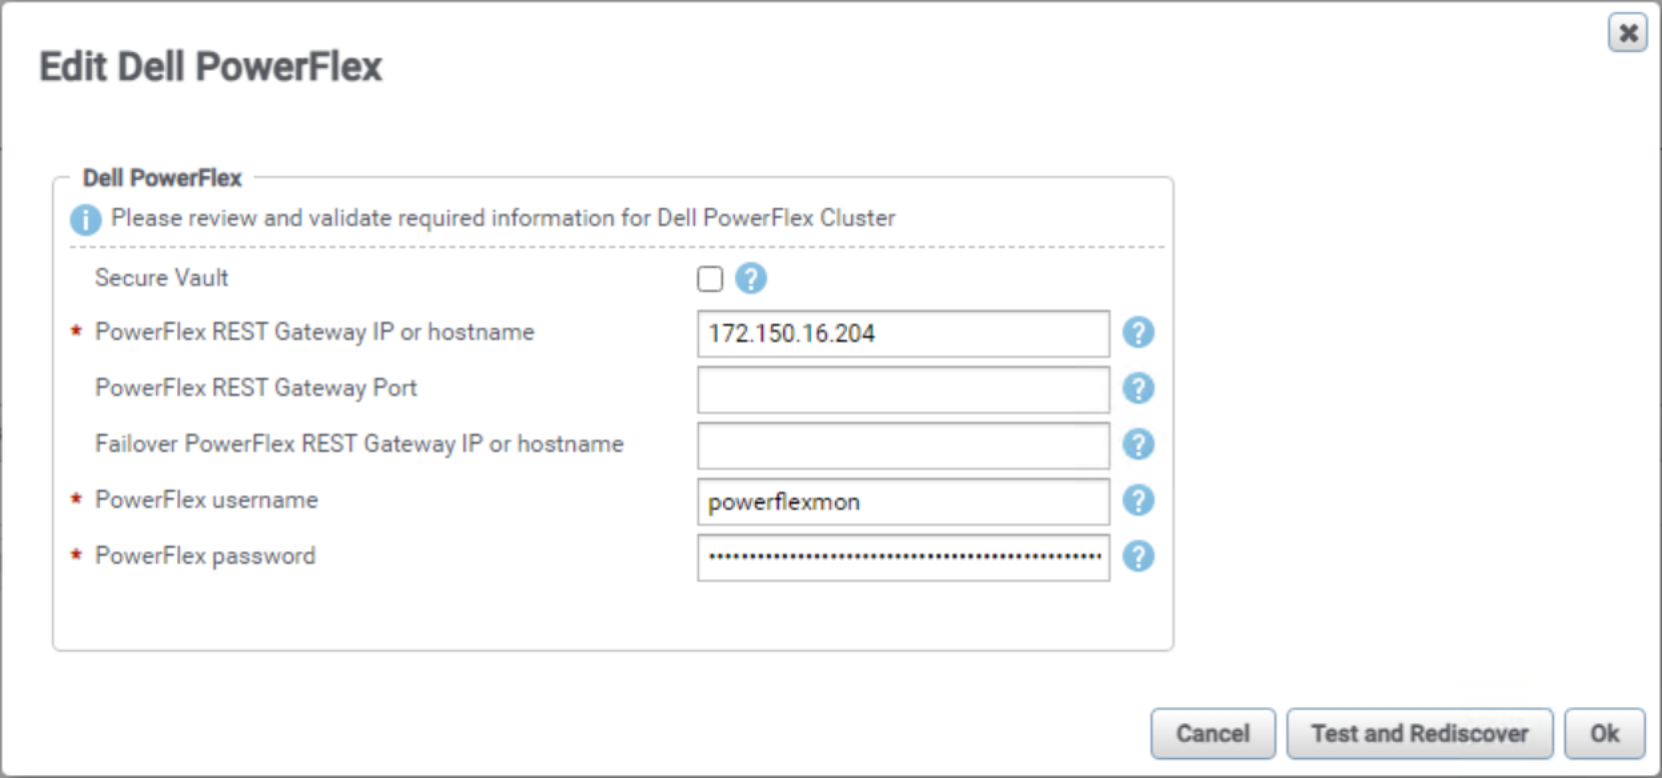
Figure 3. PowerFlex discovery
The number of PowerFlex clusters monitored by a single SRM implementation depends on the number and size of all devices monitored by SRM. The default SRM installation consists of a single collector virtual machine that supports up to 14 storage systems. A scaled-out SRM deployment can monitor up to 72 storage systems.
Note: Contact your Dell account team for assistance in proper sizing of SRM.
Reports
SRM includes a comprehensive set of global reports that you can use with all devices, including PowerFlex clusters that have been discovered. The global reports are based on key use cases, such as capacity planning, configuration compliance, performance troubleshooting, workload analysis, and chargeback. The PowerFlex SolutionPack reports are installed in the report library and organized into the following (Figure 4):
- Summary - A collection of card and table reports showing performance and capacity metrics for PowerFlex clusters.
- Inventory – A list of all PowerFlex components, physical or logical, such as storage pools, SDSs, volumes, and snapshots.
- Capacity – Contains PowerFlex cluster level capacity reports.
- Performance – PowerFlex performance reports.
- Operations - Spot health issues and identify areas for improving efficiencies.
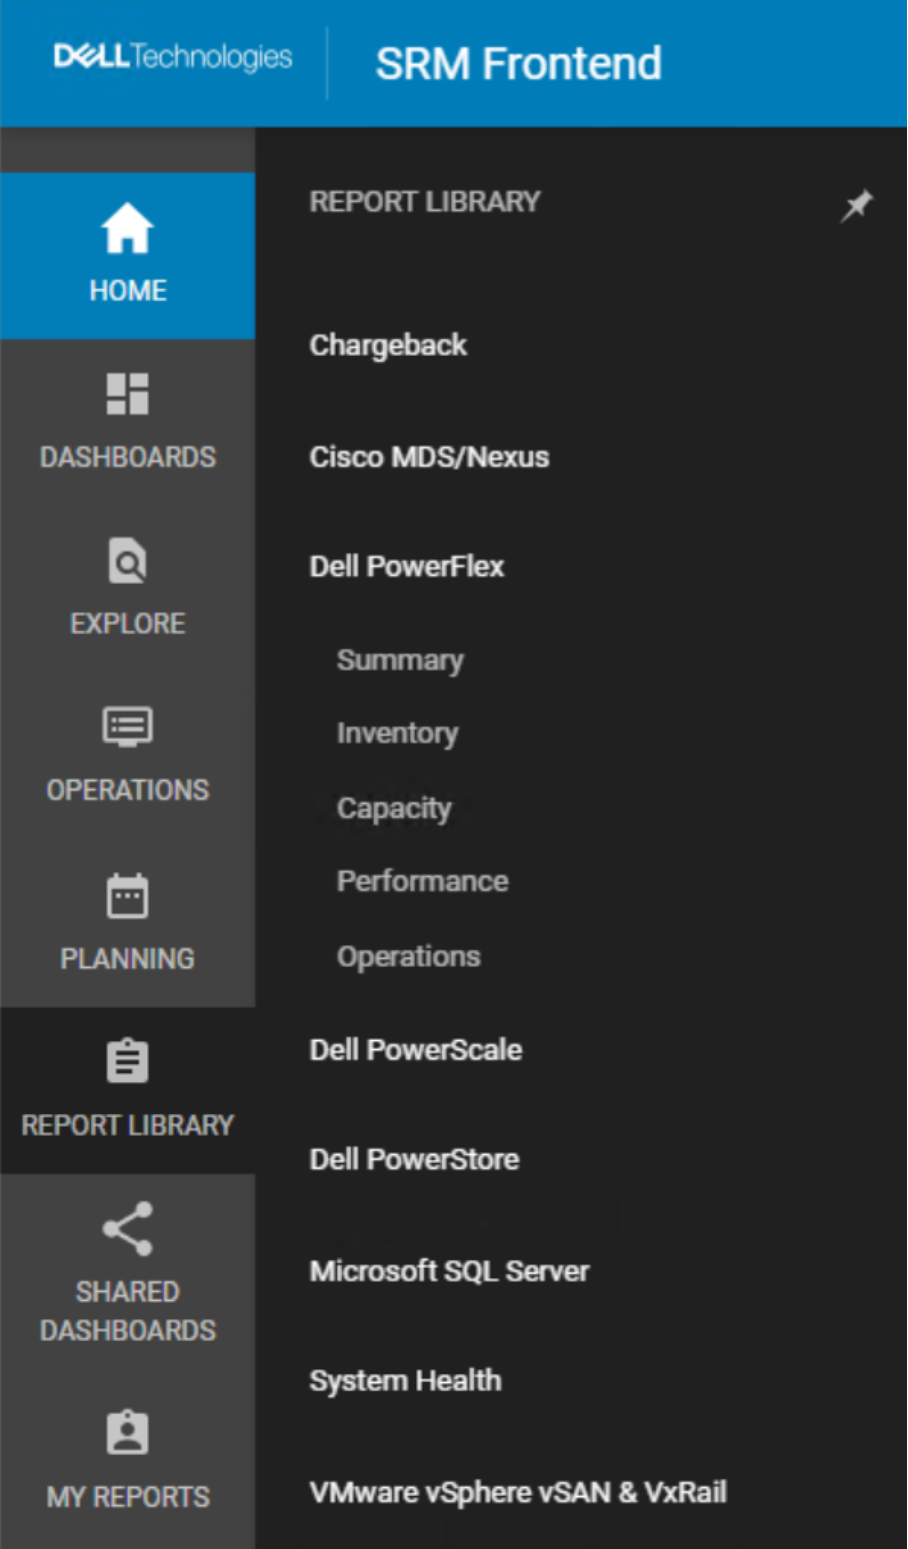
Figure 4. Report library
Alerts
The SRM alerting subsystem consolidates alerts from many different devices and normalizes them so that they can be displayed in the SRM UI. PowerFlex events can be sent to an alert consolidation event listener installed in SRM where they are normalized (Figure 5). The event data is evaluated against a set of rules by the alerting backend, and if true, an alert is triggered.
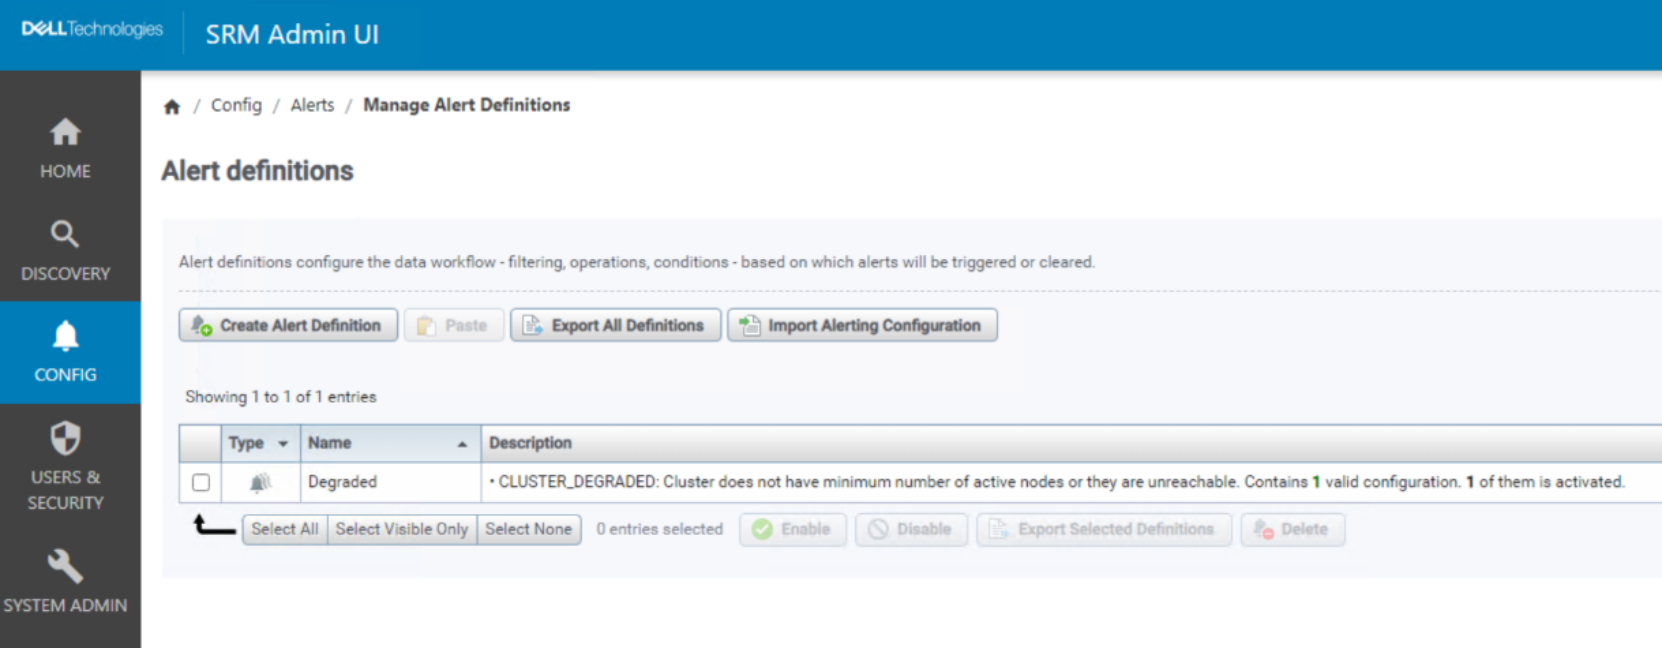
Figure 5. Event-based alert
Alerts can also be triggered using metric-based thresholds (Figure 6). Threshold alerts do not originate from the PowerFlex cluster. Instead, they are based on metrics collected by SRM. An alert is created when the metric exceeds the user-defined threshold.
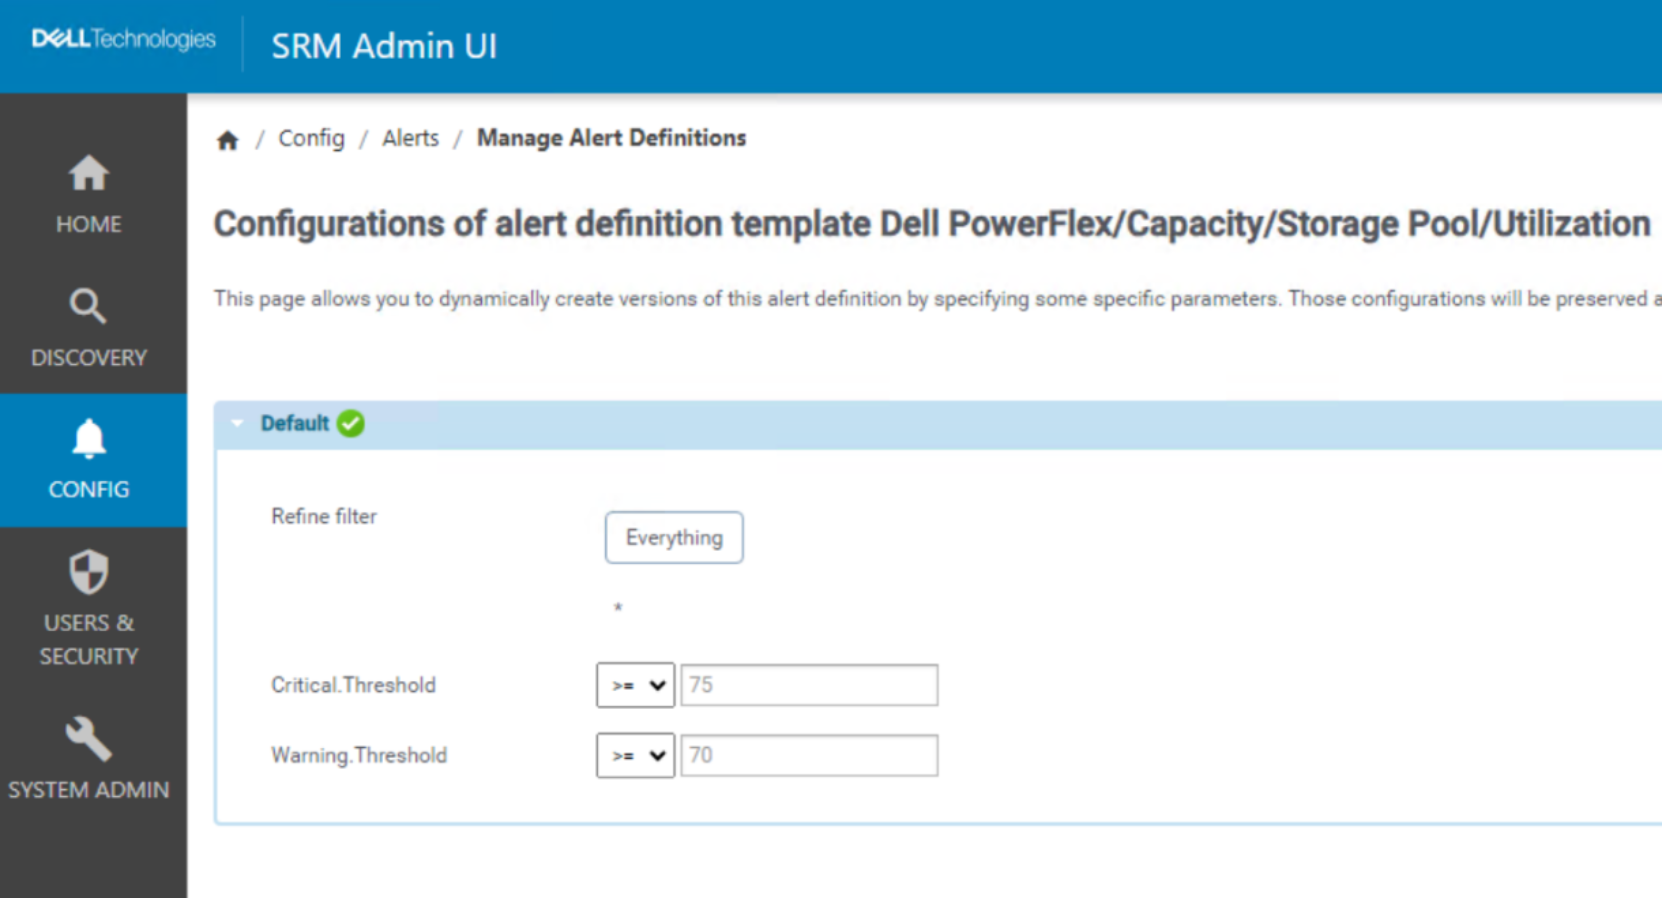
Figure 6. Metric-based threshold alert
SRM can receive SNMP trap events from supported devices. After it is normalized, SRM evaluates the SNMP trap event to determine whether it matches an alert condition. The last method of creating an alert is with a scheduled report. When the report is scheduled, the administrator creates an alert definition to alert on the wanted value in the report (Figure 7).
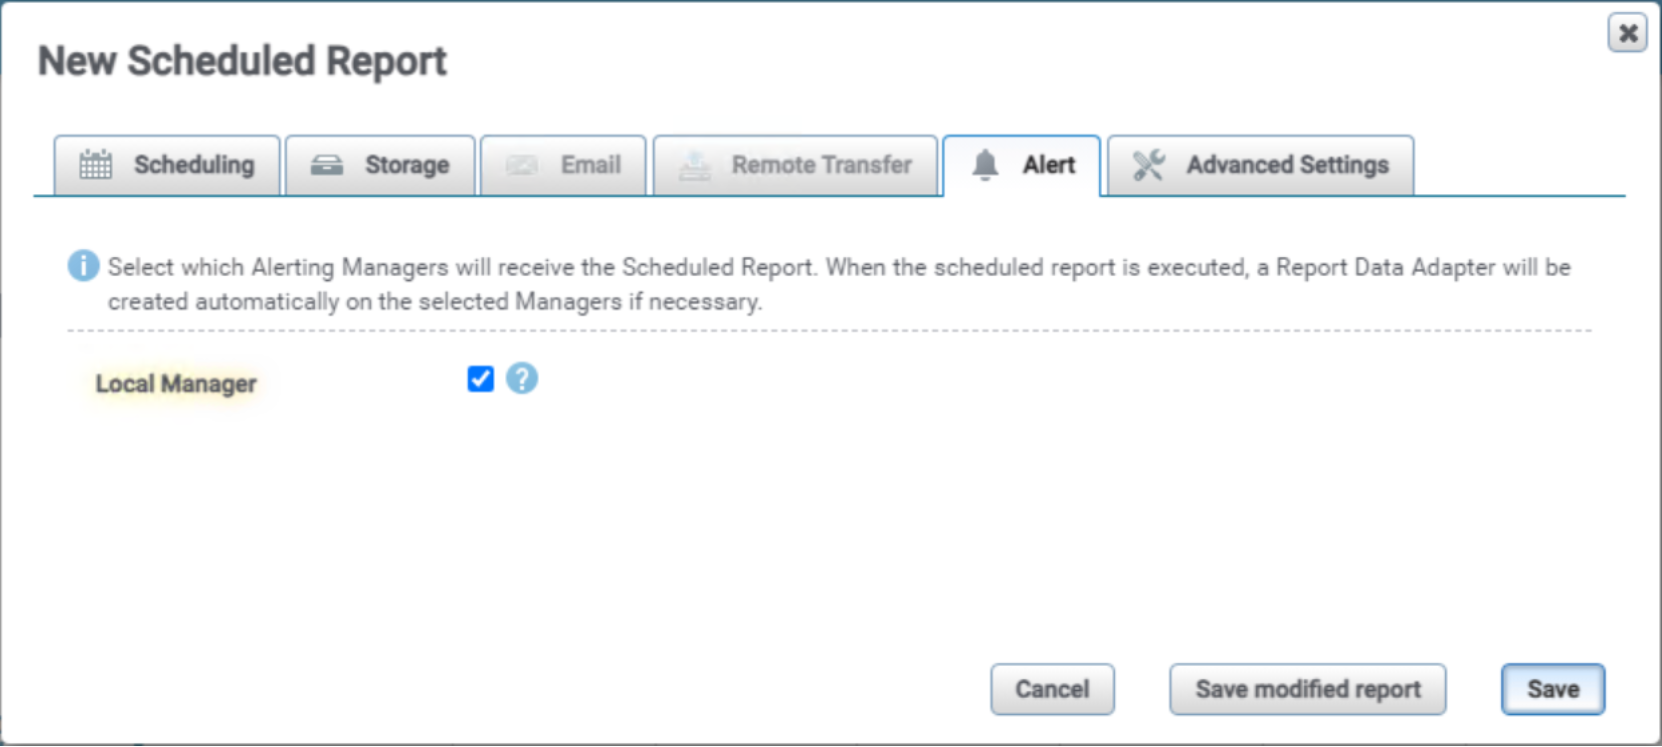
Figure 7. Alert - report schedule