
None
None
-
Performance reports are available for PowerFlex clusters and the components of a cluster. The clusters, SDSs, Protection Domains, and Storage Pool tabs are also useful for analyzing a data rebuild or rebalance process, in addition to I/O KPIs.
Some performance reports include baseline values that help administrators visualize a single metric over the last 24 hours in relation to the historical behavior of the same metric. SRM requires a minimum of two weeks of data collection before calculating the upper and lower baselines (Figure 19).
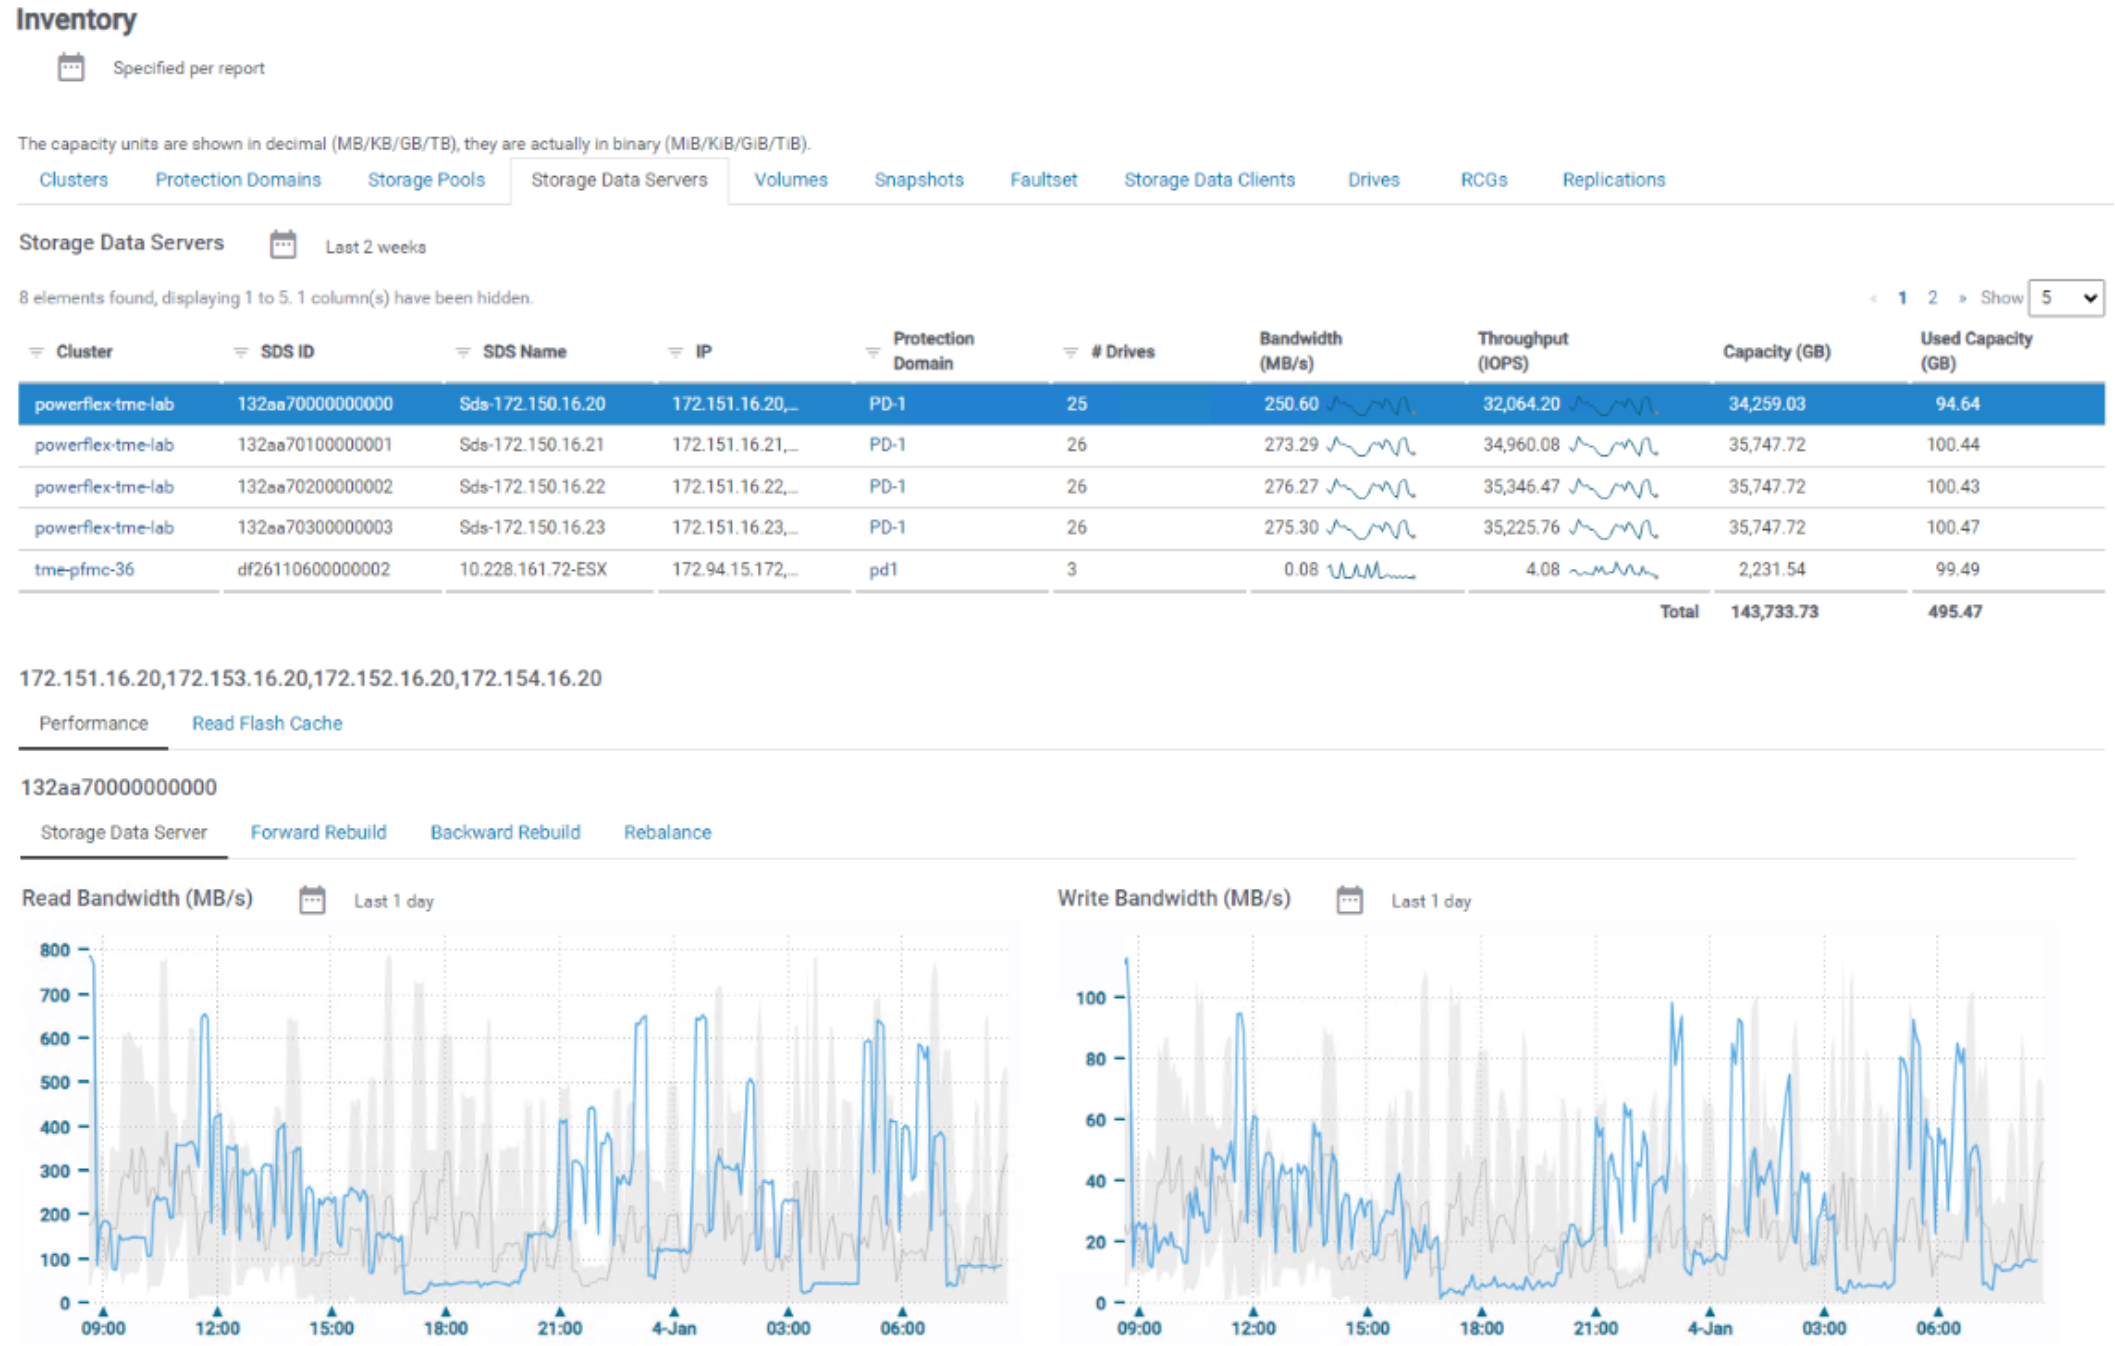
Figure 19. SDS performance report with baselines
The blue line in a baseline report is the last 24 hours of the selected metric. The gray line shows the average of the metric over the last four weeks for the same day and hours represented by the blue line. The shaded gray area shows the range of all values that are collected over the last four weeks for the same day and hours represented by the blue line (Figure 20).
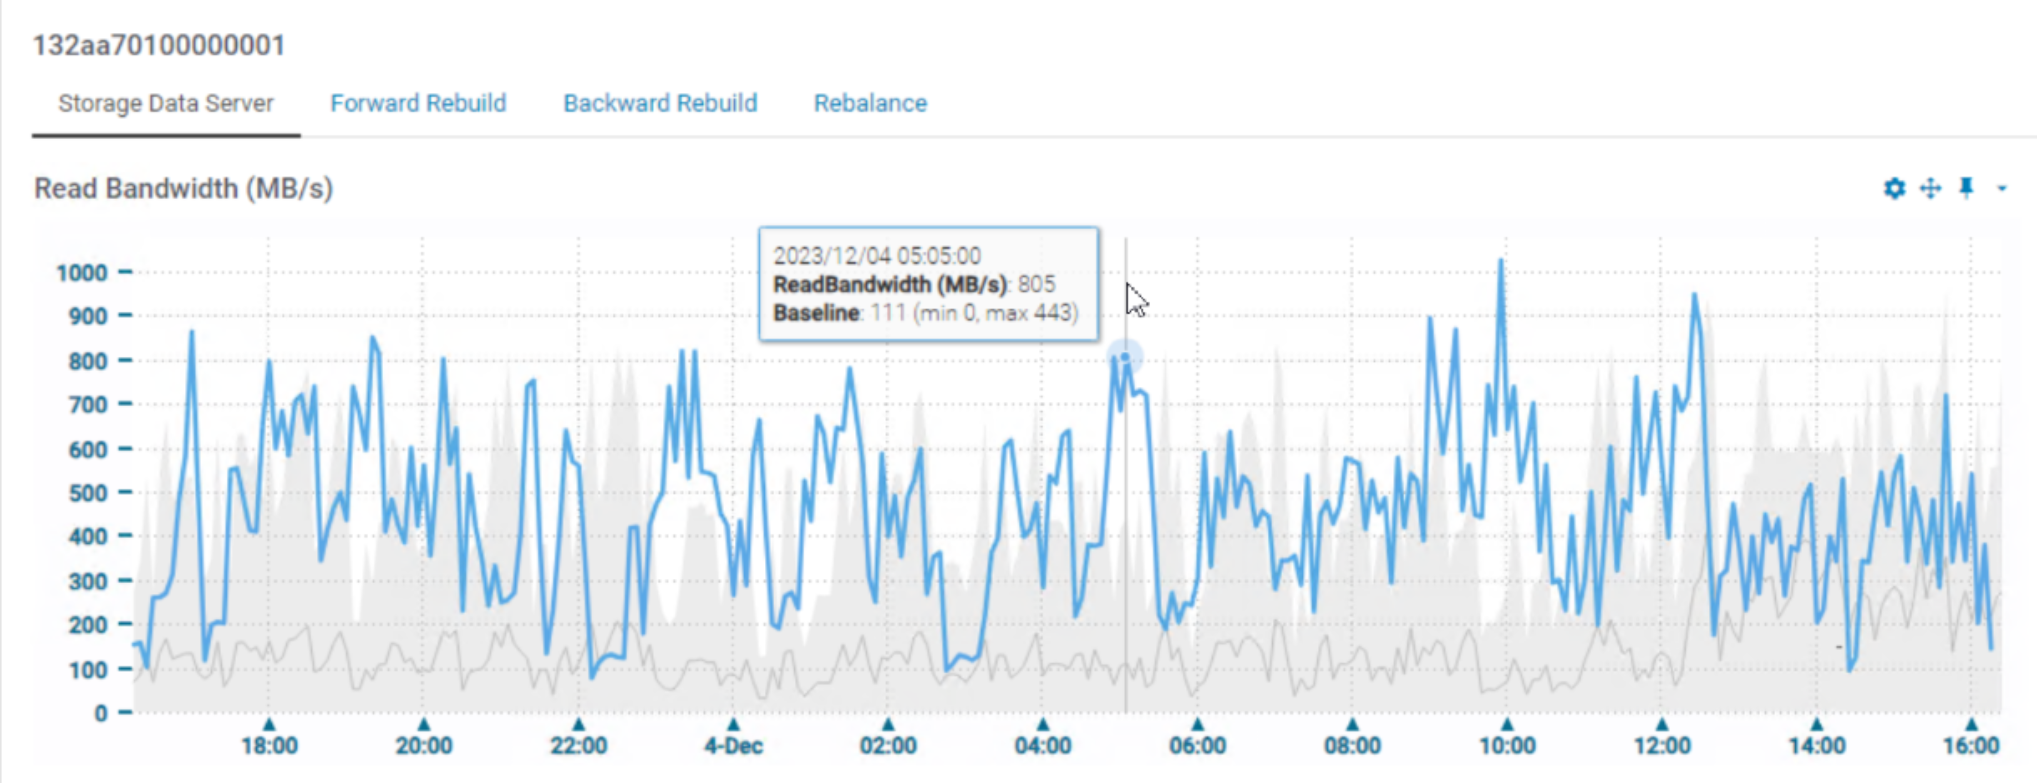
Figure 20. Baseline detail