
Deduplication efficiency reporting
Deduplication efficiency reporting
-
The amount of disk space currently saved by SmartDedupe can be determined by viewing the cluster capacity usage chart and deduplication reports summary table in the WebUI. The cluster capacity chart and deduplication reports can be found by going to File System Management > Deduplication > Summary.
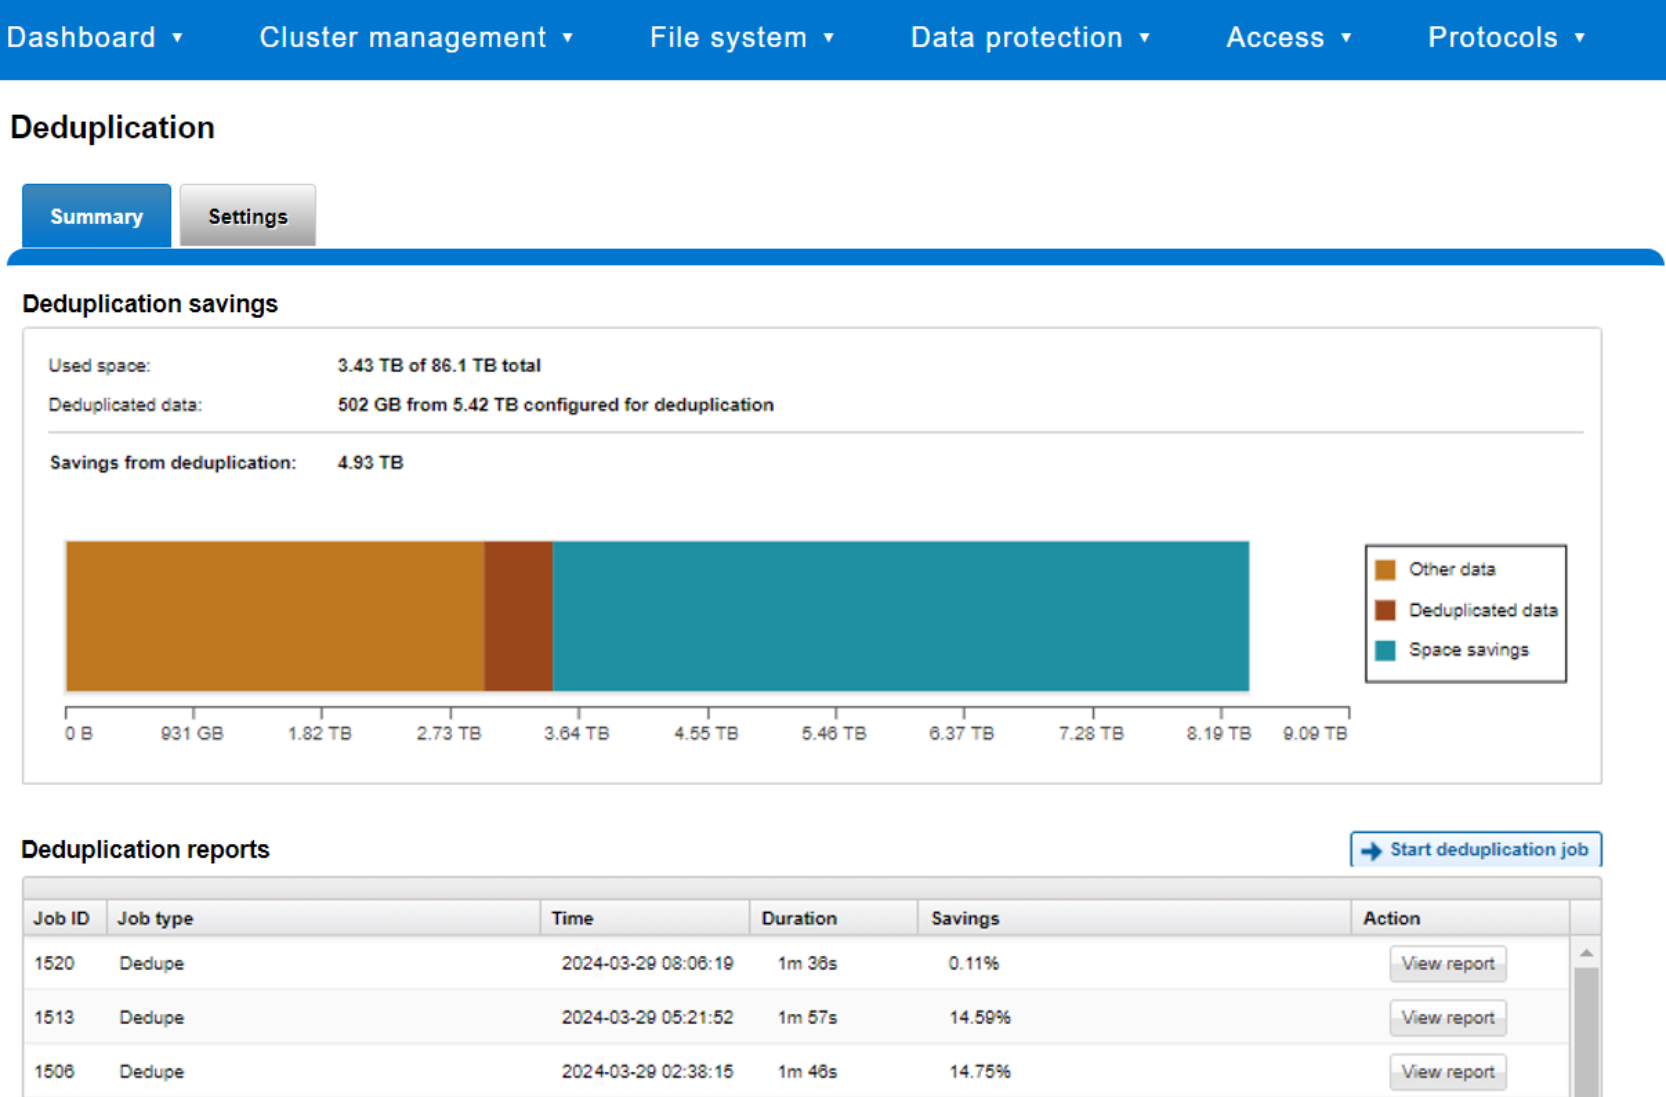
Figure 10. SmartDedupe cluster capacity savings WebUI chart
In addition, the deduplication job report overview field also displays the SmartDedupe savings as a percentage.
SmartDedupe space efficiency metrics are also provided through the isi dedupe stats CLI command:
# isi dedupe stats
Cluster Physical Size: 86.14T
Cluster Used Size: 3.43T
Logical Size Deduplicated: 4.01T
Logical Saving: 3.65T
Estimated Size Deduplicated: 5.42T
Estimated Physical Saving: 4.93T
Figure 11. SmartDedupe efficiency statistics from the CLI
The most comprehensive of the data reduction reporting CLI utilities is the isi statistics data-reduction command. For example:
# isi statistics data-reduction
Recent Writes Cluster Data Reduction
(5 mins)
--------------------- ------------- ----------------------
Logical data 6.18M 6.02T
Zero-removal saved 0 -
Deduplication saved 56.00k 3.65T
Compression saved 4.16M 1.96G
Preprotected physical 1.96M 2.37T
Protection overhead 5.86M 910.76G
Protected physical 7.82M 3.40T
Zero removal ratio 1.00 : 1 -
Deduplication ratio 1.01 : 1 2.54 : 1
Compression ratio 3.12 : 1 1.02 : 1
Data reduction ratio 3.15 : 1 2.54 : 1
Efficiency ratio 0.79 : 1 1.77 : 1
--------------------- ------------- ----------------------
Figure 12. Data reduction and storage efficiency statistics from the CLI
The Recent Writes data to the left of the output provides precise statistics for the 5-minute period before the command was run. By contrast, the Cluster Data Reduction metrics on the right of the output are slightly less real-time but reflect the overall data and efficiencies across the cluster.
Note: In OneFS 9.1 and earlier, the right-hand column metrics are designated by the Est prefix, denoting an estimated value. However, in OneFS 9.2 and later, the Logical data and Preprotected physical metrics are tracked and reported accurately, rather than estimated.
The ratio data in each column is calculated from the values above it. For instance, to calculate the data reduction ratio, the Logical data (effective) is divided by the Preprotected physical (usable) value. From the output in the preceding figure, the calculation is:
6.02 / 2.37 = 1.76 or a data reduction ratio of 2.54:1
Similarly, the Efficiency ratio is calculated by dividing the Logical data (effective) by the Protected physical (raw) value. From the output in the preceding figure, the calculation is:
6.02 / 3.40= 0.97 or an efficiency ratio of 1.77:1
In OneFS 8.2.1 and later, SmartQuotas has been enhanced to report the capacity saving from deduplication, and data reduction in general, as a storage efficiency ratio. SmartQuotas reports efficiency as a ratio across a dataset as specified in the quota path field. The efficiency ratio is for the full quota directory and its contents, including any overhead, and reflects the net efficiency of compression and deduplication. On a cluster with licensed and configured SmartQuotas, this efficiency ratio can be easily viewed from the WebUI by going to File System > SmartQuotas > Quotas and Usage.
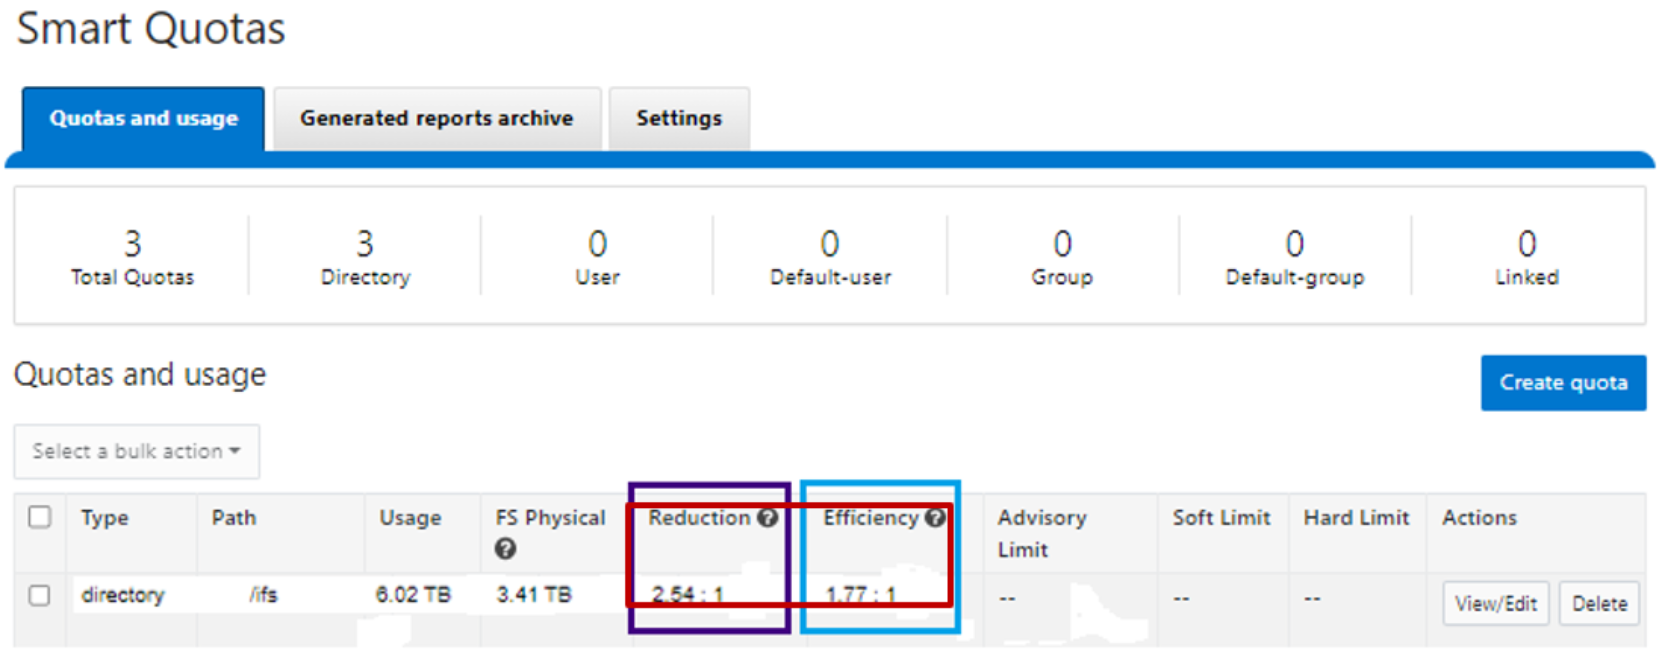
Figure 13. OneFS WebUI SmartQuotas quotas and usage status detailing efficiency and data reduction ratios
Similarly, the same data can be accessed from the OneFS command line through the isi quota quotas list CLI command. For example:
# isi quota quotas list
Type AppliesTo Path Snap Hard Soft Adv Used Reduction Efficiency
------------------------------------------------------------------------------
directory DEFAULT /ifs No - - - 6.02T 2.54 : 1 1.77 : 1
------------------------------------------------------------------------------
Total: 1
More detail, including both the physical (raw) and logical (effective) data capacities, is also available through the isi quota quotas view <path> <type> CLI command. For example:
# isi quota quotas view /ifs directory
Path: /ifs
Type: directory
Snapshots: No
Enforced: No
Container: No
Linked: No
Usage
Physical(With Overhead): 6.93T
FSPhysical(Deduplicated): 3.41T
FSLogical(W/O Overhead): 6.02T
AppLogical(ApparentSize): 6.01T
ShadowLogical: -
PhysicalData: 2.01T
Protection: 781.34G
Reduction(Logical/Data): 2.54 : 1
Efficiency(Logical/Physical): 1.77 : 1
To configure SmartQuotas for data efficiency reporting, create a directory quota at the top-level file system directory of interest, for example /ifs. Creating and configuring a directory quota is a simple procedure and can be performed from the WebUI, as follows:
Go to File System > SmartQuotas > Quotas and Usage, and select Create a Quota. Set Quota type to Directory quota, and add the preferred top-level path to report on. For Quota accounting, select File system logical size, and set Quota limits to Track storage without specifying a storage limit. Finally, click Create quota to confirm the configuration and activate the new directory quota.
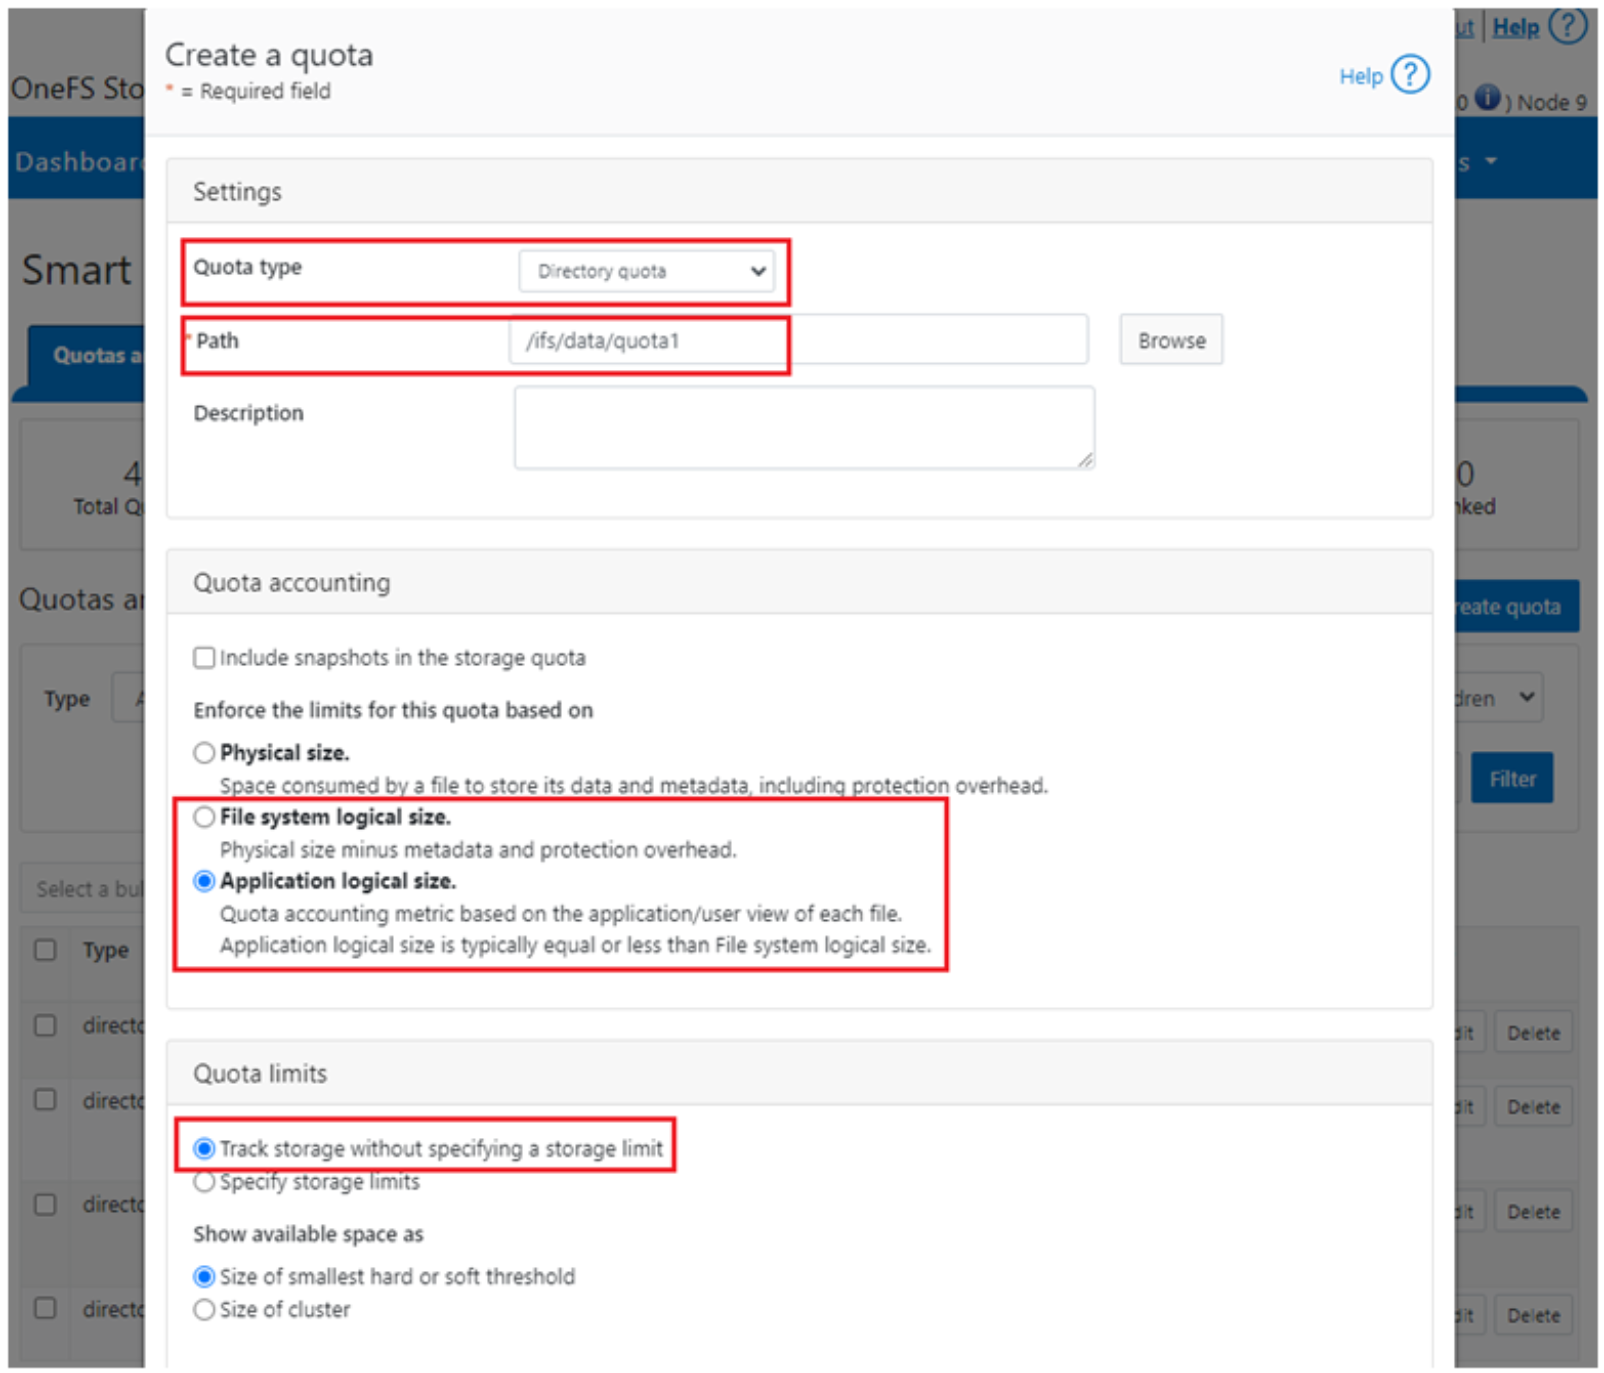
Figure 14. OneFS WebUI SmartQuotas directory quota configuration
The efficiency ratio is a single, current-in time efficiency metric that is calculated per quota directory and includes the sum of SmartDedupe plus inline data reduction. This is in contrast to a history of stats over time, as reported in the isi statistics data-reduction CLI command output, previously described. As such, the efficiency ratio for the entire quota directory reflects what is actually there.
The OneFS WebUI cluster dashboard also displays a storage efficiency tile, which shows physical and logical space utilization histograms and reports the capacity saving from inline data reduction as a storage efficiency ratio. This dashboard view is displayed by default when opening the OneFS WebUI in a browser and can be easily accessed by going to File System > Dashboard > Cluster Overview.
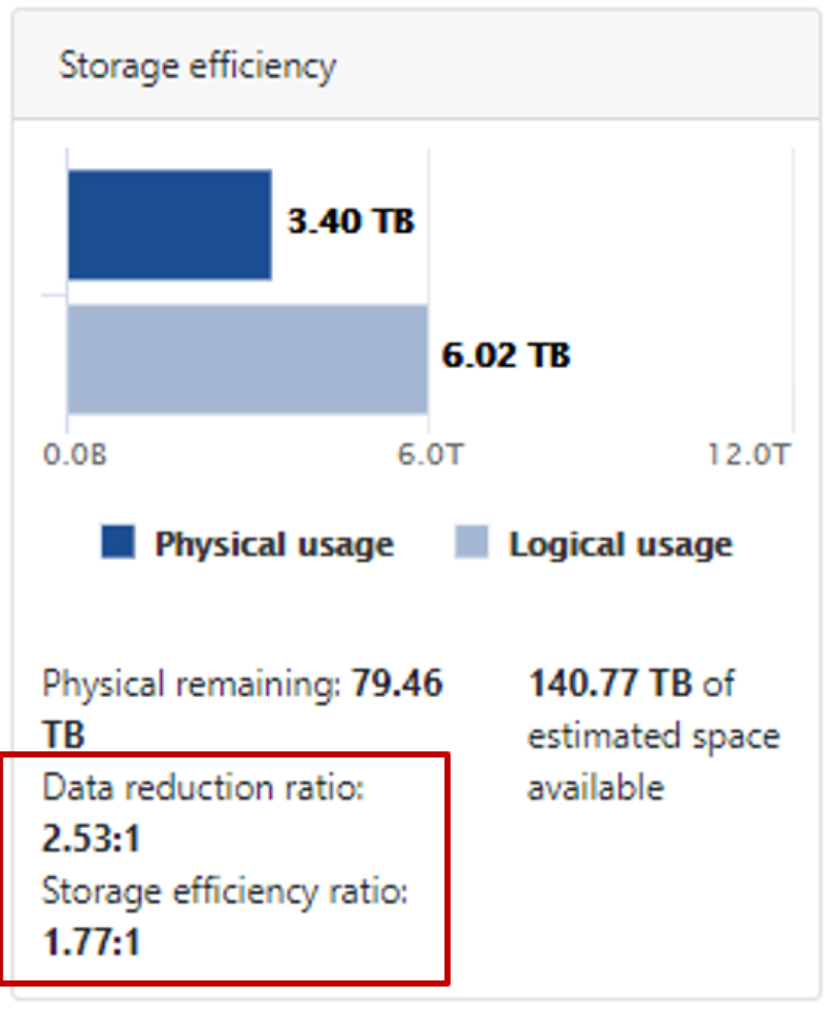
Figure 15. OneFS WebUI cluster status dashboard – storage efficiency summary tile
Similarly, the isi status CLI command output includes a Data Reduction field:
# isi status
Cluster Name: f8101
Cluster Health: [ OK ]
Data Reduction: 2.54 : 1
Storage Efficiency: 1.77 : 1
Cluster Storage: HDD SSD Storage
Size: 0 (0 Raw) 82.9T (86.1T Raw)
VHS Size: 3.2T
Used: 0 (n/a) 3.4T (4%)
Avail: 0 (n/a) 79.5T (96%)
Health Throughput (bps) HDD Storage SSD Storage
ID |IP Address |DASR | In Out Total| Used / Size |Used / Size
---+---------------+-----+-----+-----+-----+-----------------+-----------------
1|10.245.110.69 | OK | 0| 0| 0|(No Storage HDDs)| 878G/20.7T( 4%)
2|10.245.110.70 | OK | 0|73.9k|73.9k|(No Storage HDDs)| 879G/20.7T( 4%)
3|10.245.110.71 | OK | 0| 149k| 149k|(No Storage HDDs)| 879G/20.7T( 4%)
4|10.245.110.72 | OK | 0| 494k| 494k|(No Storage HDDs)| 879G/20.7T( 4%)
---+---------------+-----+-----+-----+-----+-----------------+-----------------
Cluster Totals: | 0| 717k| 717k| 0/ 0( n/a)| 3.4T/82.9T( 4%)
Health Fields: D = Down, A = Attention, S = Smartfailed, R = Read-Only