
Introduction
Introduction
-
OpenShift Container Platform 4.12 includes a monitoring cluster operator that is based on the Prometheus open-source project. Multiple pods run in the cluster to monitor the state of the cluster and immediately raise any alerts in the OpenShift web console. Grafana dashboards provide cluster metrics. For more information, see OpenShift monitoring.
Viewing the cluster dashboard
To view the cluster dashboard information:
- Log in to the OpenShift web console and select Observe > Dashboards.
- Select etcd from the dropdown menu.
The dashboard displays the active streams, the number of etcd nodes that are available, and more, as shown in the following figure:
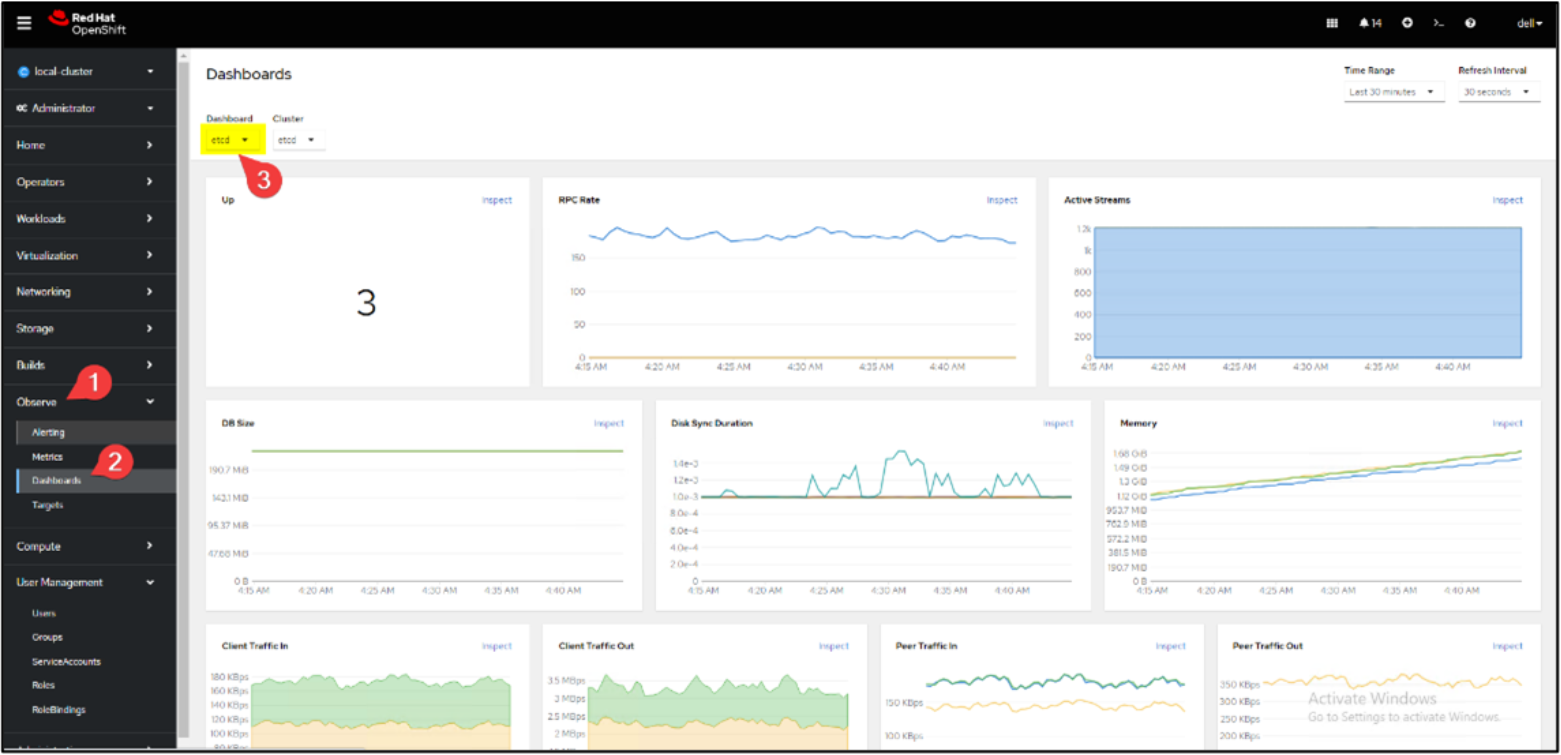
Figure 32. Grafana dashboard example
Viewing OpenShift cluster alerts
To view the cluster alerts:
- Log in to the OpenShift web console and select Observe > Alerting.
- Use the filters to view specific alerts as required.
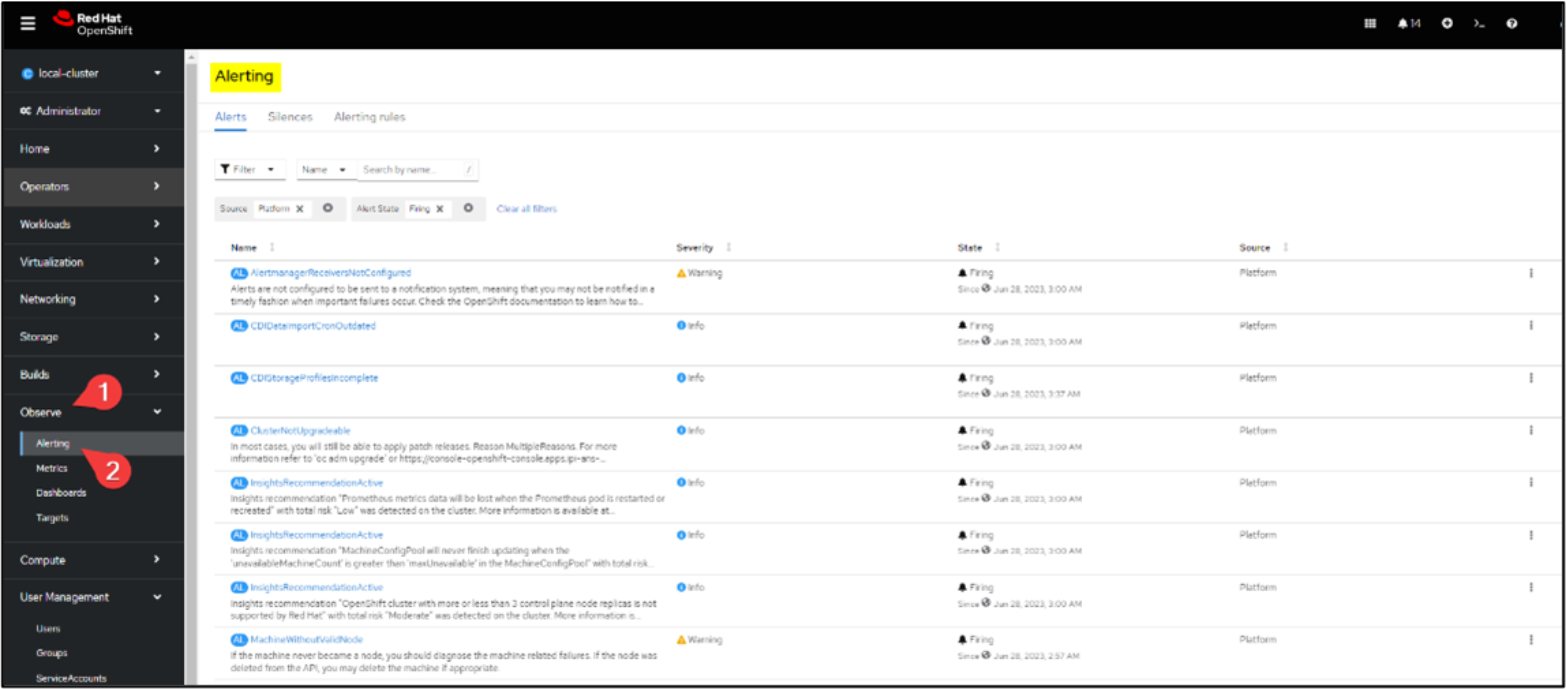
Figure 33. Viewing OpenShift cluster alerts
Viewing OpenShift cluster metrics
To view the cluster metrics:
- Log in to the OpenShift web console and select Observe > Metrics.
- From the Metrics menu, select one of the available queries and click Run queries.
A graph corresponding to the query is displayed, as shown in the following figure:
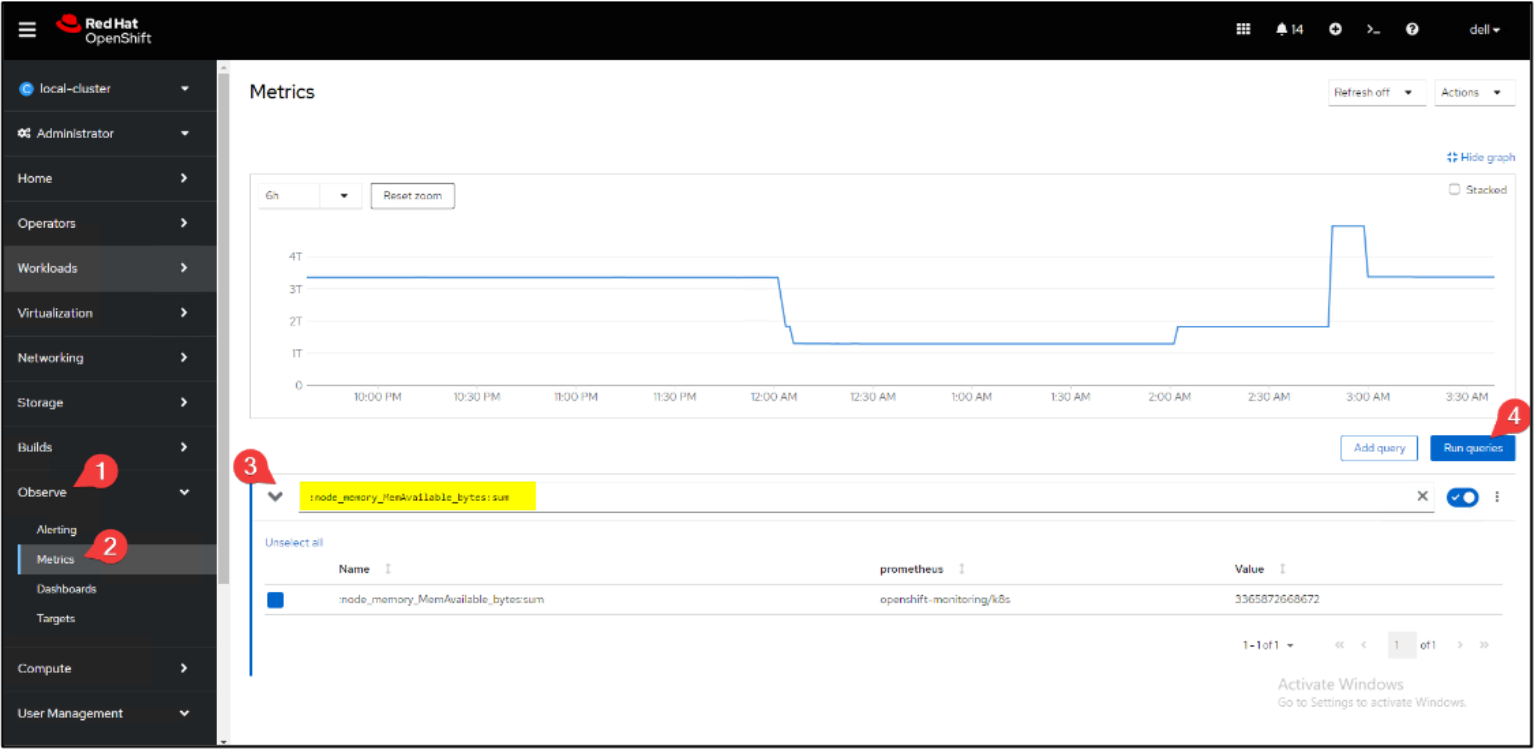
Figure 34. Prometheus dashboard example