
Implementation Guide—Red Hat OpenShift Container Platform 4.10 on AMD-powered Dell Infrastructure
Enabling Grafana dashboards
Enabling Grafana dashboards
-
The Grafana analytics platform provides dashboards for analyzing and visualizing metrics. To view cluster metrics in the OpenShift web console, enable the Grafana dashboards by following these steps.
- Obtain the Grafana route:
[core@csah-pri ~]$ oc get routes -n openshift-monitoring | grep -i grafana
grafana grafana-openshift-monitoring.apps.ocp.dcws.lab grafana https reencrypt/Redirect None
- Open a web browser and paste in the URL (grafana-openshift-monitoring.apps.ocp.dcws.lab from the preceding output example).
- Log in as kubeadmin or as a user with cluster admin privileges.
A list of available components in the cluster is displayed.
 On the left side navigation bar, click and select Browse. In the Search bar, provide etcd and press Enter.
The dashboard shows the active streams, the number of etcd nodes that are up, and other details, as shown in the following figure:
Figure 59.
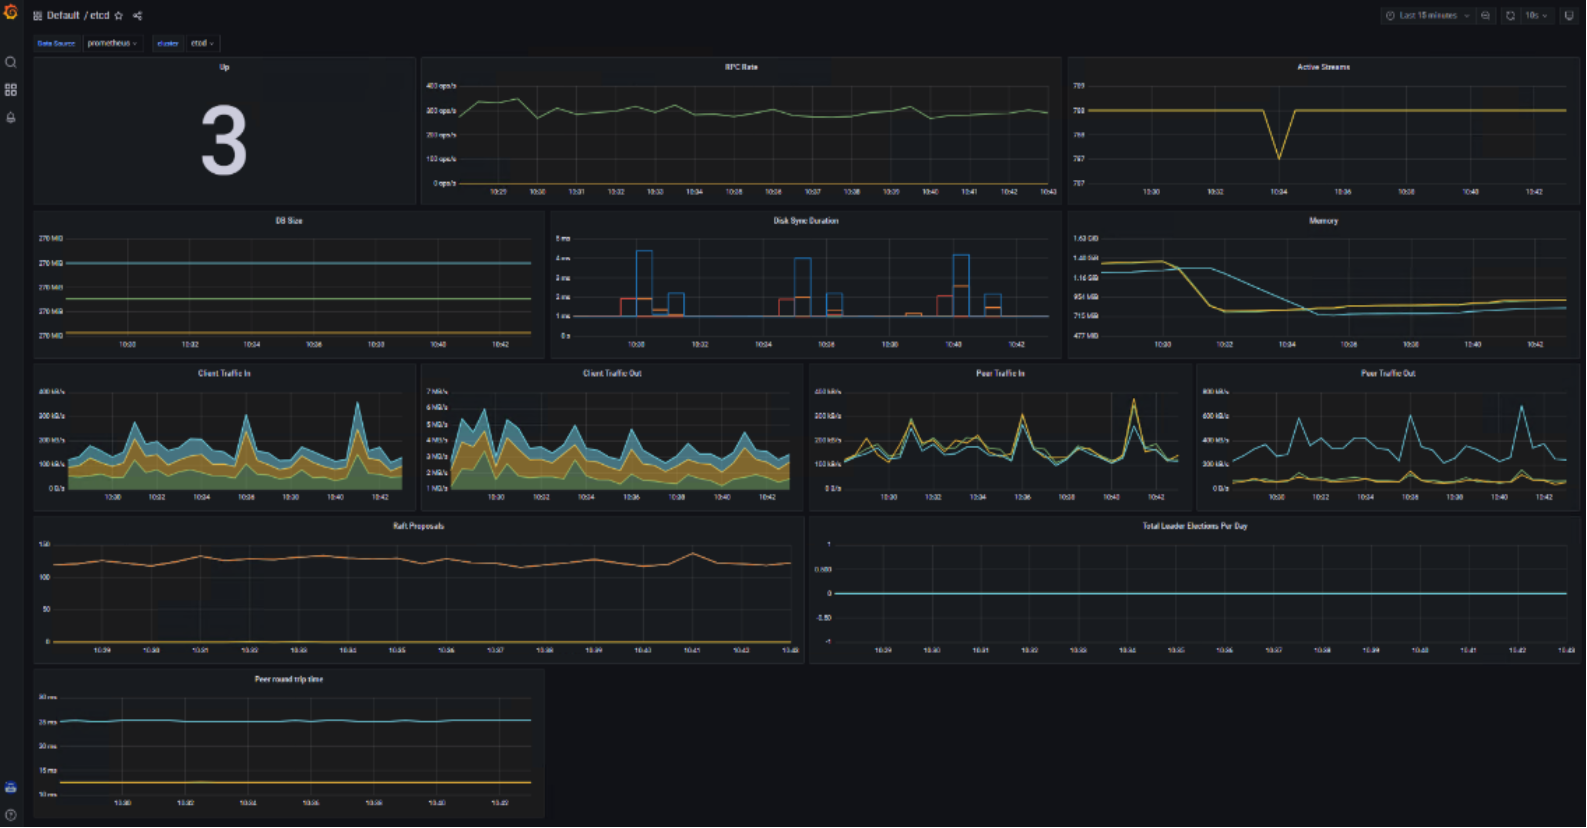
Grafana dashboard example