OpenShift dashboards
OpenShift dashboards
-
OpenShift offers telemetry-rich dashboards that are powered by Prometheus and Grafana. We used those dashboards to collect and display the GPU metrics shown in this paper. Both Prometheus and Grafana are installed by default with OpenShift 4.3. To display the NVIDIA GPU metrics with your own custom dashboards, first install the community Grafana operator as described in the Red Hat Knowledgebase at Configuring custom Grafana with Prometheus from OpenShift Monitoring stack.
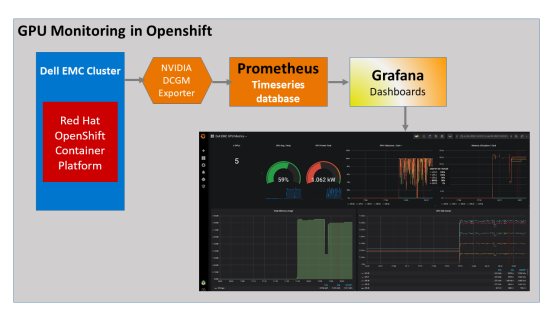
As a cluster administrator, we installed the NVIDIA GPU Operator on our OpenShift cluster. The NVIDIA GPU Operator installs the drivers and libraries that are necessary to use GPUs in OpenShift. The NVIDIA GPU Operator also installs the NVIDIA DCGM exporter on each of the GPU-enabled worker nodes to enable export of GPU metrics in Prometheus format. Prometheus scrapes the metrics and stores them in its time series database. Prometheus is configured as a data source for Grafana, which displays the metrics in time series format.
Figure 4 shows the GPU monitoring and metrics flow from NVIDIA DCGM exporter:
To create the sample custom dashboards shown in Figure 5 through Figure 7, you can use the JSON on GitHub. Additional dashboards are available at http://www.grafana.com.
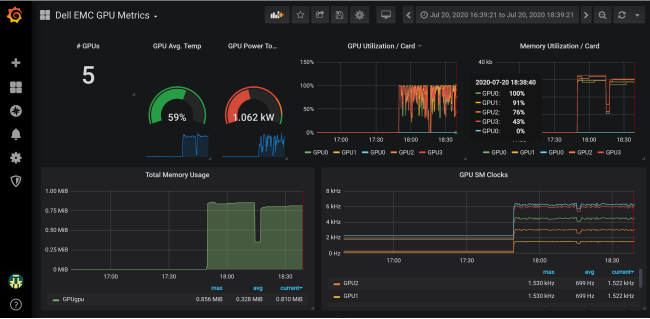
At a glance, this time series view of the GPU metrics allows you to see whether any of the GPUs were underutilized during the model training run. With these interactive graphs, you can click a GPU label in the legend located at the bottom of the graph to see further information and metrics for that GPU.
The dashboard in the following figure shows GPU utilization and GPU memory usage for each GPU. You can tune your application for efficient use of GPU cores and memory by using this dashboard. For instance, when training a neural network, you can tune batch size for better utilization of GPU memory and view the outcome here. Batch size is a hyperparameter that sets the number of training examples processed between model parameter updates.
The dashboard in the following figure displays GPU PCIe transmit and receive throughput.

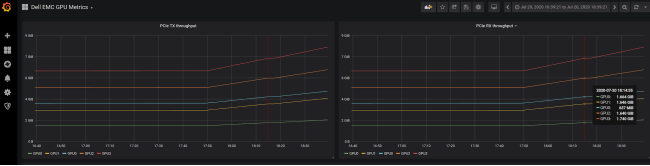
Figure 6. Monitoring GPU PCIe transmit and receive throughput
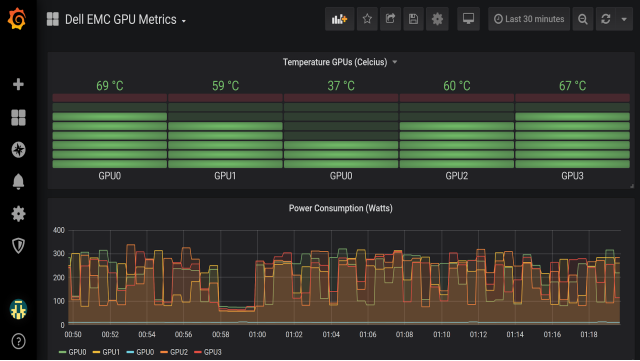
The dashboard in Figure 7 displays GPU temperature and power usage. You can use Prometheus alerting to send an email, text, PagerDuty, or Slack message if the temperature or any other metric of one of your GPUs is above a set threshold. Alerting is particularly useful in large clusters.