
None
None
-
The section describes the benchmark results for each of the use cases.
Use case 1
From the rally_event_data track, the challenge elasticlogs-1bn-load is used for benchmarking. This challenge indexes 1 billion events into several indexes with two primary shards each. This varies based on the circumstances. It can be used to get an understanding of how maximum indexing performance behaves over time. The following command is used to run the track:
Esrally race --pipeline benchmark-only --track-path=~/.rally/benchmarks/tracks/rally-eventdata-track/eventdata --challenge=elasticlogs-1bn-load --target-hosts=192.168.105.116:9200 --track-params="bulk_indexing_clients:48" --client-options="use_ssl:true,verify_certs:false,basic_auth_user:'elastic', basic_auth_password:'XXXXX'
The following figure shows the results for a range (12,24,48) of bulk_indexing_clients validated for rally_event_data track.
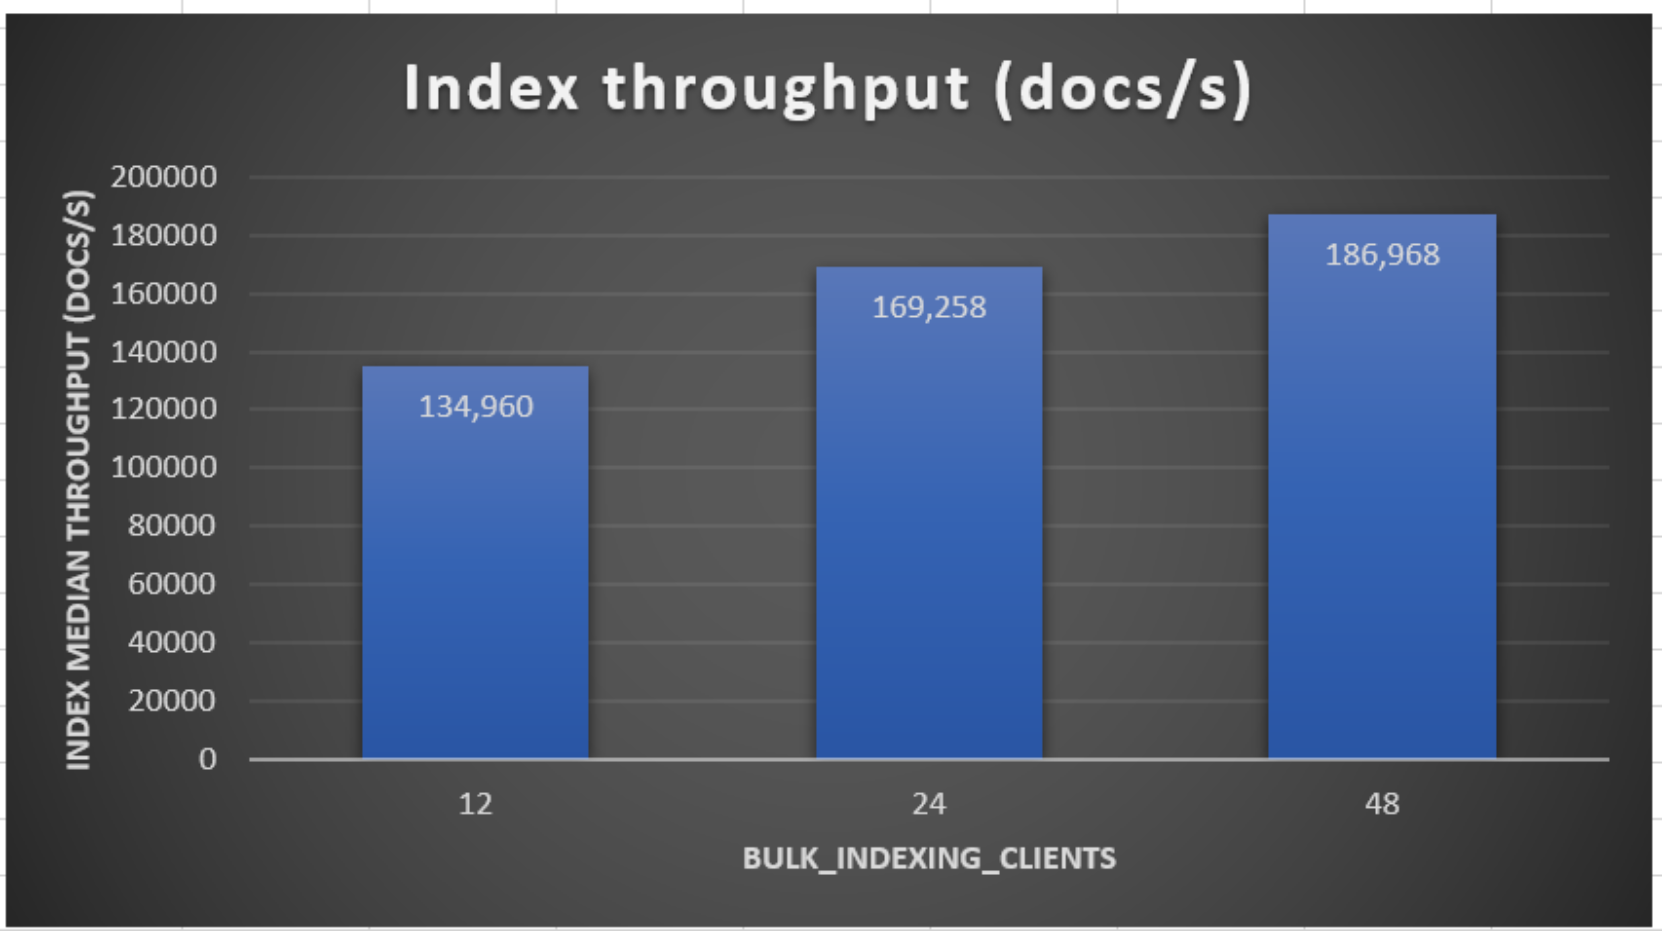
Figure 15. Results for 12,24,48 bulk indexing clients
The following table shows the Rally results for 48 bulk-indexing-clients:
Table 2. Results for challenge elasticlogs-1bn-load
Parameters
Value
Median throughput for index-append-1000-elasticlogs_q_write
186,968 doc/s
Median throughput for node_storage
40.36 op/s
Error rate
0%
Total time to run the benchmark
1 hr. 33 min
Average CPU utilization on each data pod
43%
Memory utilization on each data pod
61%
The use case 1 with 48 bulk_indexing_clients took 1 hour and 33 minutes to complete. Each data pod showed an average CPU usage of 43% and memory usage of 61%. The median throughput of the number of operations that Elasticsearch can perform within a certain time period for index-append-1000-elasticlogs_q_write is 186,968 documents per second.
Use case 2
From the http_logs track, the challenge append-no-conflicts-index-only is used for benchmarking. This track is based on the webserver logs from the 1998 Football World Cup and the challenge Indexes the whole document corpus using Elasticsearch default settings. Document ids are unique, so all index operations are append only. The following command is used to run the track:
esrally race --pipeline benchmark-only --track=http_logs --challenge append-no-conflicts-index-only --target-hosts=192.168.105.116:9200 --track-params="bulk_indexing_clients:96" --client-options="use_ssl:true,verify_certs:false, basic_auth_user:'elastic',basic_auth_password:'xxxxx'
The following figure shows the results for a range (24,48,96) of bulk_indexing_clients validated for http_logs track.

Figure 16. Results for 24,48,96 bulk_indexing_clients
The following table shows the Rally results for 96 bulk-indexing-clients.
Table 3. Results for track http_logs
Parameters
Value
Index Throughput
1,194,830 doc/s
Median cumulative indexing time across primary shards
0.739717 min
Total Young Gen GC
32.104 secs
Total time to run the benchmark
4.71 min
Average CPU Utilization on each Data pod
37%
Memory Utilization on each Data pod
22%
The use case 2 with 96 bulk_indexing_clients took 4.71 minutes to complete. Each data pod showed an average CPU usage of 37% and memory usage of 22%. The median throughput of the number of operations that Elasticsearch can perform within a certain time period for http_logs is 1,194,830 documents per second.
Use case 3
From the elastic/security track, the challenge generate-alerts-source-events is used to benchmark. This track simulates Elastic security workloads, and the challenge generates source events for detection rules. The following command is used to run the track:
esrally race --pipeline benchmark-only --track=elastic/security--challenge generate-alerts-source-events --target-hosts=192.168.105.116:9200 --track-params="bulk_indexing_clients:15" --client-options="use_ssl:true,verify_certs:false, basic_auth_user:'elastic',basic_auth_password:'xxxxx'"
The following figure shows the results for a range (5,10,15) of bulk_indexing_clients validated for elastic/security track.

Figure 17. Results for 5,10,15 bulk_indexing_clients
The following table shows the Rally results for 15 bulk-indexing-clients.
Table 4. Results for elastic/security track
Term
Definition
Throughput
5225.34 doc/s
Median cumulative indexing time across primary shards
0.890867 min
Total Young Gen GC
0 secs
Total time to run the benchmark
50 secs
Average CPU Utilization on each Data pod
0.37%
Memory Utilization on each Data pod
22%
The use case 3 with 15 bulk_indexing_clients took 50 s to complete. Each data pod showed an average CPU usage of 0.37% and memory usage of 22%. The median throughput of the number of operations that Elasticsearch can perform within a certain time period for elastic/security is 5225 documents per second.