
Create Kibana dashboard
Create Kibana dashboard
-
Data from the ECS access logs is now being ingested into the indices of Elasticsearch with the appropriate pattern to accurately parse and populate the fields in the index. To start visualizing data, select Dashboard from under the Analytics section.
Click Create Dashboard.
Three dashboards were created: one for Global ECS views, one for VDC1 specific views, and one for VDC2 specific views.
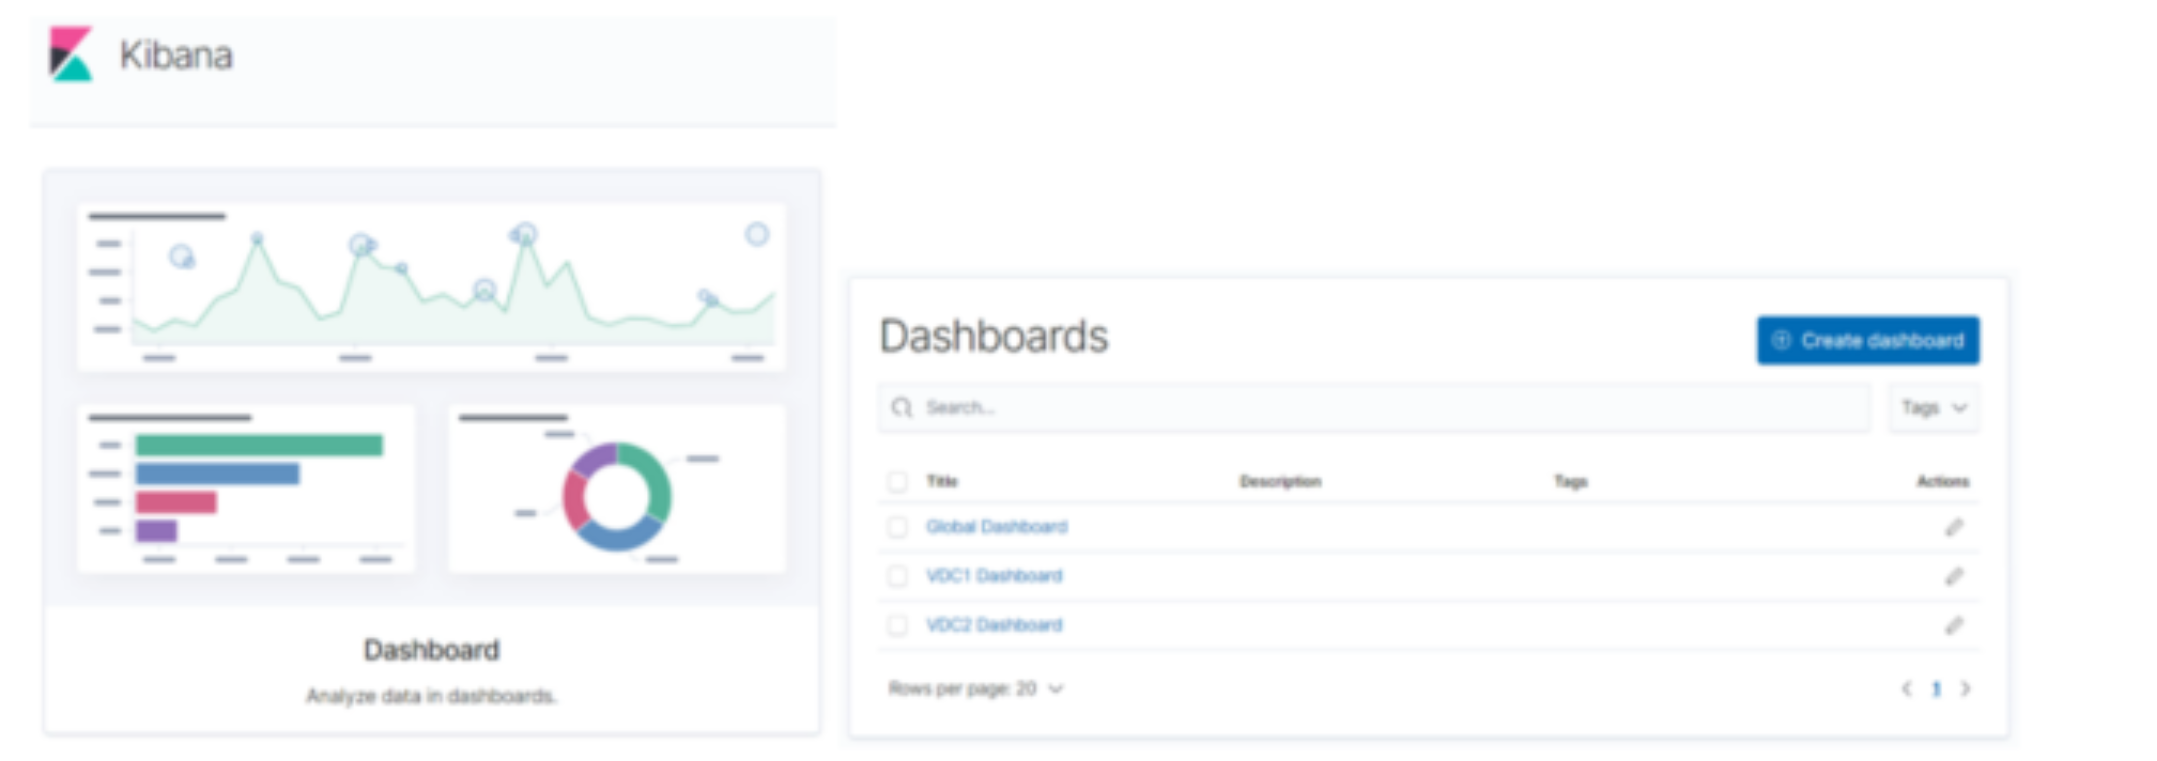
Figure 15. ECS dashboards
Looking at the Global Dashboard, we can see some examples of views aggregating values from both VDCs, such as Transaction Counts, Errors and Access Method Distributions.
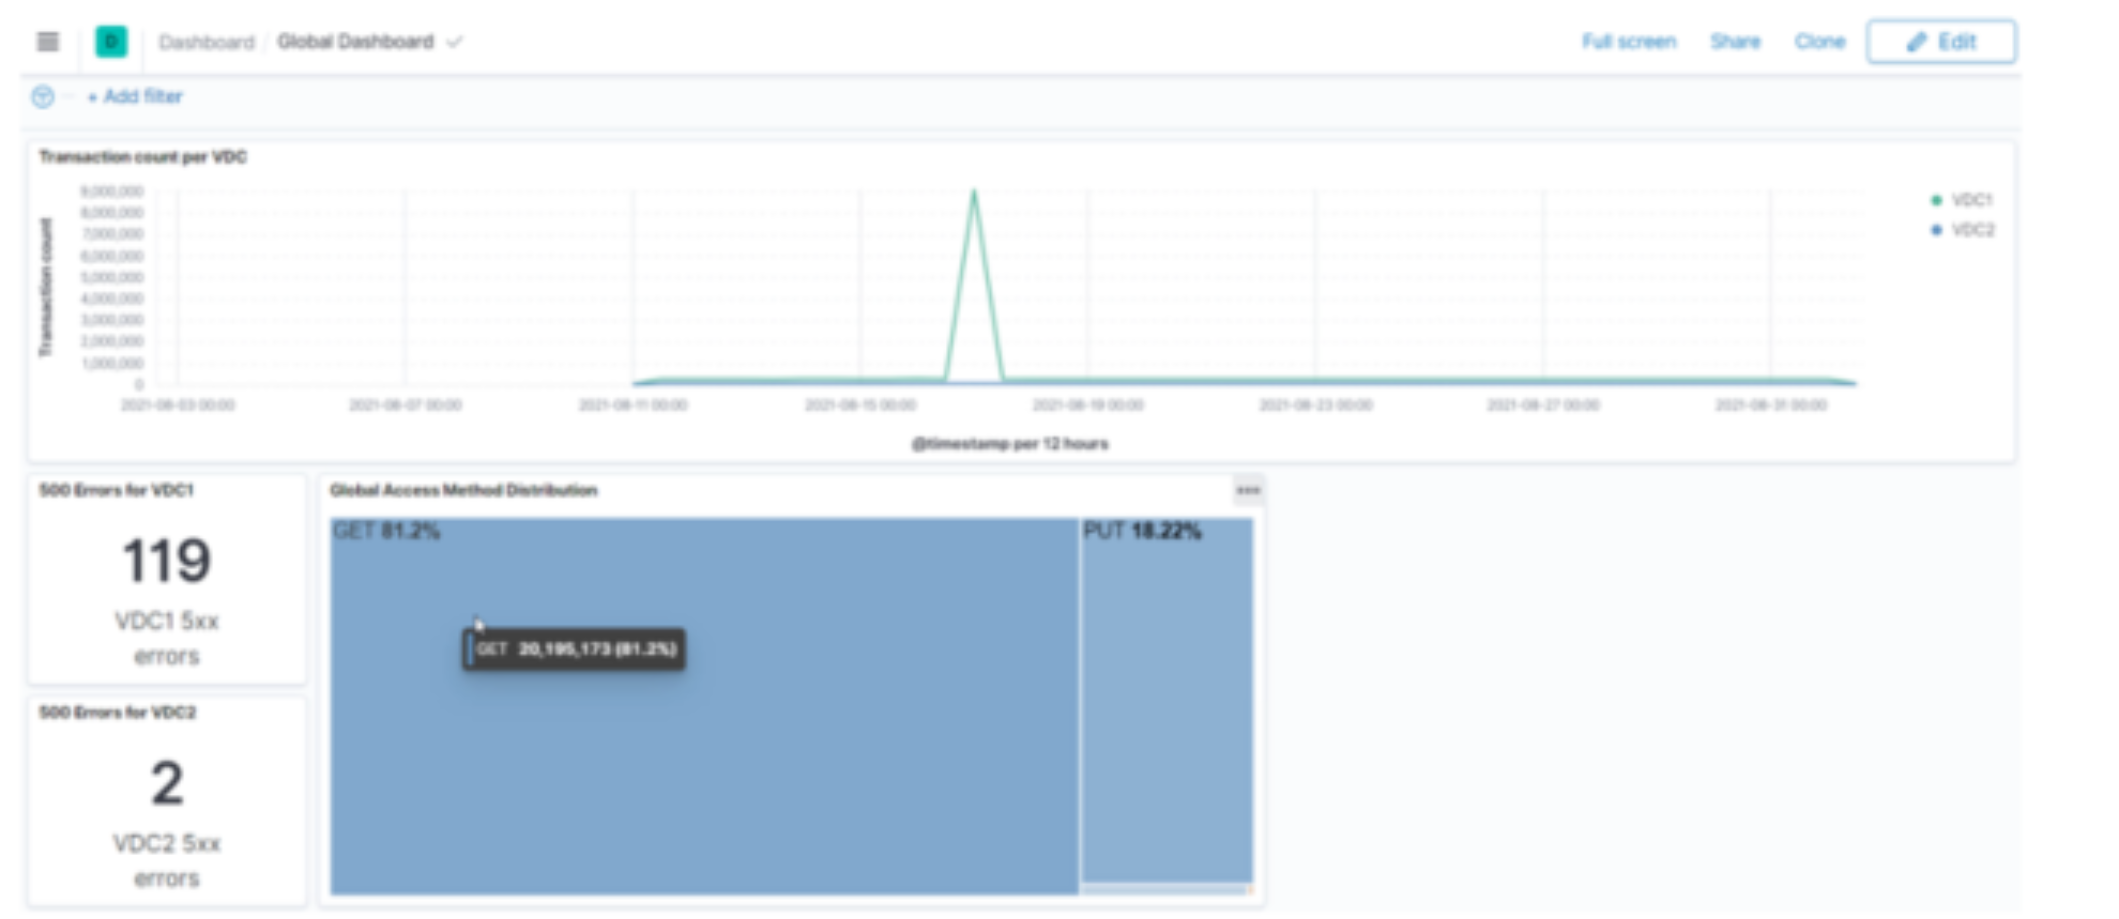
Figure 16. ECS Global Dashboard
Looking at the VDC specific dashboards, we can see some examples of views for data received from the ECS access logs, relating to transactions, throughput, access method, and Top N type reports.
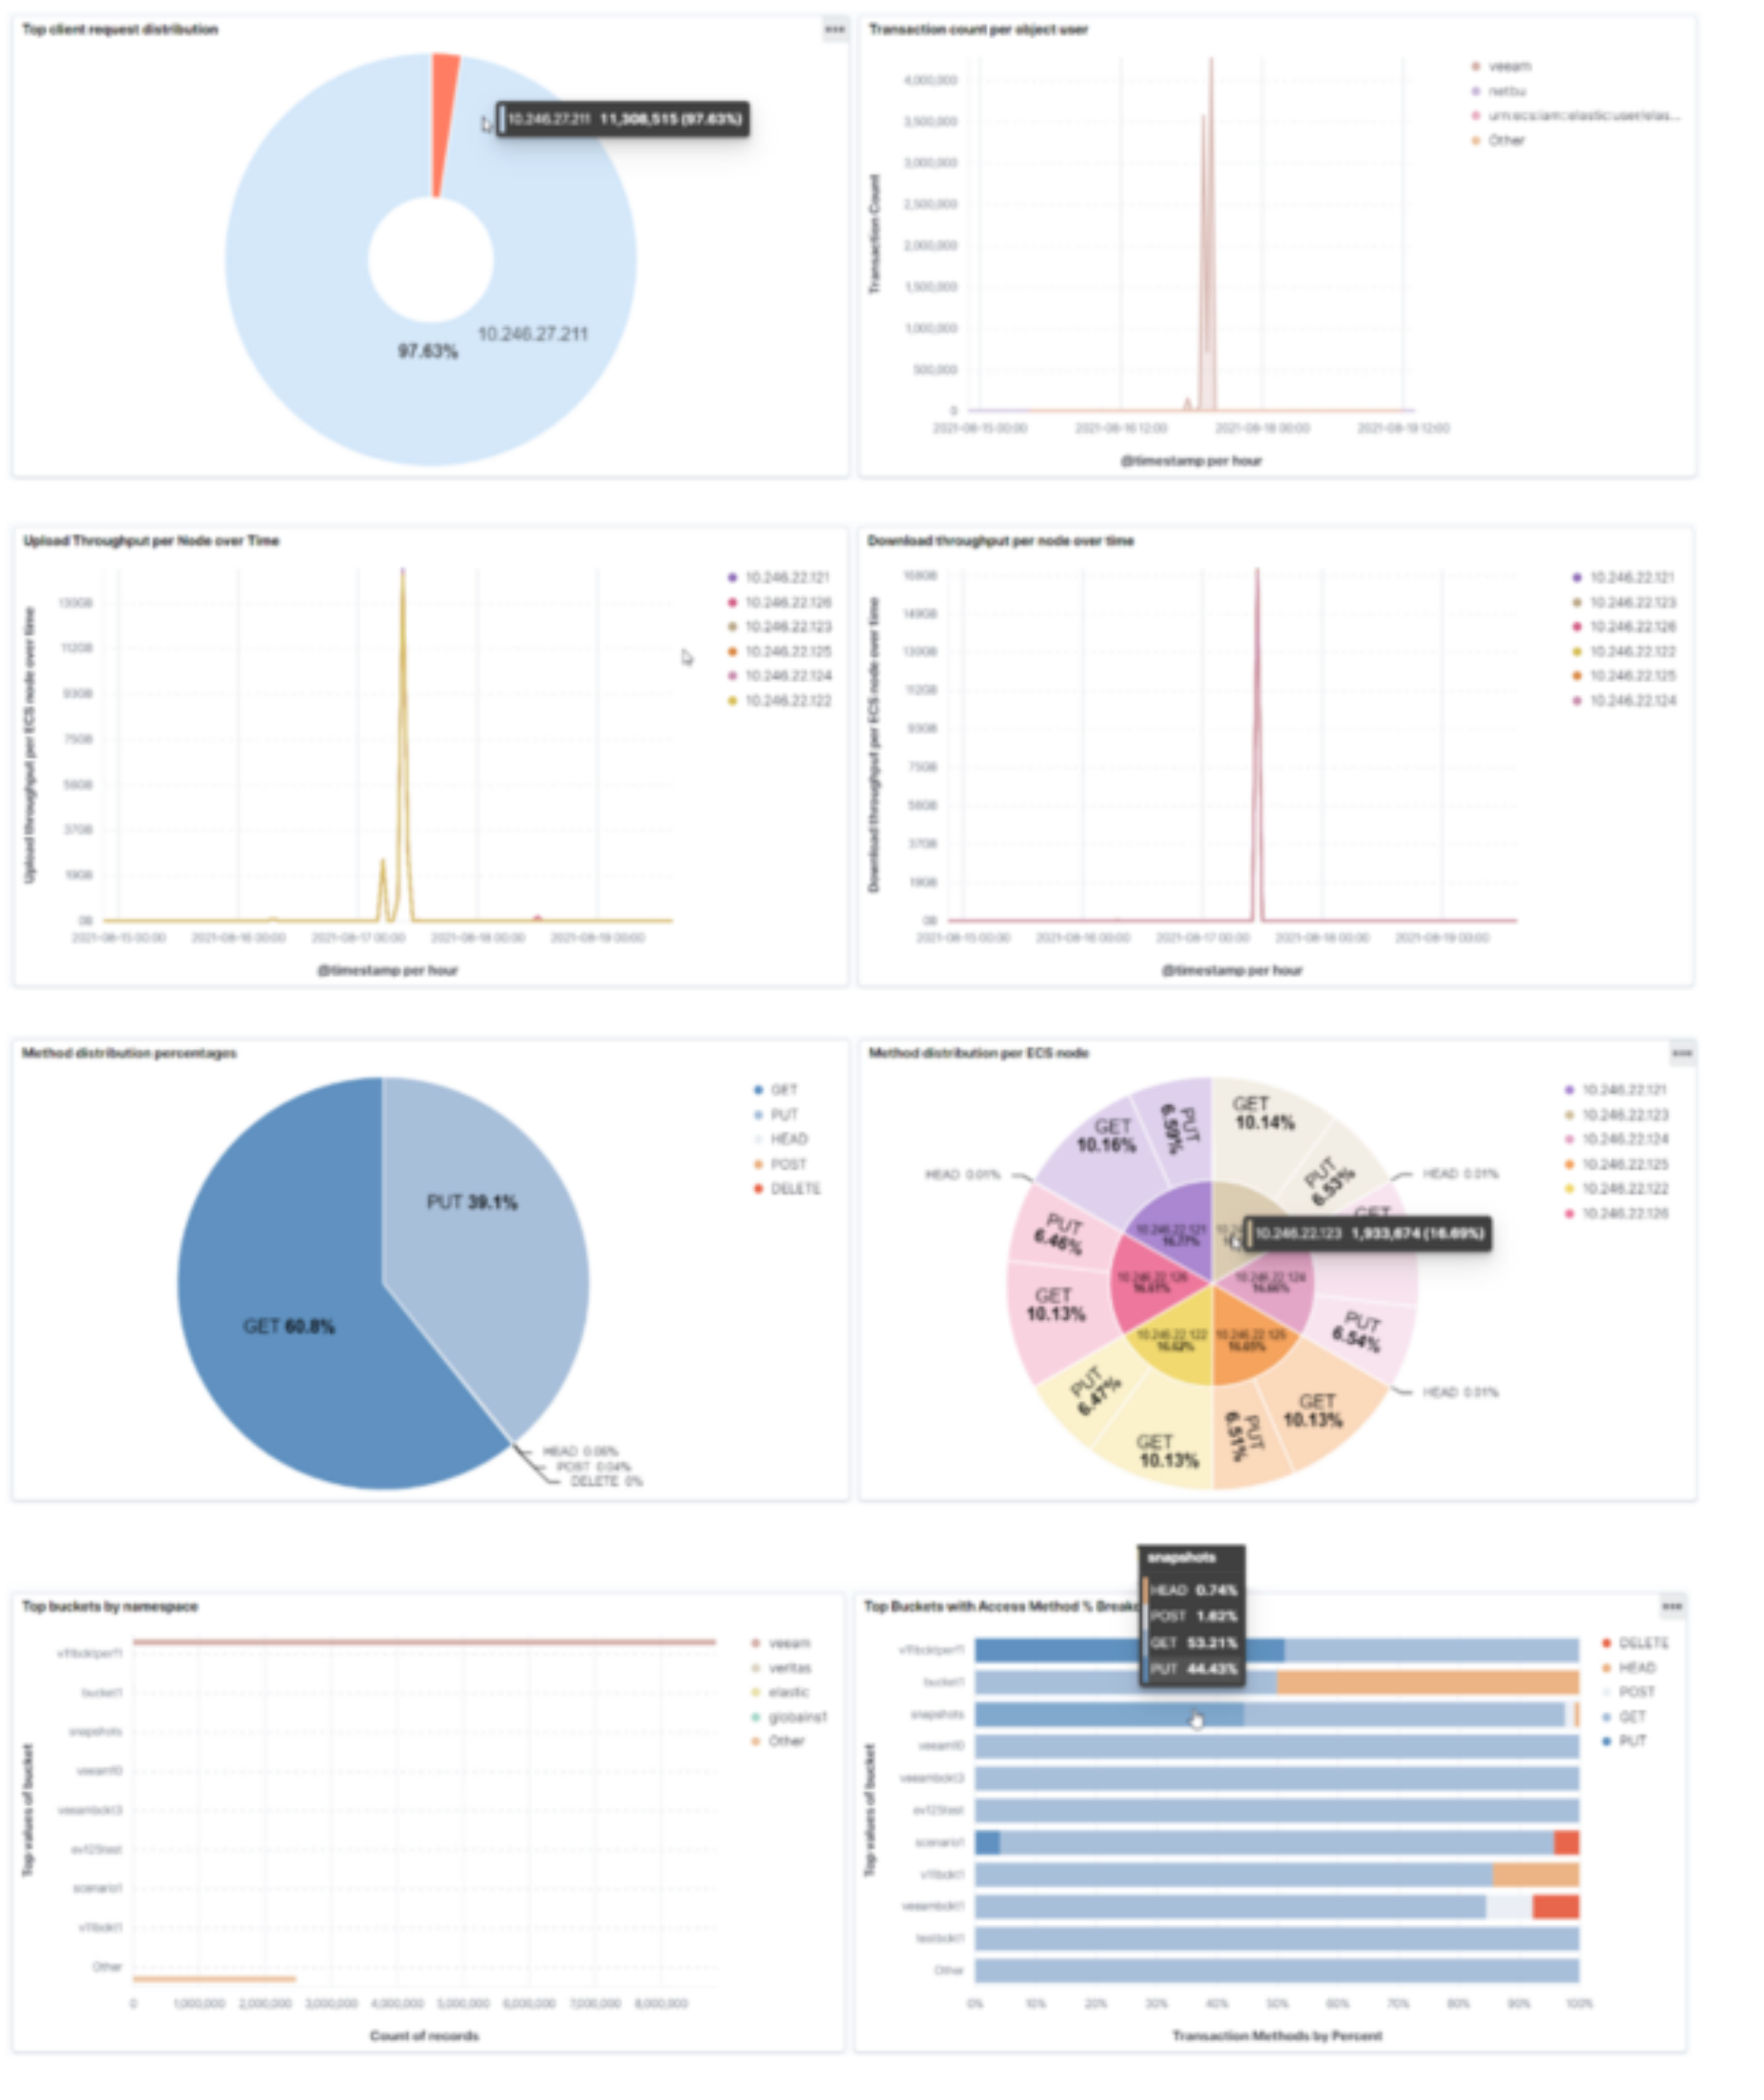
Figure 17. Example ECS site specific dashboard