
None
None
-
After the TFRecords are set up, the training workload test is run by logging into the nvidia_rn50 container.
Training workload
To run the training workload, start an interactive session with resnet50 container, and run the Python script to get the workload numbers as follows:
docker run --rm -it --gpus all --privileged --shm-size=1G --ulimit memlock=-1 -v /home/core/installs:/installs --ipc=host nvidia_rn50
export TF_ENABLE_AUTO_MIXED_PRECISION=1 #This enables auto mixed precision
python ./main.py --mode=training_benchmark --warmup_steps 200 --num_iter 500 --iter_unit batch --batch_size 256 --data_dir=/installs/imagenet_tf --results_dir=/installs/results --xla –amp
Use ResNet50 training to study the performance of the MIG partitions. Run the Python script across multiple iterations of vGPU profiles.
Each ESXi host has a single A100 GPU. Initially, the VM is configured with the grid_a100-7-40c vGPU profile and the training workload is run to capture the images/sec.
The VM is then reconfigured with grid_a100_4-20c to run the test and finally the VM is configured with grid_a100-3-20c to run the test.
During the testing process, we are unable to run ResNet training on partitions grid_a100-2-10c and grid_a100-1-5c. These partitions are suited for inference and are not recommended for neural network training. The training is run on the entire TFRecords for every vGPU profile.
The following figure shows the training workload data for various vGPU profiles:
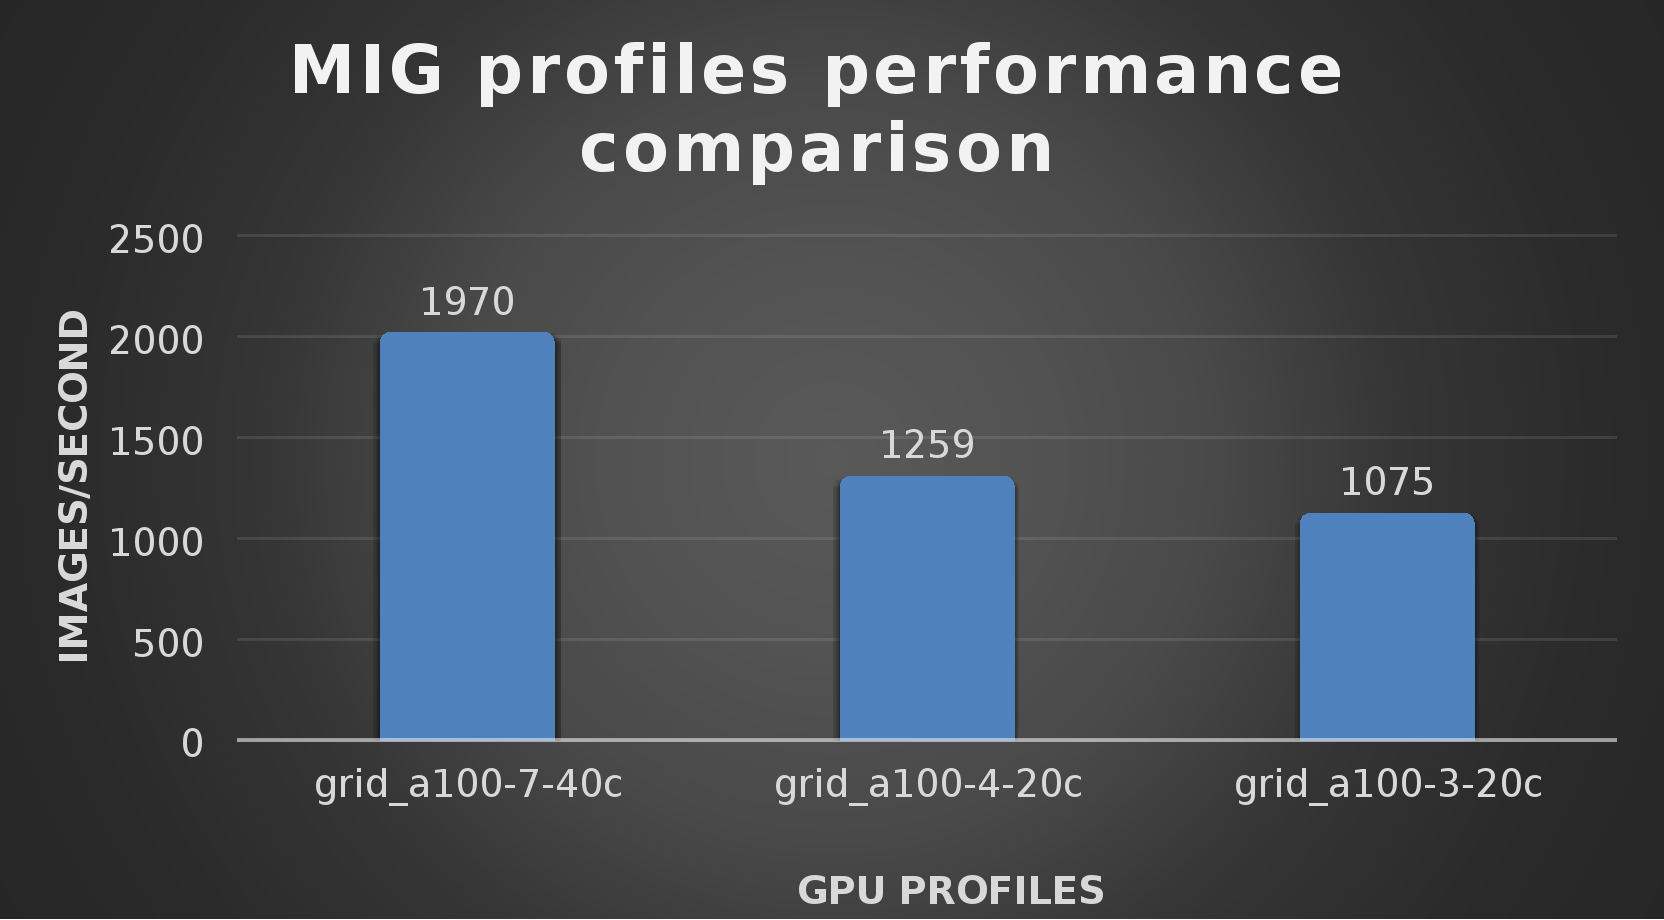
Figure 13. Training workload test across different MIG profiles
Note: The vGPU performance was measured using nvitop. During the test for every vGPU profile, the vGPU utilization of the VM’s is close to 98% as seen in the below figure and the CPU utilization is 14%. There is no PowerFlex storage bottleneck anywhere during the testing.
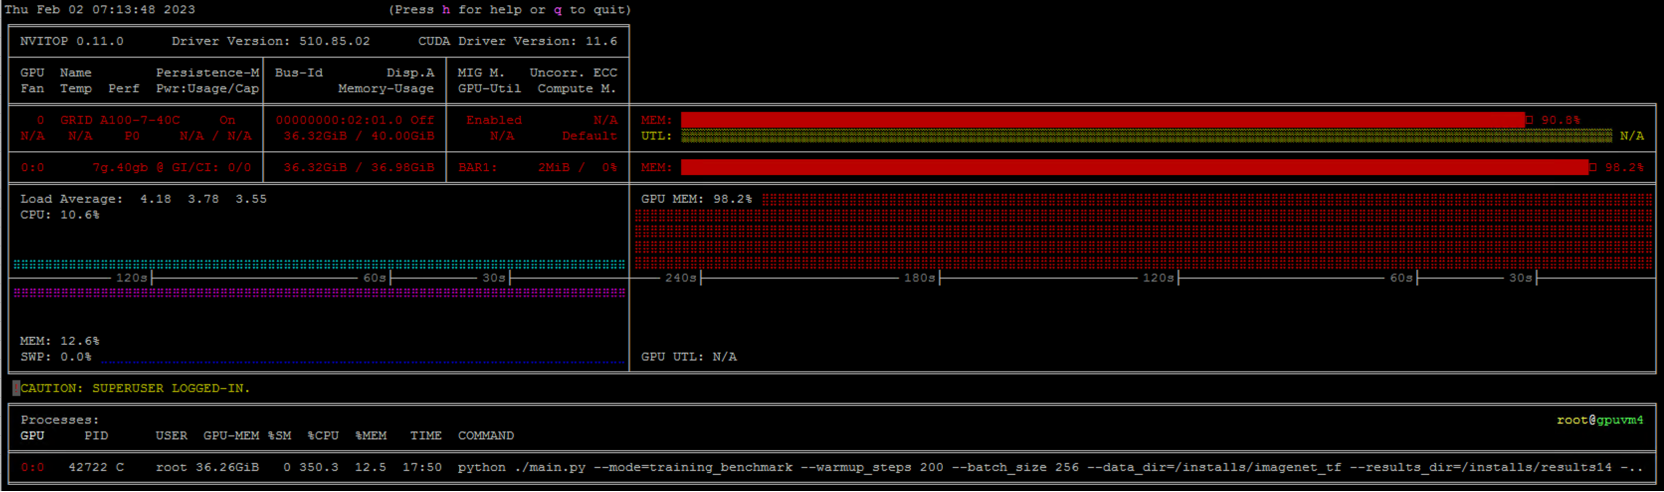
Figure 14. vGPU performance during training workload test measured using nvitop
Inference workload
ResNet-50 inference workload for image classification is often used as a standard for measuring the performance of machine learning accelerators.
To run the inference workload, start an interactive session with the resnet50 container, and run the Python script to get the workload numbers as follows:
docker run --rm -it --gpus all --privileged --shm-size=1G --ulimit memlock=-1 -v /home/core/installs:/installs --ipc=host nvidia_rn50
python ./main.py --mode=inference_benchmark --warmup_steps 200 --num_iter 500 --iter_unit batch --batch_size 256 --data_dir=/installs/imagenet_tf --results_dir=/installs/results --xla –-amp
For this test, an inference test is performed to study the performance of MIG profiles on a trained image set. This test is performed on a single ESXi host with VMs on it that are configured with different MIG profiles.
The following table shows different scenarios of VMs that are configured with varying MIG profiles, and their inference test numbers.
Table 3. RESNET inference test VM configuration on a single ESXi host
MIG profile configured on VM’s
Images/sec
A single VM with grid_a100_7-40c
3799
A single VM with grid_a100_4-20c
3342
A single VM with grid_a100_3-20c
3286
A single VM with grid_a100_2-10c
2274
Two VMs on the same host, with grid_a100_3-20c & grid_a100_2-10c
5429
Three VMs on the same host single VM with grid_a100_2-10c, grid_a100_1-5c and grid_a100_1-5c
5675
The following figure shows the graphical representation of the inference workload test results for different MIG partitions:
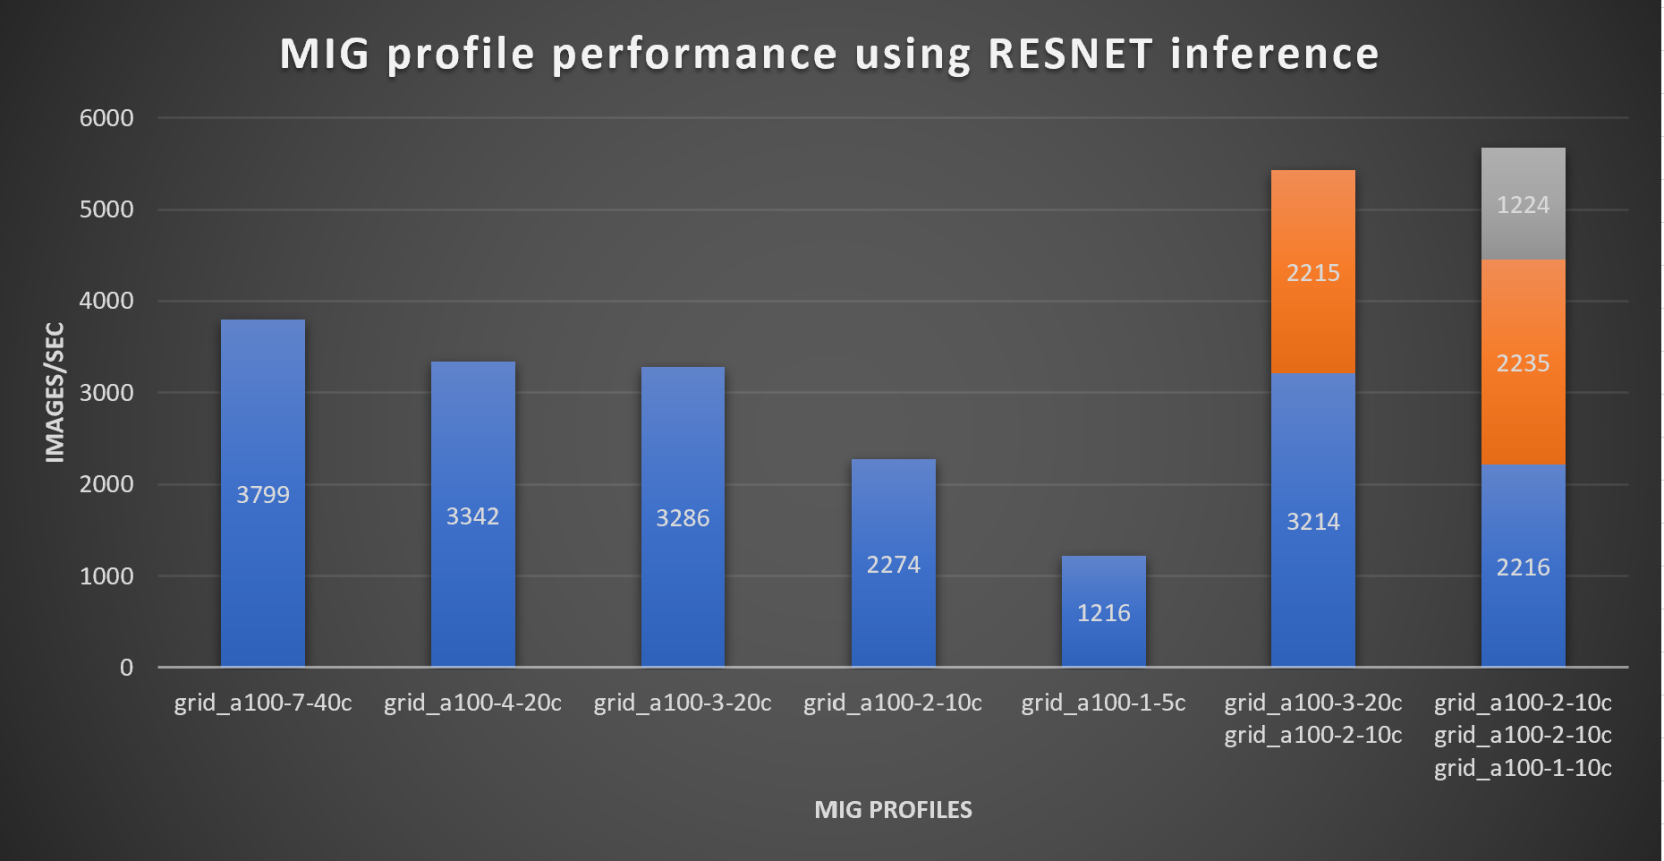
Figure 15. RESNET Inference workload on different MIG profiles
These results show the benefit of using MIG partitions with a vGPU. Machine learning jobs such as inference do not consume all the vGPU resources. Partitioning the GPU with MIG and assigning the partitions to VMs enables administrators to run multiple and mixed workloads, which greatly increases the utilization of the GPUs.
Note: The GPU performance was measured using nvitop. During the test the vGPU utilization of the VMs was close to 88% and the CPU utilization was 11%. There were no PowerFlex storage bottlenecks anywhere during testing.