
vVol metrics
vVol metrics
-
Real-time vVol metrics are available using the Unisphere CLI (UEMCLI) or REST API. When viewing vVol metrics, vVols are identified using their UUID, which is a unique ID assigned to each vVol by VMware vSphere.
The following is an example of the CLI command used to view real-time vVol metrics:
uemcli /metrics/value/rt -path sp.*.storage.vvol.pool.*.datastore.*.readBytesRate show -interval 5
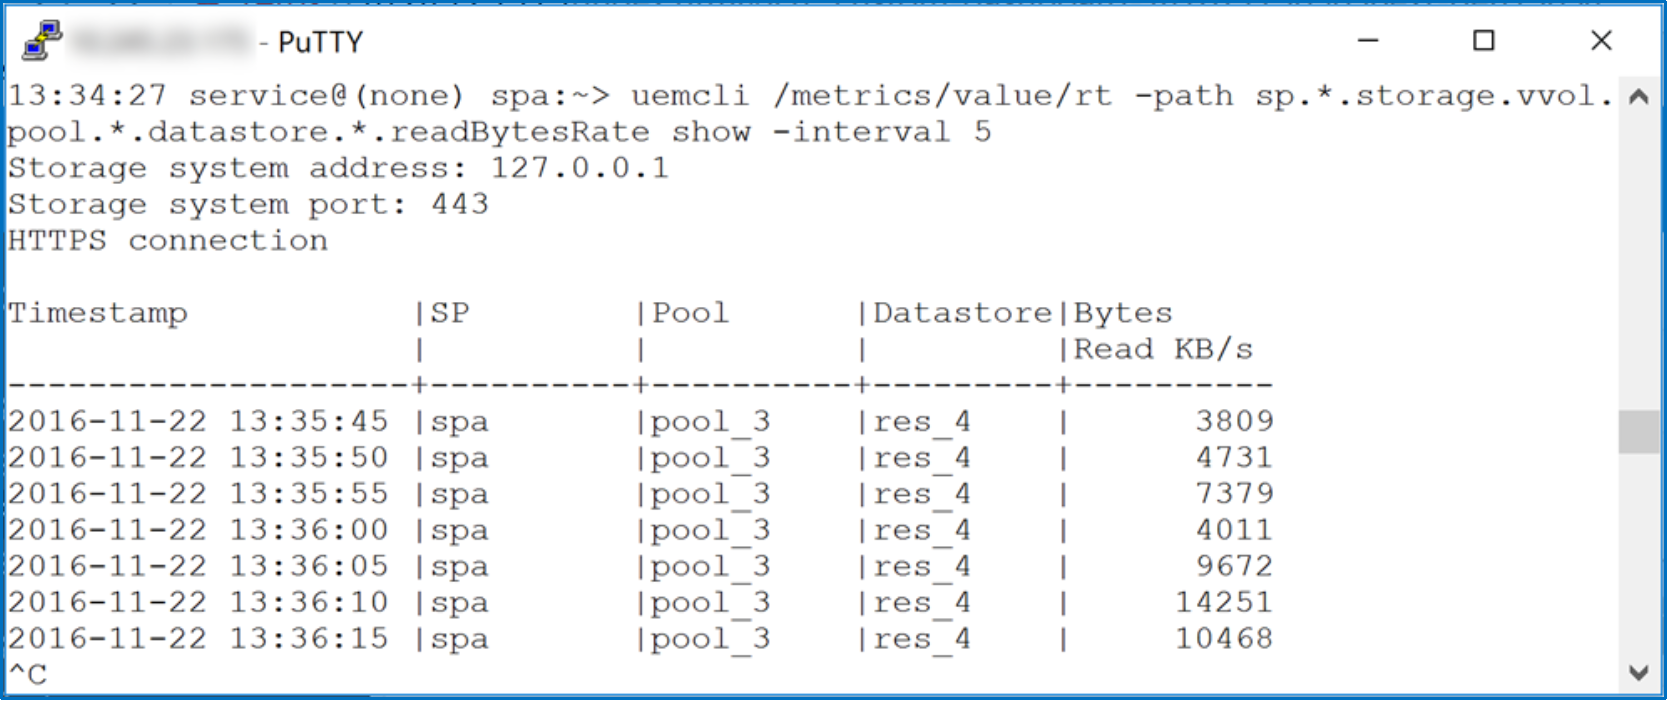
Figure 29. Viewing real-time vVol metrics from UEMCLI
Figure 30 shows a list of real-time vVol metrics that are available on Dell Unity storage.
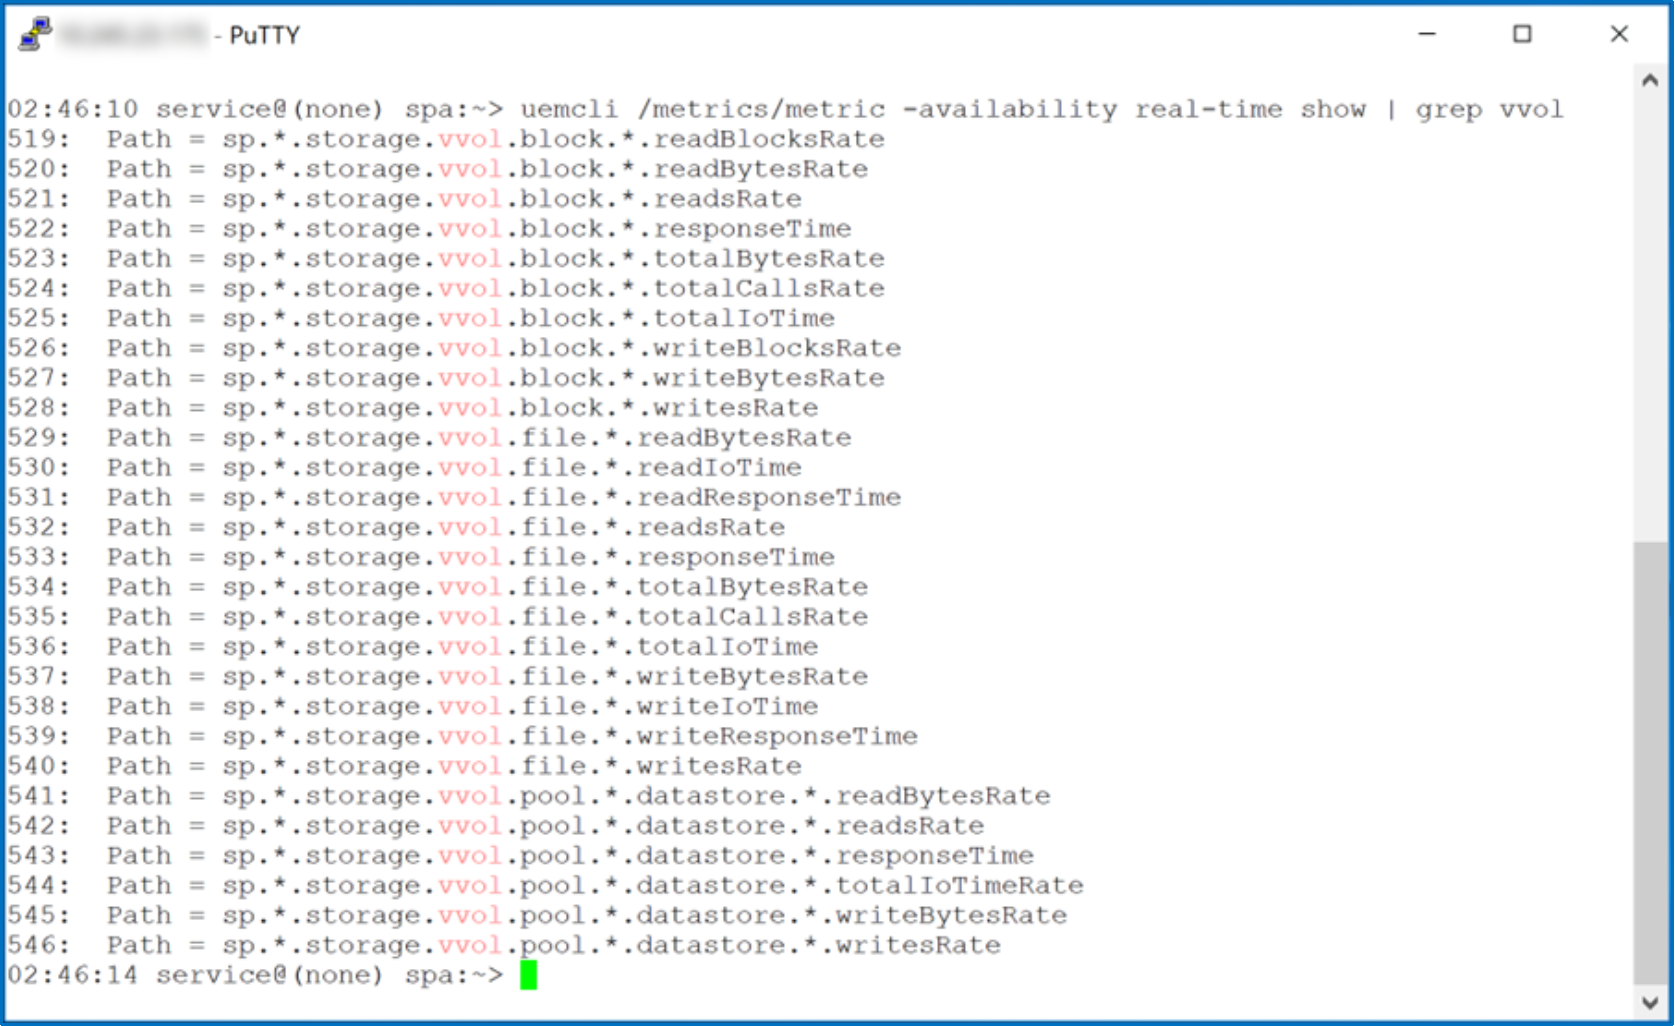
Figure 30. Real-Time vVol metrics
Starting with Dell Unity OE version 4.1, historical vVol metrics are available using Unisphere, the Unisphere CLI (UEMCLI), and the REST API. Figure 31 shows the available vVol metrics when adding a new chart to a historical dashboard under the Performance page. On the left, the system-level metrics are shown, while on the right, the vVol datastore metrics are shown.
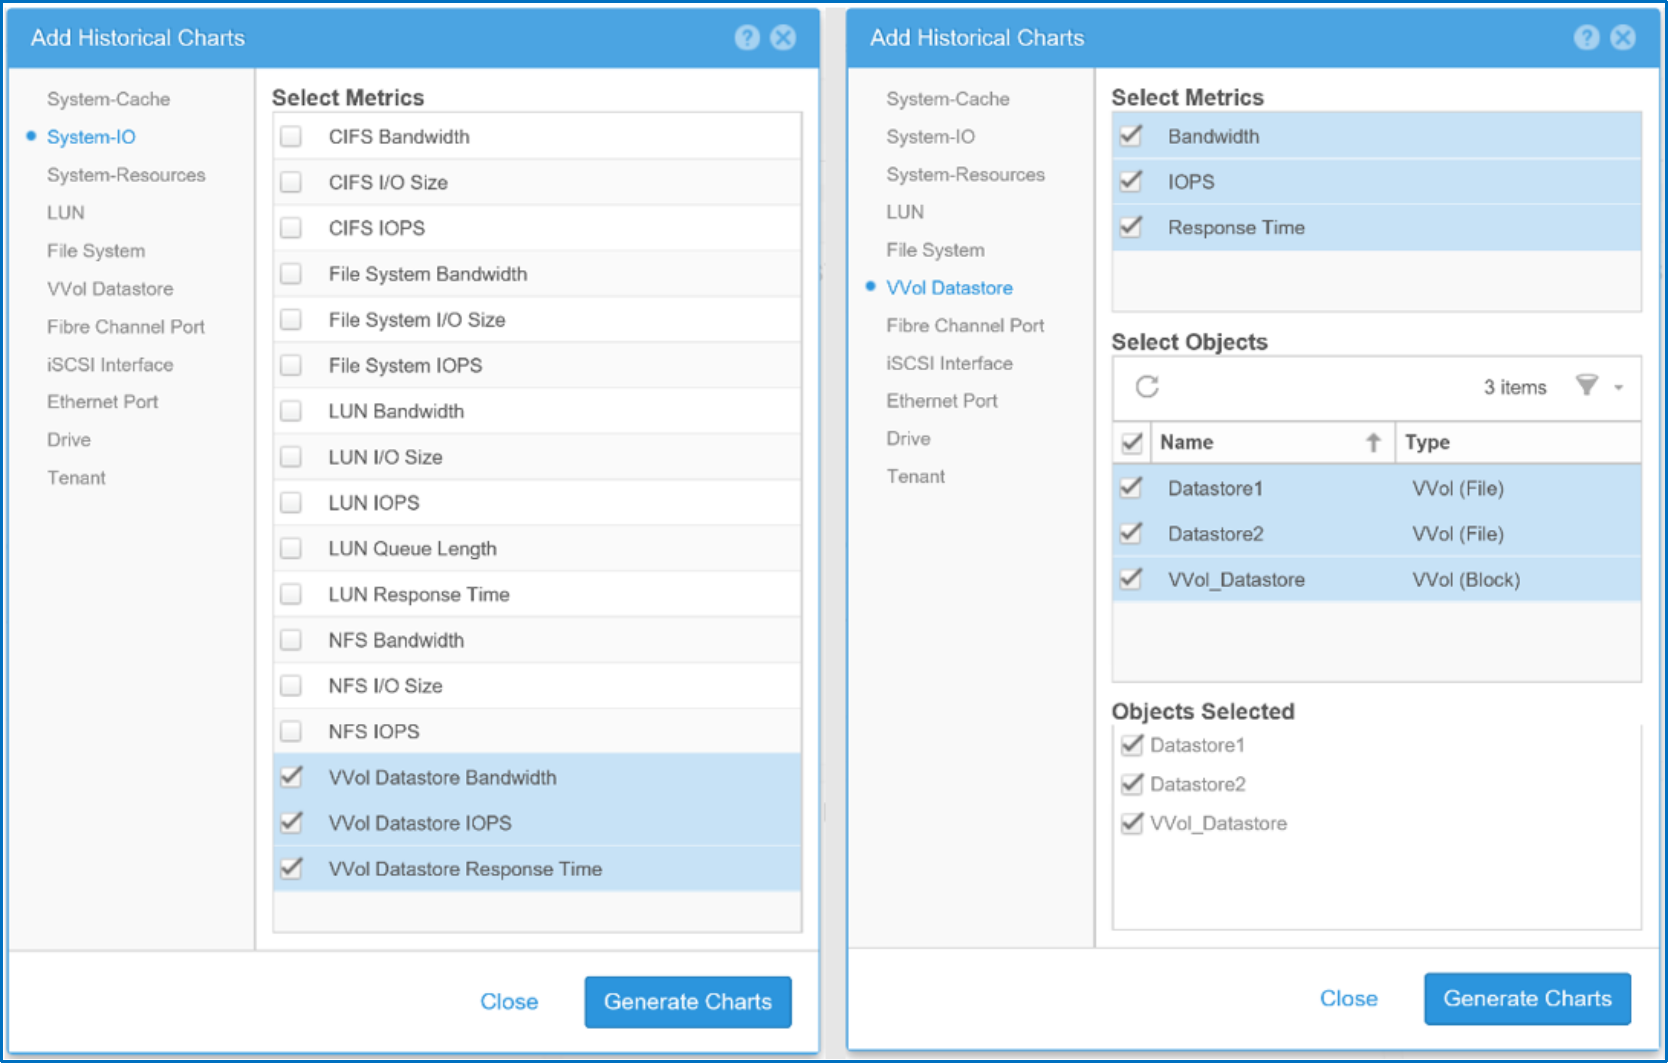
Figure 31. Adding historical charts
The following is an example of the CLI command to get historical vVol metrics:
uemcli /metrics/value/hist –path sp.*.storage.vvol.pool.*.datastore.*.readBytesRate show -interval 60
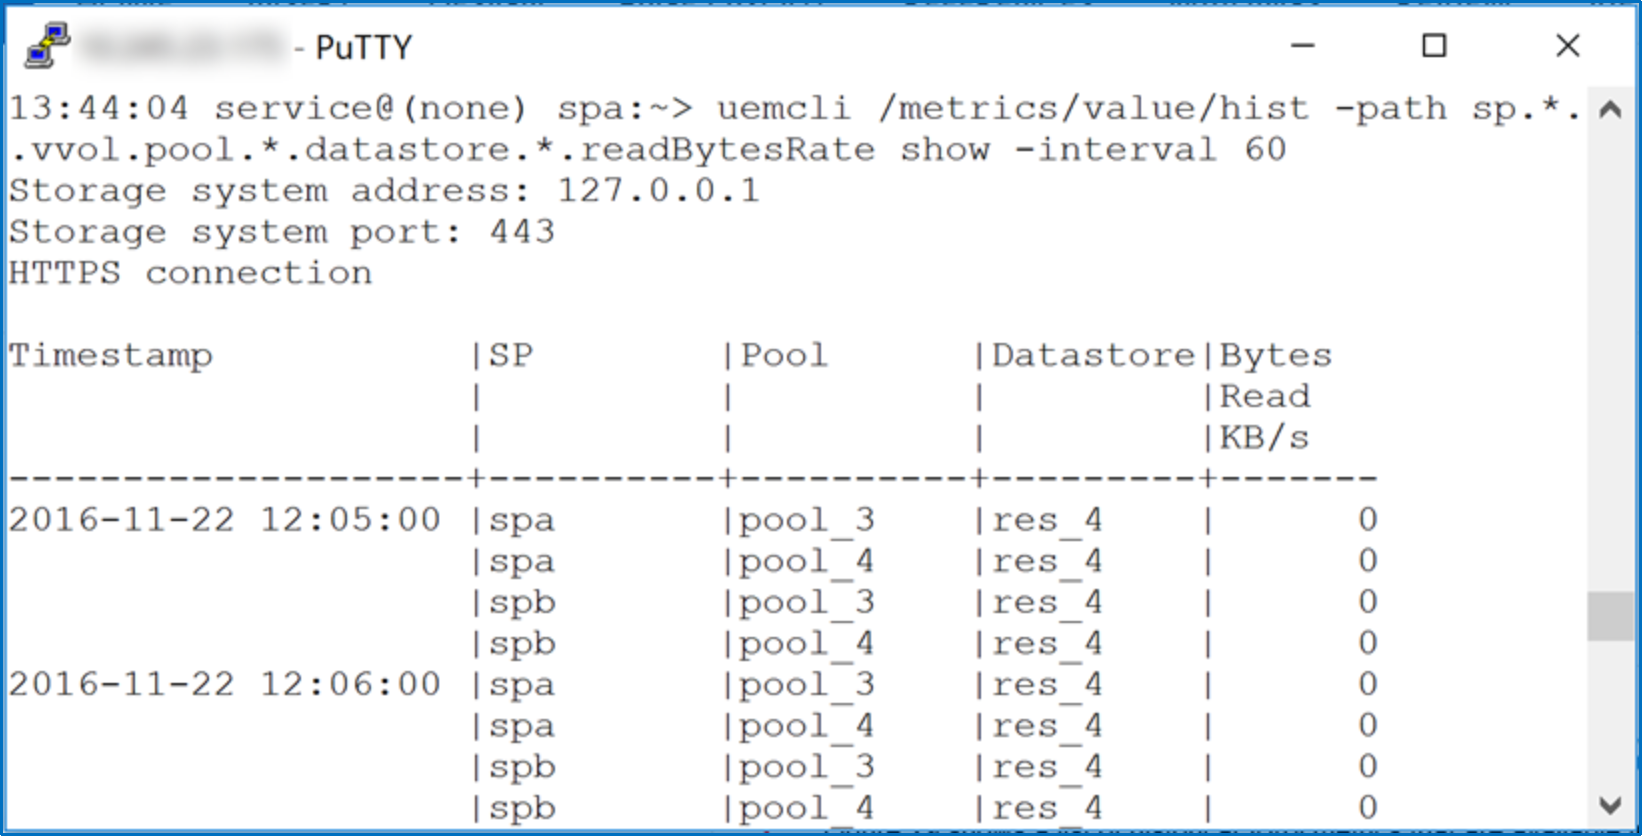
Figure 32. Viewing historical vVol metrics from UEMCLI
Figure 33 shows a list of historical vVol metrics that are available in Dell Unity storage.
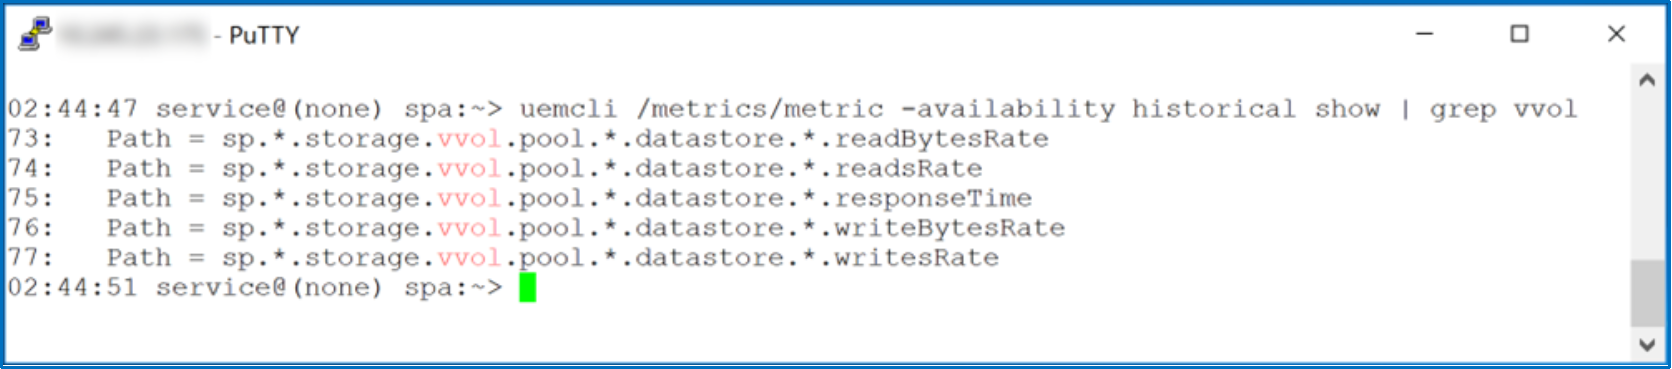
Figure 33. Viewing historical vVol metrics
For a vVol datastore that spans multiple pools, there is the option to view how much each pool contributes to the performance metric. The pool allocation per datastore can be seen by clicking the arrow next to the name of the datastore in the chart’s legend. Figure 34 gives an example of the IOPS pool allocation per datastore for a vVol datastore that spans two pools: Extreme_Pool and Capacity.
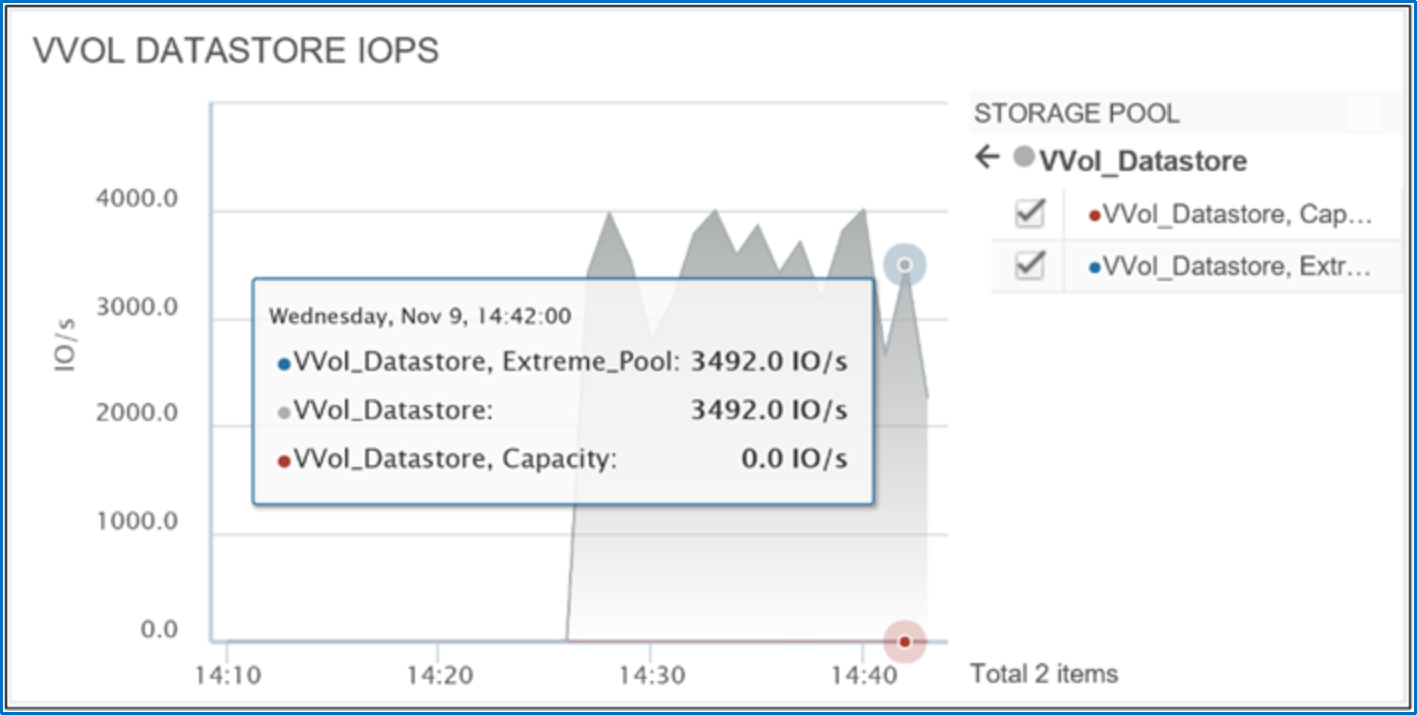
Figure 34. Pool allocation per datastore
Refer to the Unisphere Command Line Interface User Guide on Dell Support for more information about viewing historical and real-time metrics using UEMCLI.