
System View
System View
-
On the System View page, as shown in Figure 7, the Summary tab displays several important system details, like serial number, system model, Software Version, System time, and average Power consumption. This information can be found in the top section. The second section, SYSTEM HEALTH ISSUES, displays any health-related issues including storage resource, port connectivity, and hardware issues that are in a non-ideal state (for example, faulted). The bottom section, FRONT END PORT displays information about the ports that have been configured on the system and their status.
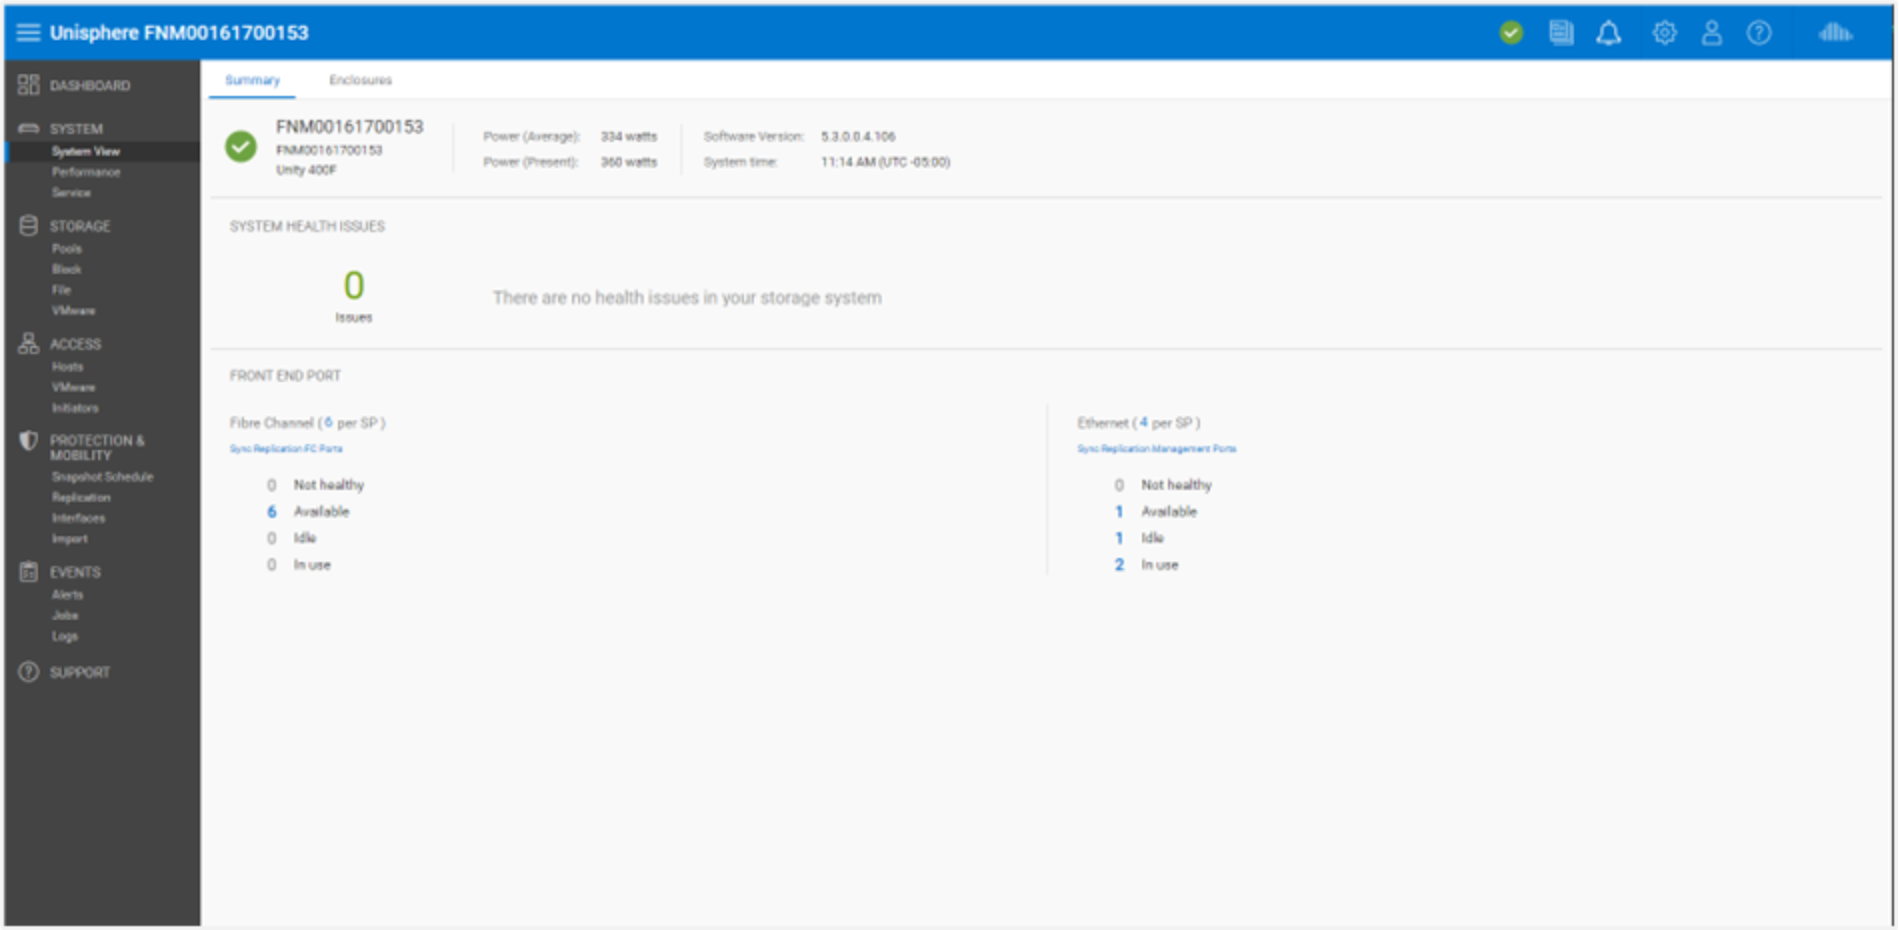
Figure 7. System View Page: Summary Tab
On the Enclosures tab of the System View page, the system shows various views of the physical system in graphical representations. As shown in Figure 8, the rear of the system is the default view when going to the page. Users can see that some ports are highlighted green, signifying that a connection for those ports is present and is in a good state. The graphical models are clickable, allowing users to see more information about specific components, which can be helpful in identifying part numbers when trying to order or replace different system parts. When components are faulted, they are highlighted with an amber color to signify that the component needs to be fixed or replaced.
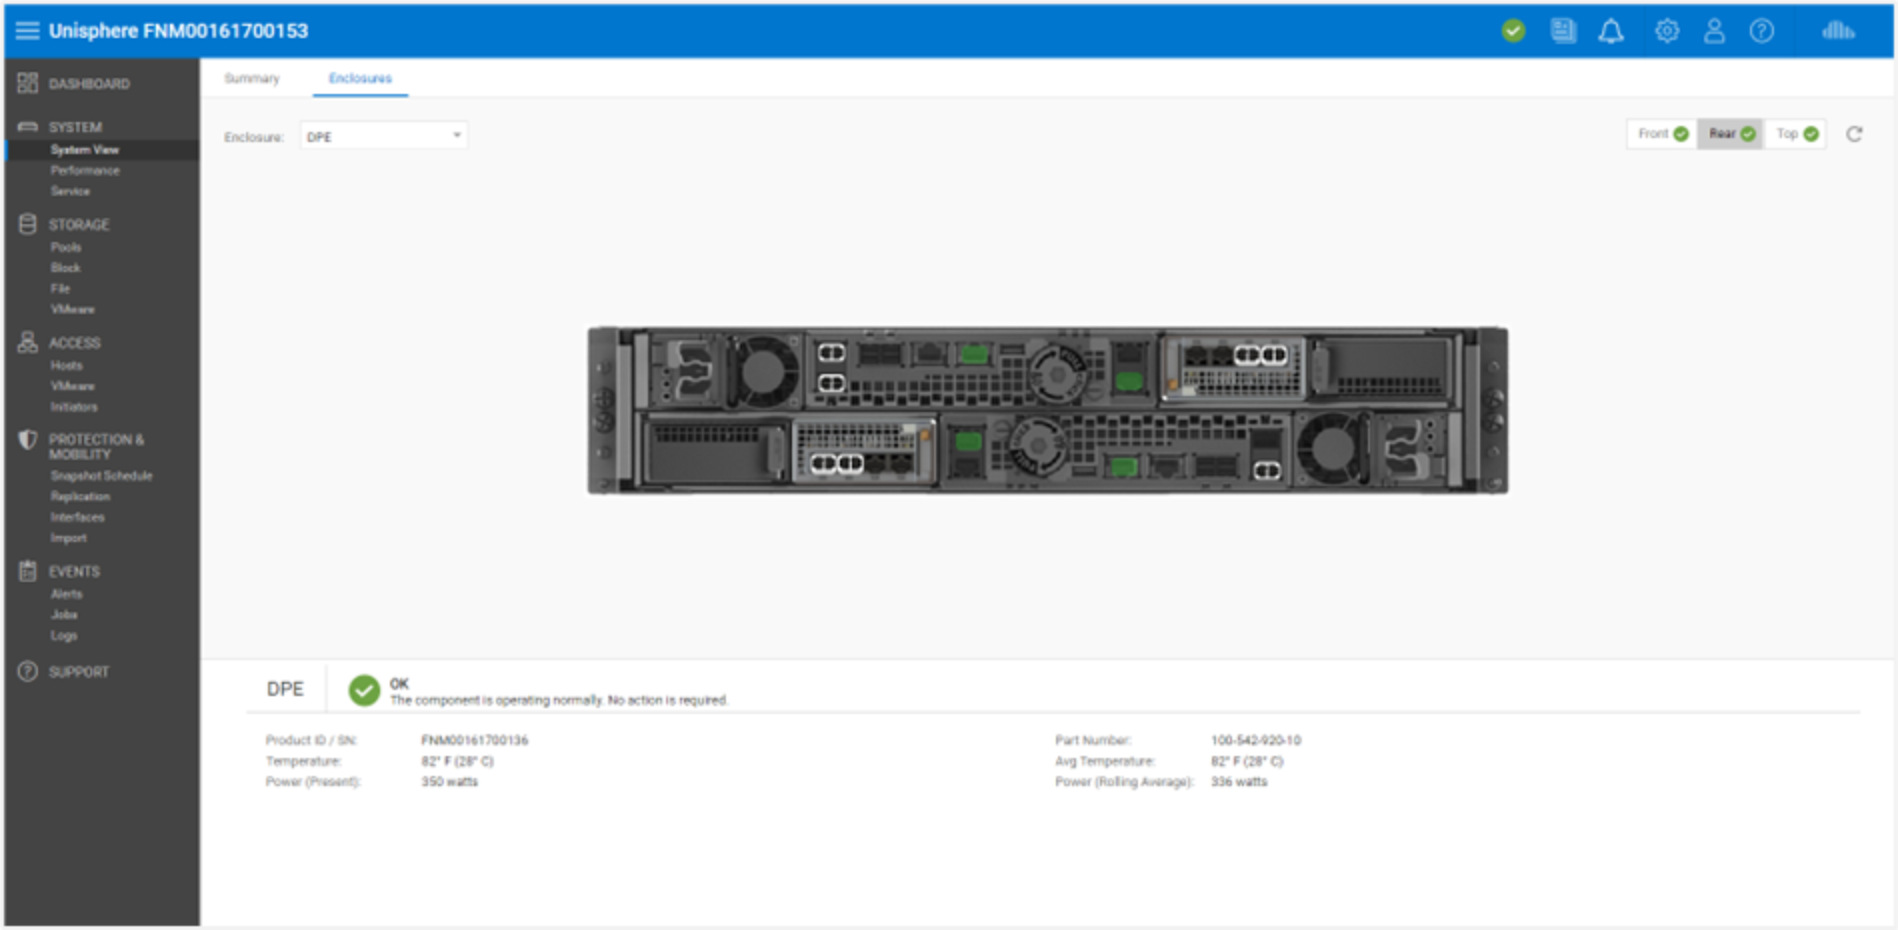
Figure 8. System View: Enclosures Tab
For a Dell UnityVSA system, the System View page also includes both Summary and Enclosures tabs. The Summary tab shows similar information as a physical system, while the Enclosures tab shows only network components, since Dell UnityVSA is a virtual system. Dell UnityVSA includes an additional Virtual tab, which displays the virtual drives on the Dell UnityVSA VM. For more information about Dell UnityVSA, see the Dell UnityVSA white paper.
As a system provisions and shares out storage resources, the system collects performance statistics about the system, its resources, and network I/O from external hosts. These performance statistics can be viewed from the Performance page on the Performance Dashboard tab by adding and customizing available performance dashboard and metrics charts, as shown in Figure 9. Users have the option to create Historical and Real-time dashboards.
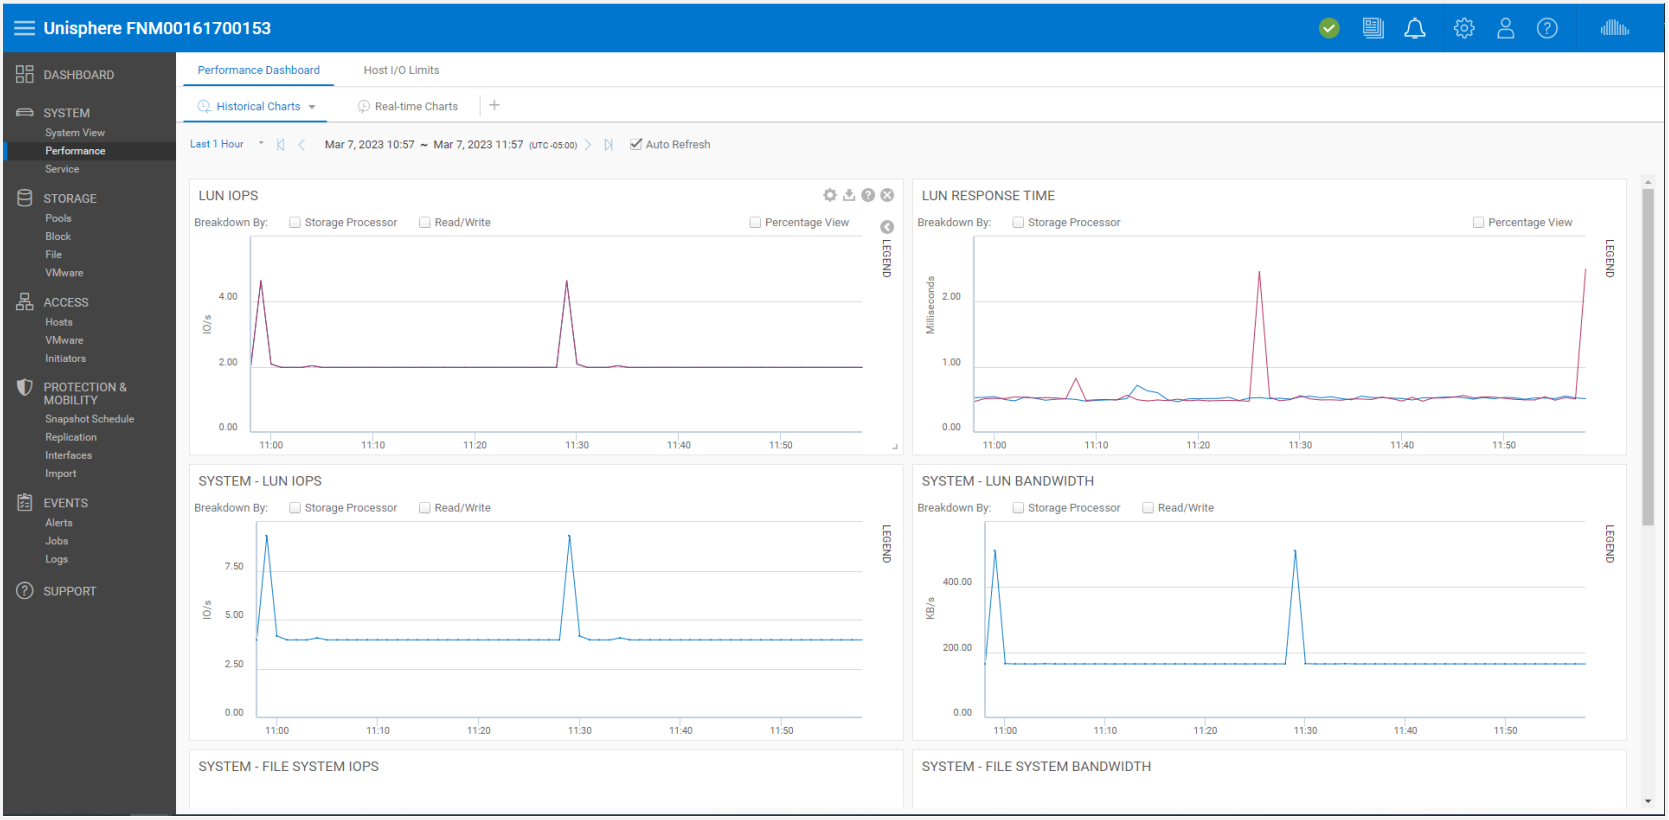
Figure 9. Performance Dashboard – Historical Charts
In terms of chart viewing options, the preset time ranges at the top of the page allow users to focus on a certain time range by selecting a time range or going backward or forward in time for troubleshooting potential issues. All charts on the same dashboard display the same time range, as specified by the time range bar. This ensures quick and easy comparisons between different charts. Next to the time range bar are selectable default time ranges and a custom option for specific time range viewing.
As metrics data ages, the data gets aggregated into longer sampling intervals for historical referencing up to 90 days. The following table shows the metric retention periods and associated sampling intervals:
Table 3. Sampling intervals and retention periods
Time Range Setting
Sampling Interval
Last 1 Hour
1 Minute
Last 4 Hours
1 Minute
Last 12 Hours
5 Minutes
Last 24 Hours
5 Minutes
Last 7 Days
1 Hour
Last 30 Days
4 Hours
Last 90 Days
4 Hours
Custom
Varies based on the length of the range. if the range is more than one week, the sampling interval is 4 hours.
The second dashboard on the Performance Dashboard page is the Real-time Charts dashboard. Real-time metrics display data collected during the current session, over a maximum time range of 15 minutes. The session ends when the user navigates away from the current tab and restarts when the user navigates back to the tab. The Real-time Charts dashboard can display up to four real-time metrics charts at a time on a dashboard. The sampling interval for real-time metrics is every 5 seconds.
For more information about Performance Metrics, see the Dell Unity: Performance Metrics white paper.
The second tab available on the Performance page is the Host I/O Limits tab, as shown in Figure 10. This tab allows users to configure, modify, delete, and view I/O limits on block resources provisioned on this system. Setting a Host I/O Limit limits the amount of IOPS and/or bandwidth between a given block storage resource and connected hosts/applications. A user might want to use this feature to control the amount of I/O requests from nonessential workloads so that these workloads do not impact other valuable storage resources and affect critical workloads. Another use case might be a service provider wanting to set a maximum level of service based on a customer’s subscription. An I/O limit policy can be applied to an individual LUN/VMFS Datastore or to a group of LUNs. The user can also apply a shared policy among multiple resources. A shared policy limits the combined activities of all the resources in the group.
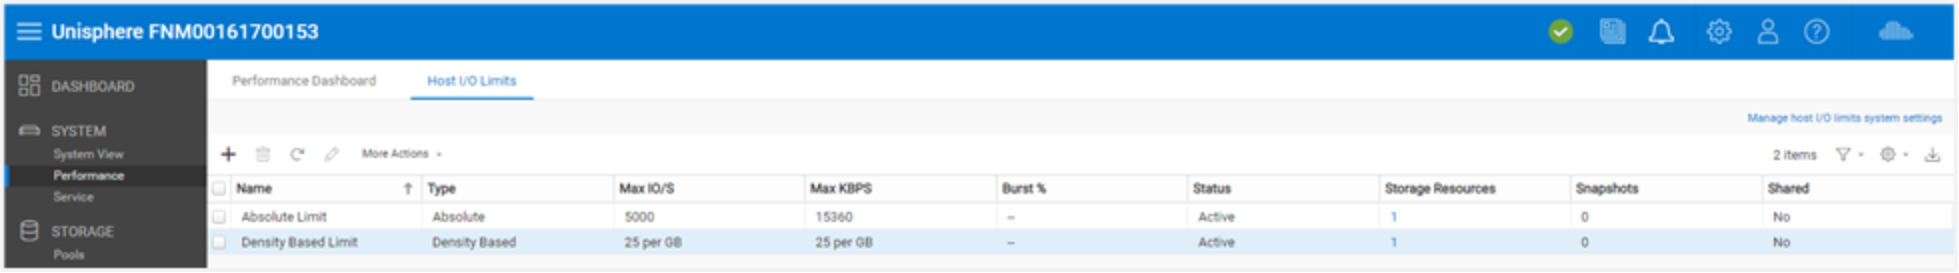
Figure 10. Host I/O Limits