
Dashboard
Dashboard
-
The Dashboard page is the first page the user will see when logging into Unisphere, as shown in Figure 6. The page is a customizable view of status of various system details, including system capacity, system health, storage health, and high-level system performance. Each status is displayed using “view blocks,” which users can add, modify, and delete as needed.
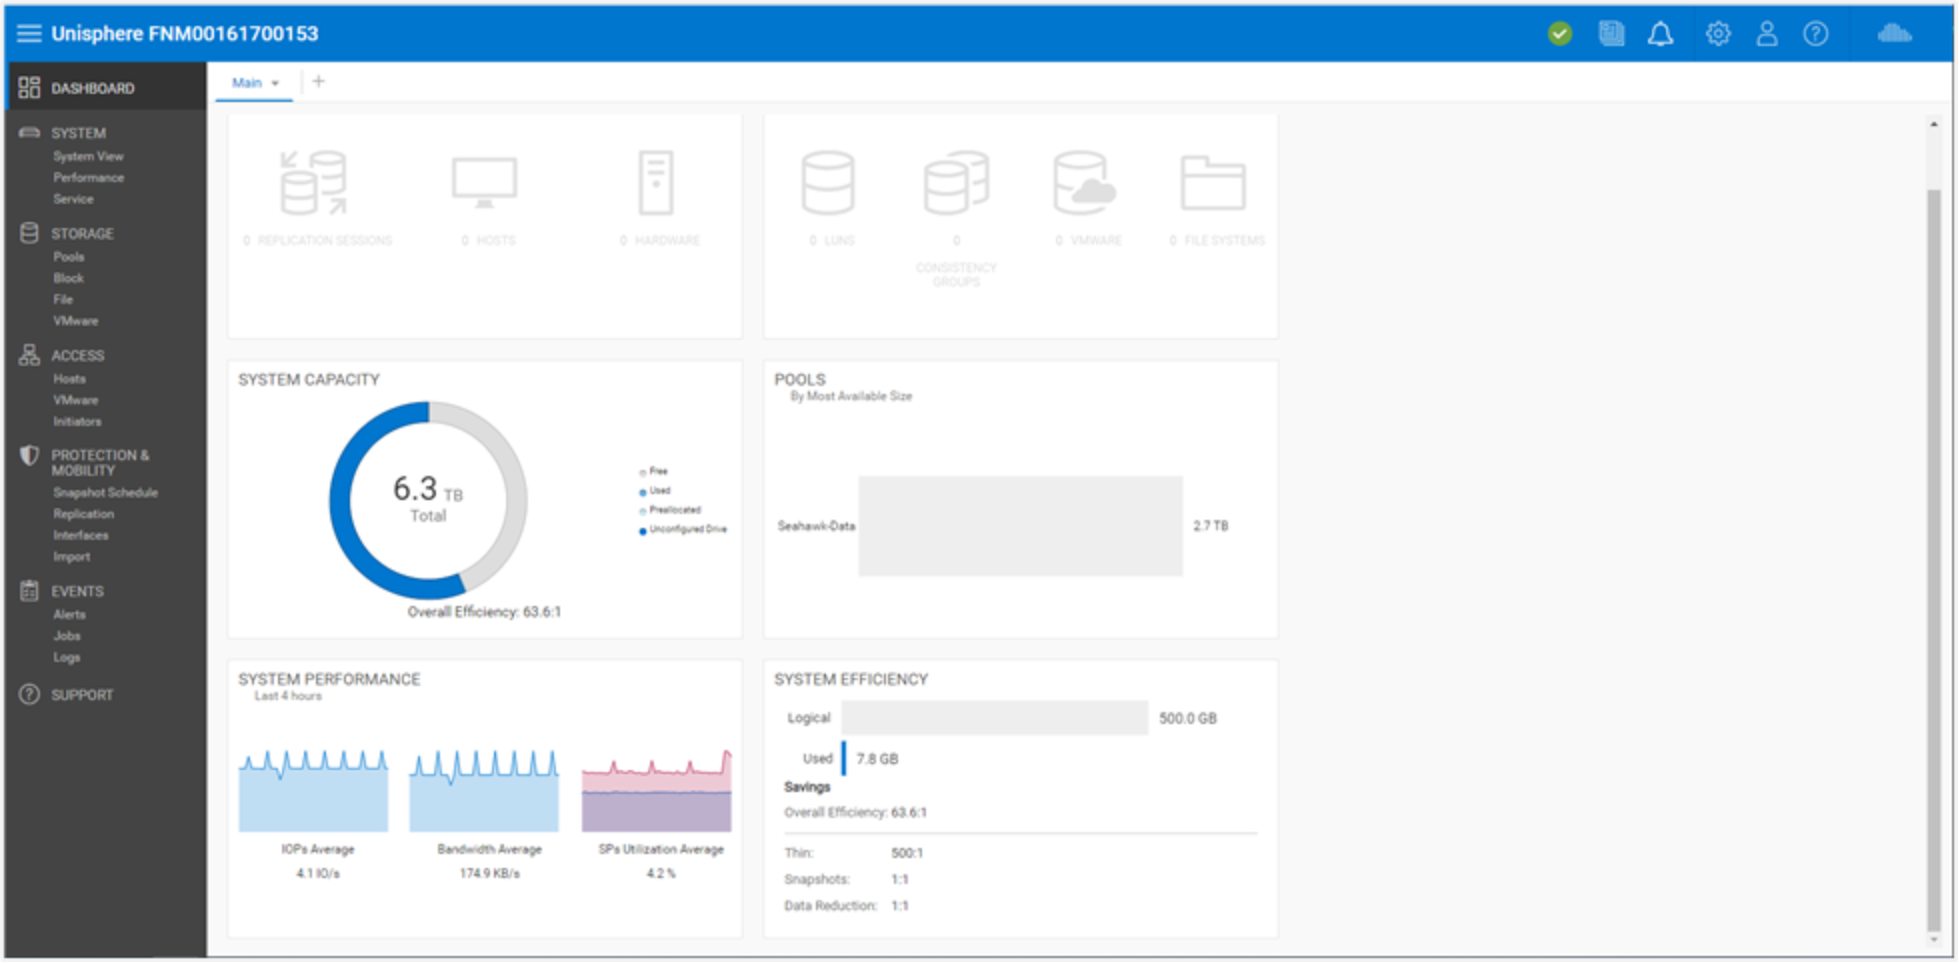
Figure 6. Dashboard Page
Users can also add or remove dashboards to save customized views for different purposes. At least one dashboard must be available on the page. The following table shows the available view blocks for the dashboard.
Table 2. Available View Blocks for the Dashboard
View Block
Description
System Health
Shows health status for system objects (for example, Replication Sessions, Hosts)
Storage Health
Shows health status for storage objects (for example, LUNs, File Systems, Datastores)
System Capacity
Shows total capacity, free, used, preallocated, and unconfigured drive space. Also shows the overall efficiency of the system.
Tier Capacity
Shows the used and free space for each storage tier
Pools
Shows free and used pool capacity in each pool
System Alerts
Shows all alerts for the system (categorized by severity)
System Performance
At a glance view of key performance indicators
System Efficiency
Displays savings information from thin, snapshots, and data reduction