
Test results and performance analysis
Test results and performance analysis
-
Training image throughput
The Single Shot MultiBox Detector model training benchmark performance results are shown in Figure 11. It is obvious from the results that image throughput scale linearly from four to 64 GPUs.
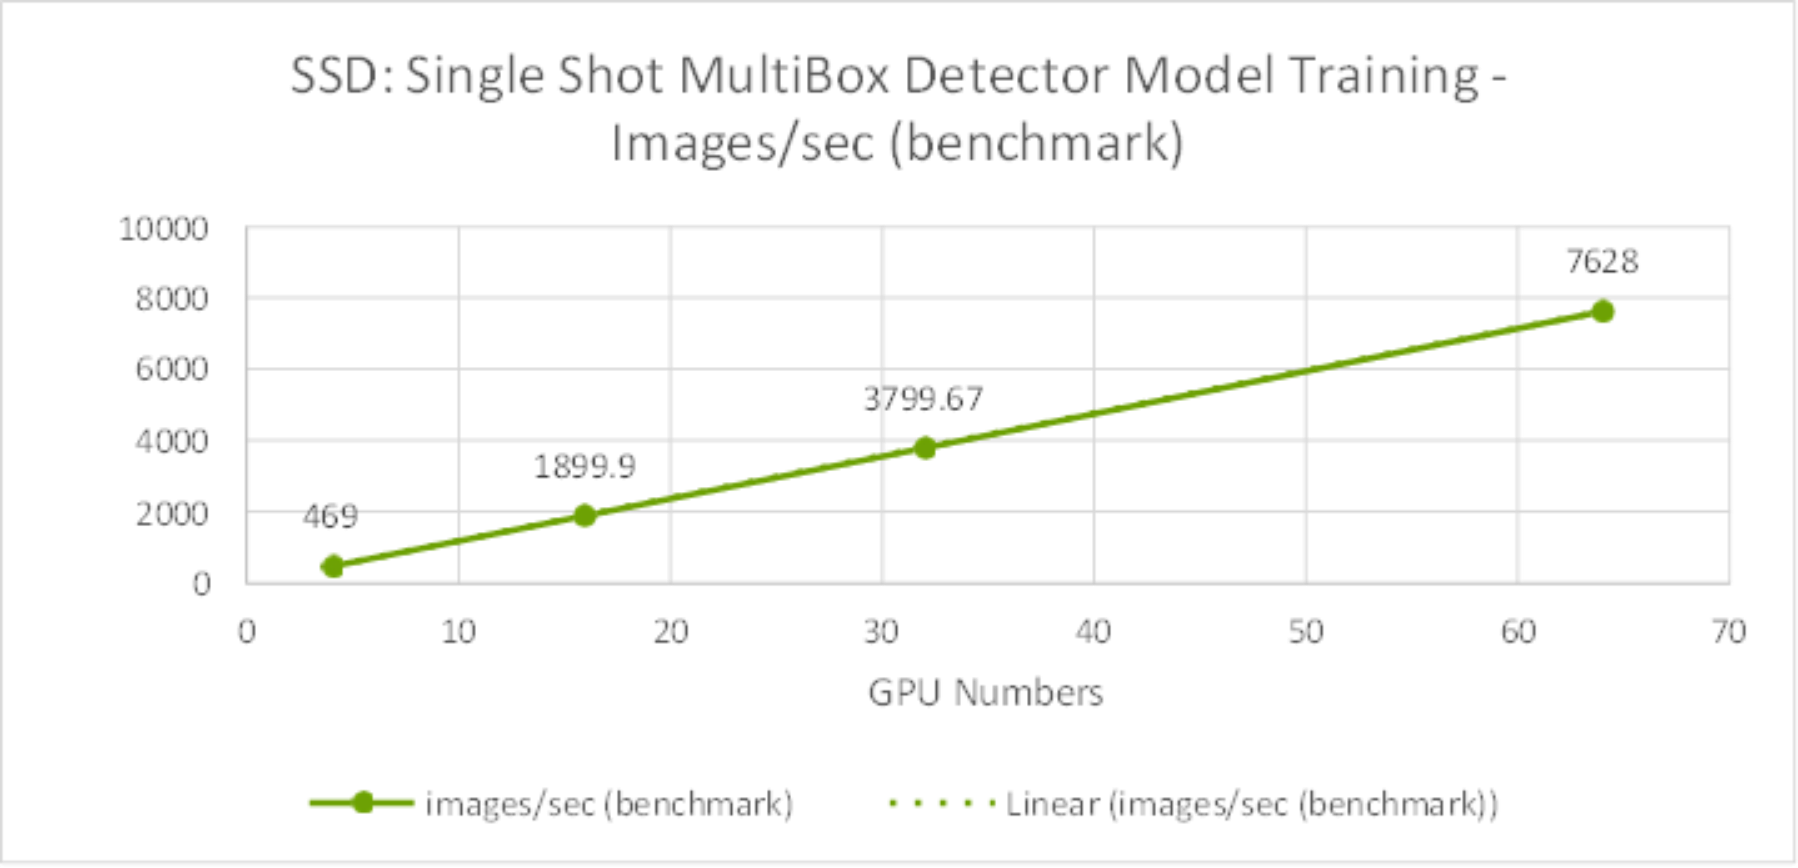
Figure 11. SSD Model Training Benchmark – Images/sec from 4 GPUs to 64GPUs
The DeepLabv3+ model training performance results are shown in Figure 12.The test results also show the training throughput grow linearly from 4 GPUs to 64 GPUs.
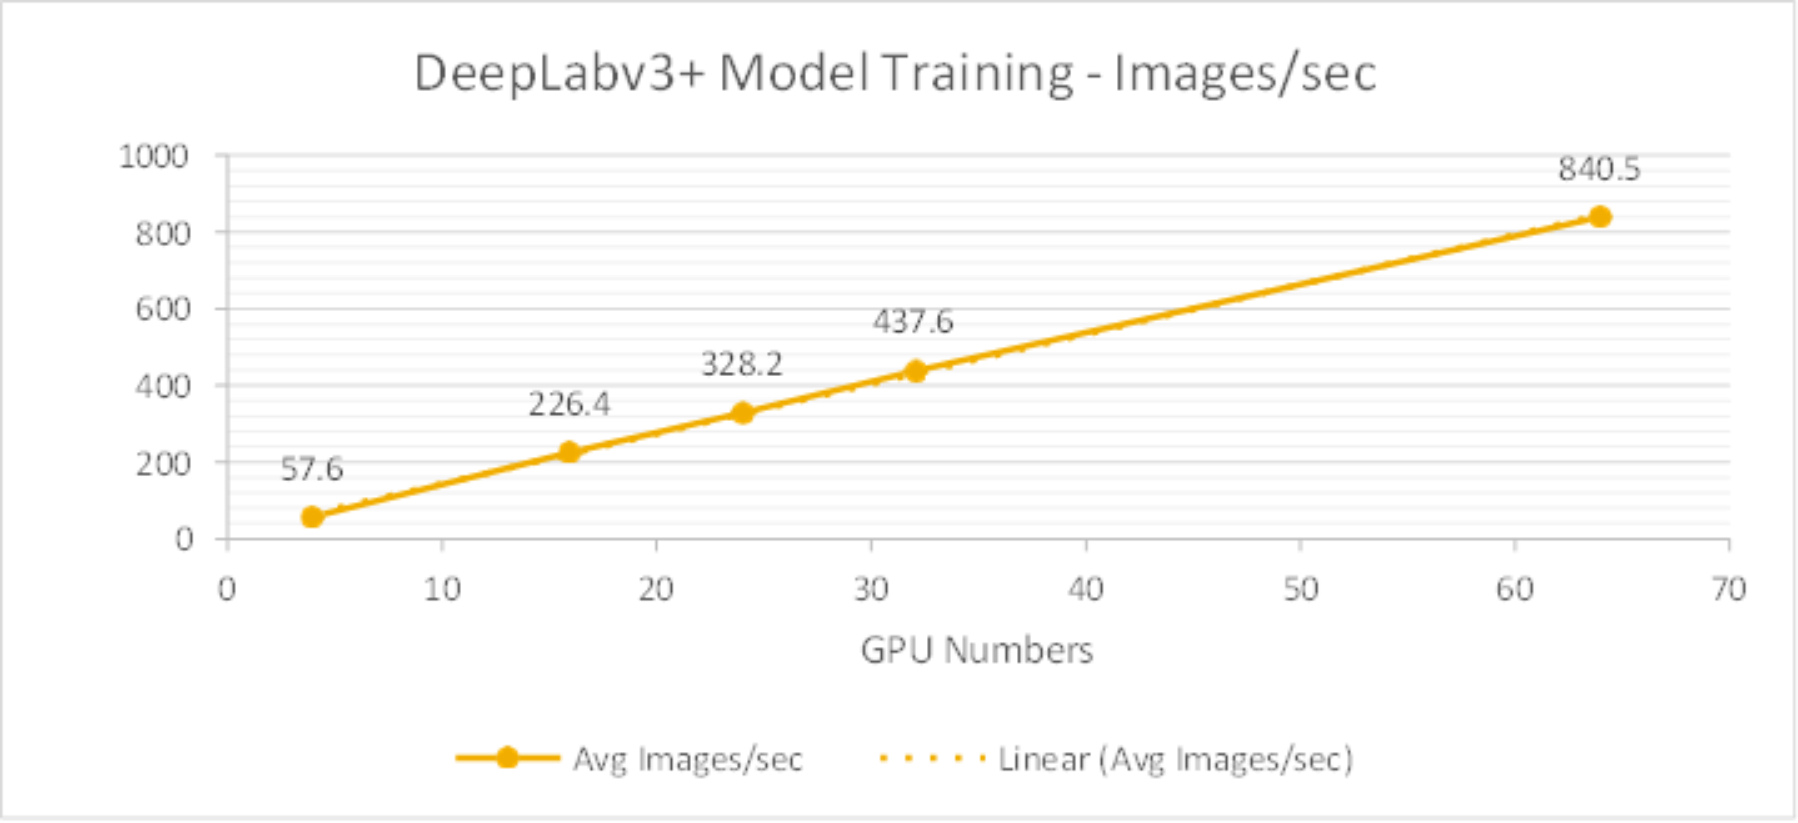
Figure 12. DeepLabv3+ Model Training Benchmark – Images/sec from 4GPUs to 64GPUs
Training time and system metrics
SSD model
Table 4 lists the test results about the SSD model training time and bandwidth for 1st epoch. As shown in Figure 13, the average throughput scale linearly from 4 to 64 GPUs and reduced training time as well.
Table 4. SSD Training Time and Training Bandwidth for each epoch with 3TB dataset
GPU
Numbers
Average Training Time for each epoch
Average Training Bandwidth for 1st epoch
Peak Training Bandwidth for 1st epoch
4
42 minutes 47 seconds
858 MB/s
990 MB/s
16
11 minutes 50 seconds
2,904 MB/s
4,503 MB/s
32
6 minutes 40 seconds
4,664 MB/s
6,530 MB/s
64
4 minutes 25 seconds
7,489 MB/s
10,017 MB/s
Table 5 lists the system metrics during the training. This indicates that the GPUs were fully utilized by leveraging the NVIDIA DALI library.
Table 5. SSD Model Training System Metrics
System metrics
Percentage
Average GPU utilization
96%
Average GPU memory utilization
42%
Average compute node CPU utilization
63%
Average compute node memory utilization
91%
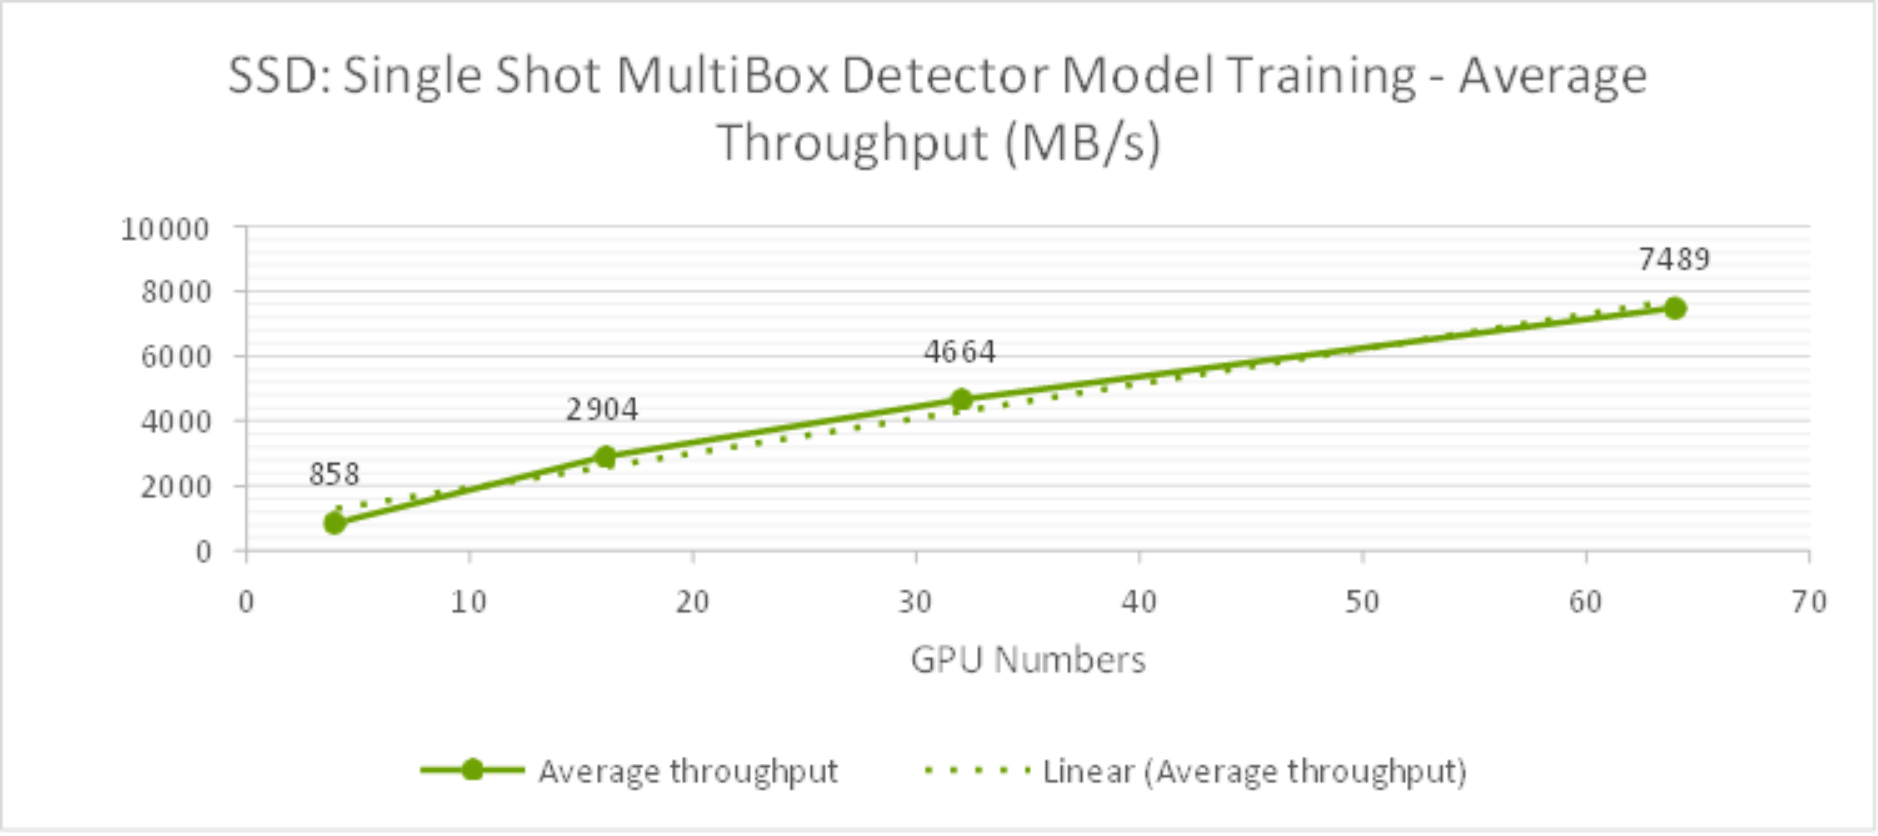
Figure 13. SSD Model Training Average Bandwidth (MB/s) from 4GPUs to 64GPUs
As shown in the Figure 14, during the training time, the peak storage throughput reached over 10GB/s with 64 GPUs. It was observed that the training is a heavily read intensive workload as it need to read entire dataset from storage for training. For storage configuration considerations, it is crucial to plan sizing for peak throughput on Isilon F800 storage during the training in order to minimize training times as required for the development business needs.
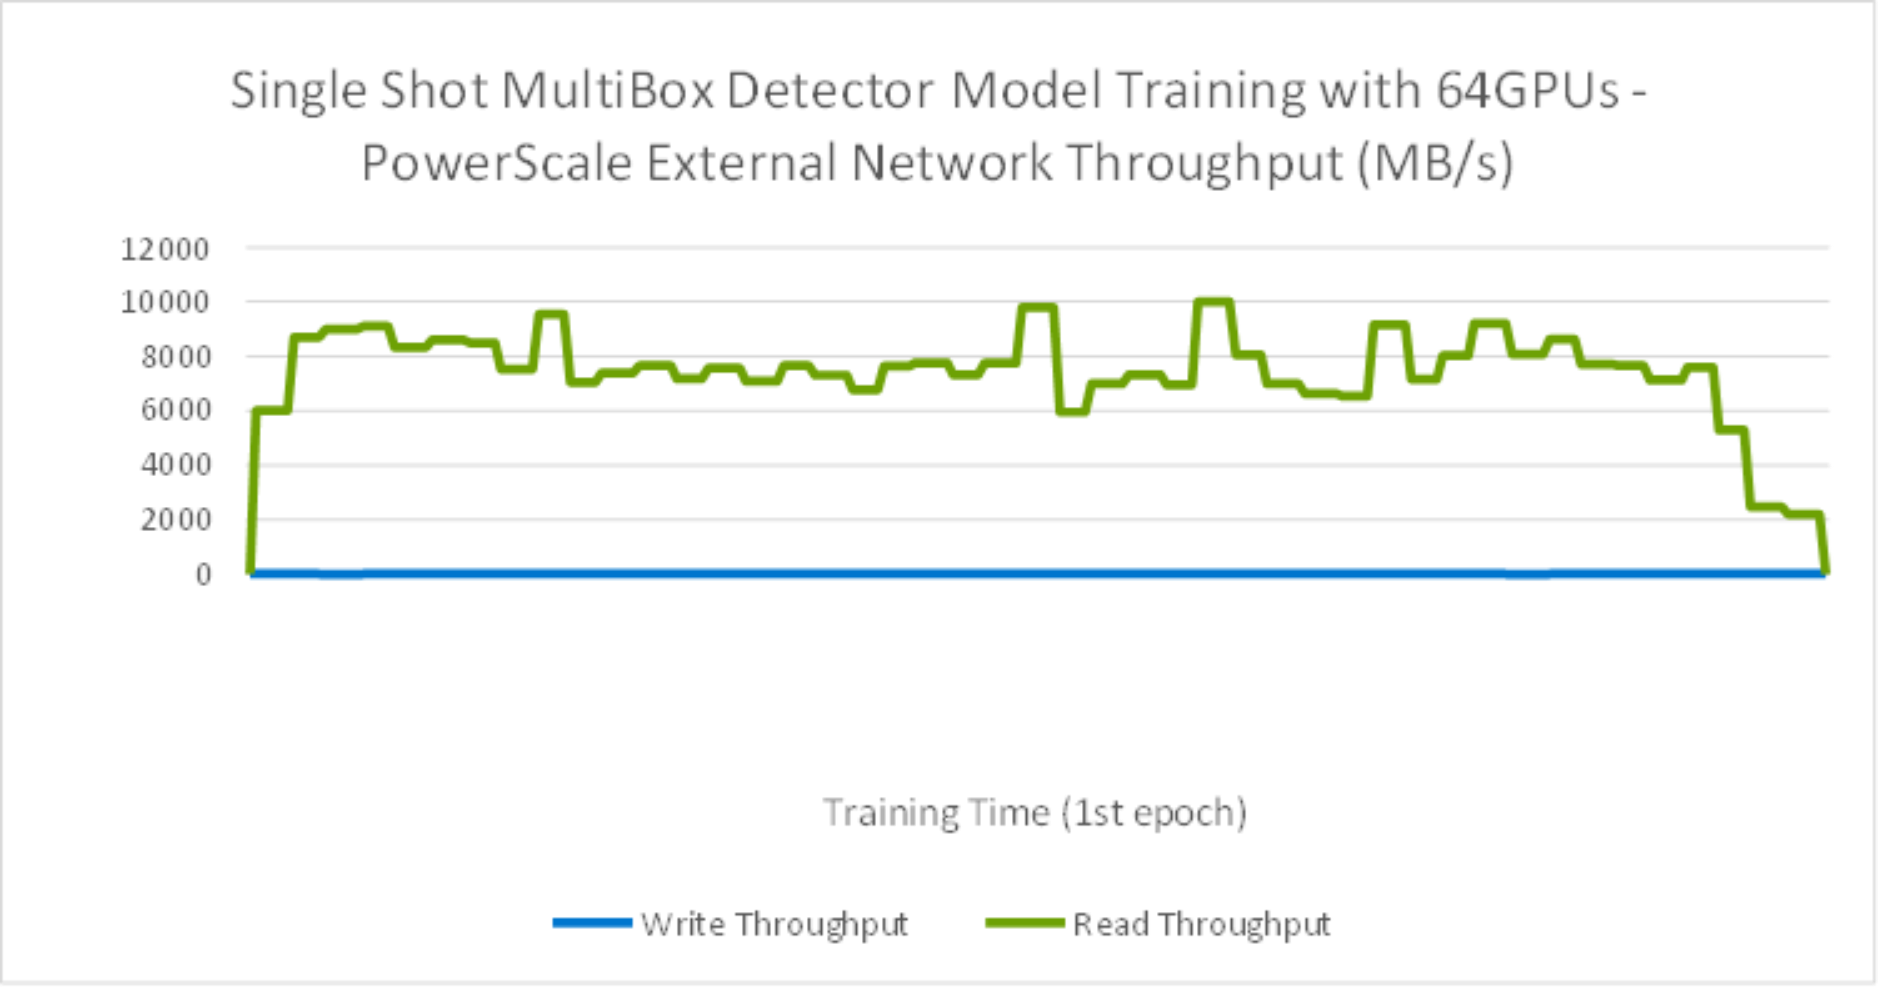
Figure 14. SSD Model Training with 64GPU storage throughput
As shown in the Figure 15, during the training time, GPUs are fully utilized.
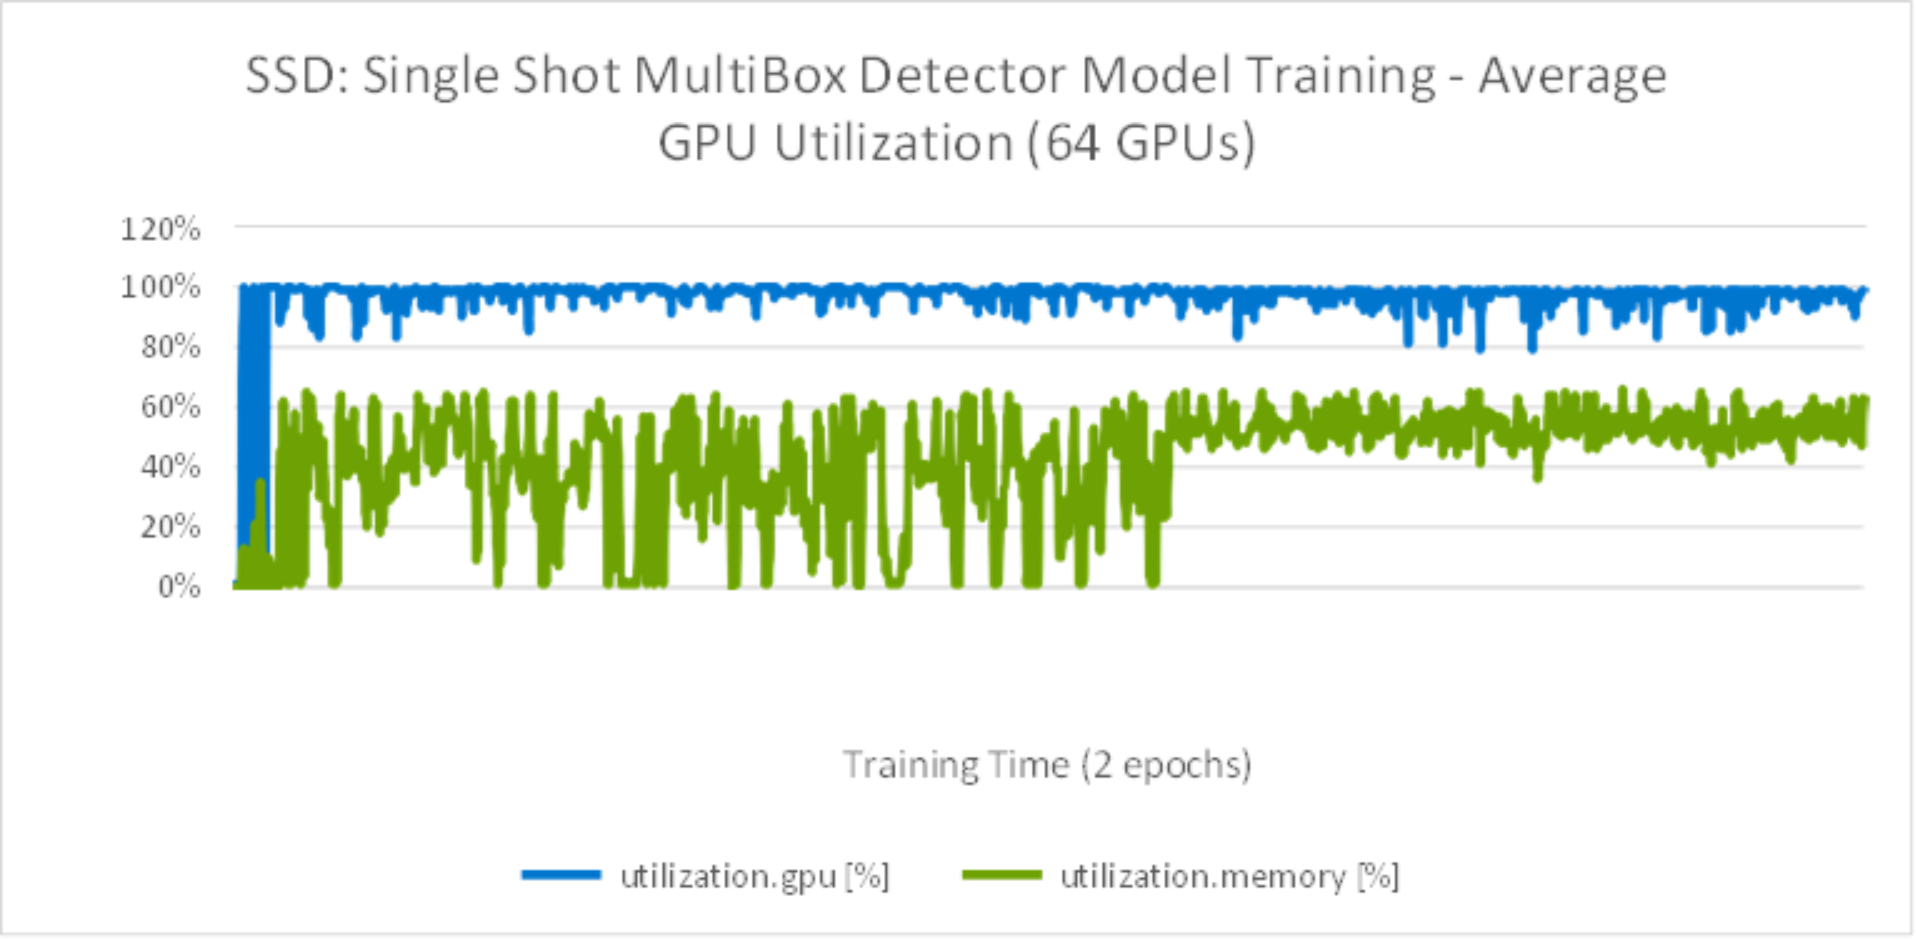
Figure 15. SSD Model Training with average 64GPU utilization
DeepLabv3+ model
Table 6 lists the test results about the DeepLabv3+ model training time and bandwidth for 1st epoch. As shown in Figure 16, the average throughput scaled linearly from 4 to 64 GPUs and reduced training time as well.
Table 6. DeepLabv3+ Training Time and Training Bandwidth for each epoch with 5TB dataset
GPU
Numbers
Training Time for each epoch
Average Training Bandwidth for 1st epoch
Peak Training Bandwidth for 1st epoch
4
7 hours 59 minutes
140.15 MB/s
450 MB/s
16
2 hours 1 minute
497.69 MB/s
920 MB/s
24
1 hour 24 minutes
726.19 MB/s
1,607 MB/s
32
1 hour 3 minutes
964.03 MB/s
2,262 MB/s
64
38 minutes
1741.04 MB/s
3,018 MB/s
Table 7 lists the system metrics during the training. This indicates that the GPUs were fully utilized by leverage NVIDIA DALI library.
Table 7. DeepLabv3+ Model Training System Metrics
System metrics
Percentage
Average GPU utilization
91%
Average GPU memory utilization
41%
Average compute node CPU utilization
23.7%
Average compute node memory utilization
99%
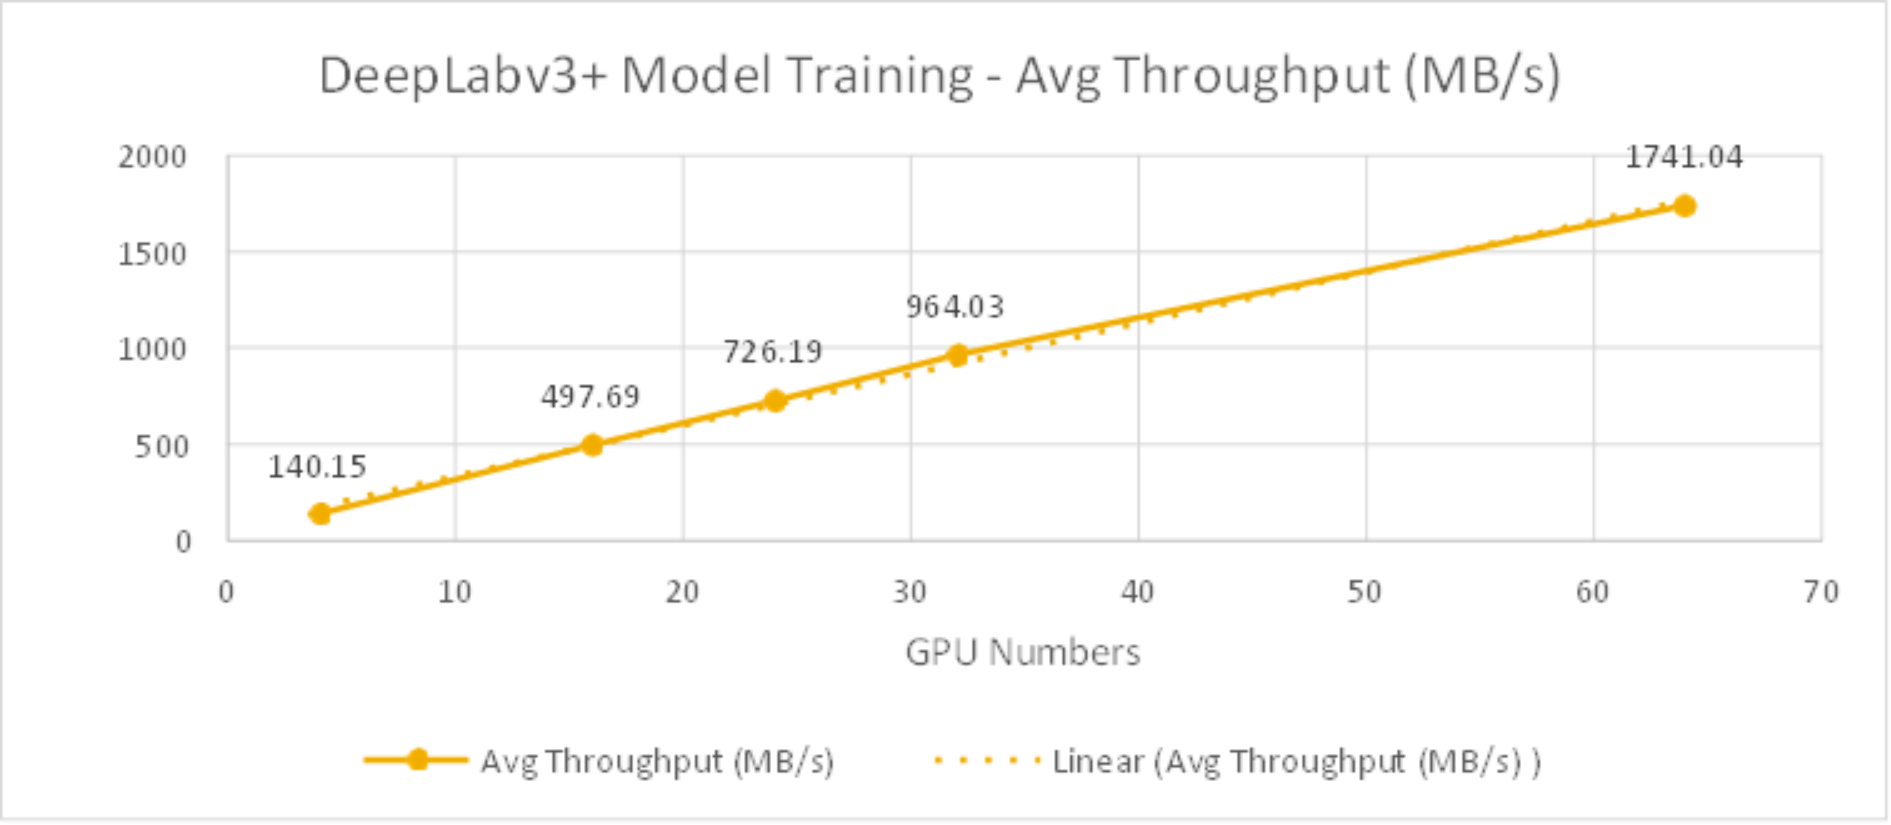
Figure 16. DeepLabv3+ Model Training Bandwidth (MB/s) from 4GPUs to 64GPUs
As shown in the Figure 17, during the training time, the peak storage throughput reached to over 2.2GB/s with read intensive.
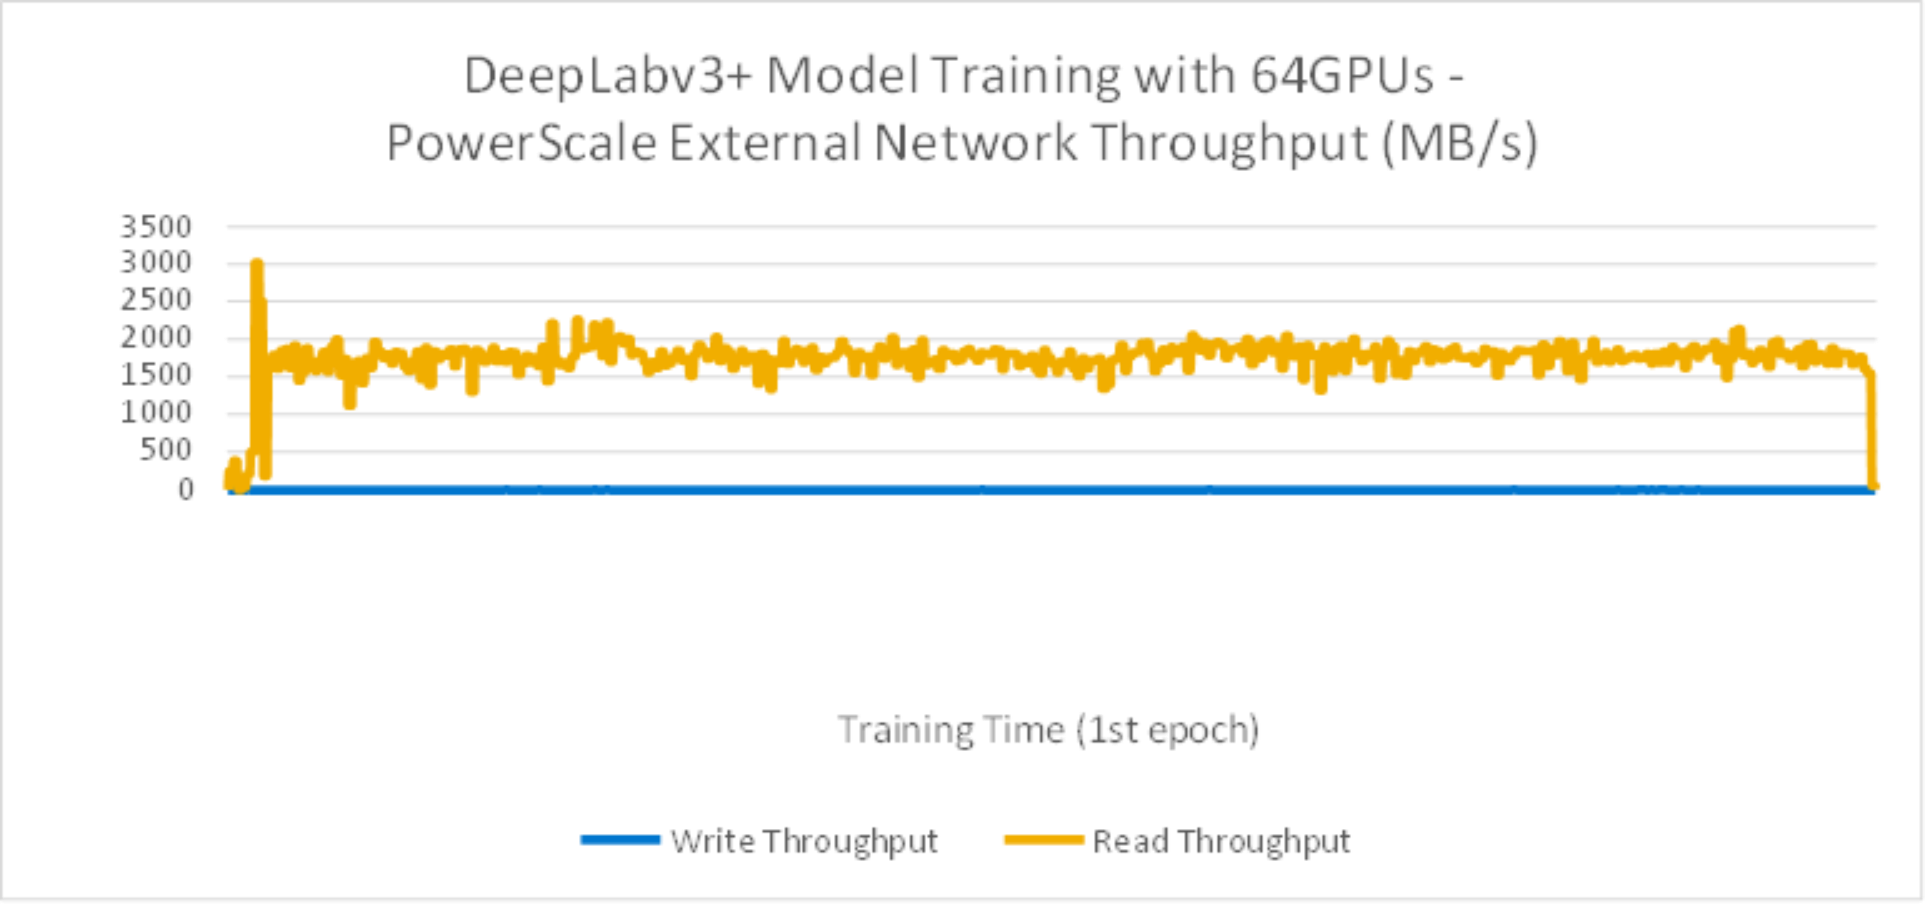
Figure 17. DeepLabv3+ Model Training with 64GPU storage throughput
From Figure 18 test results, during the training time, GPUs are fully utilized.
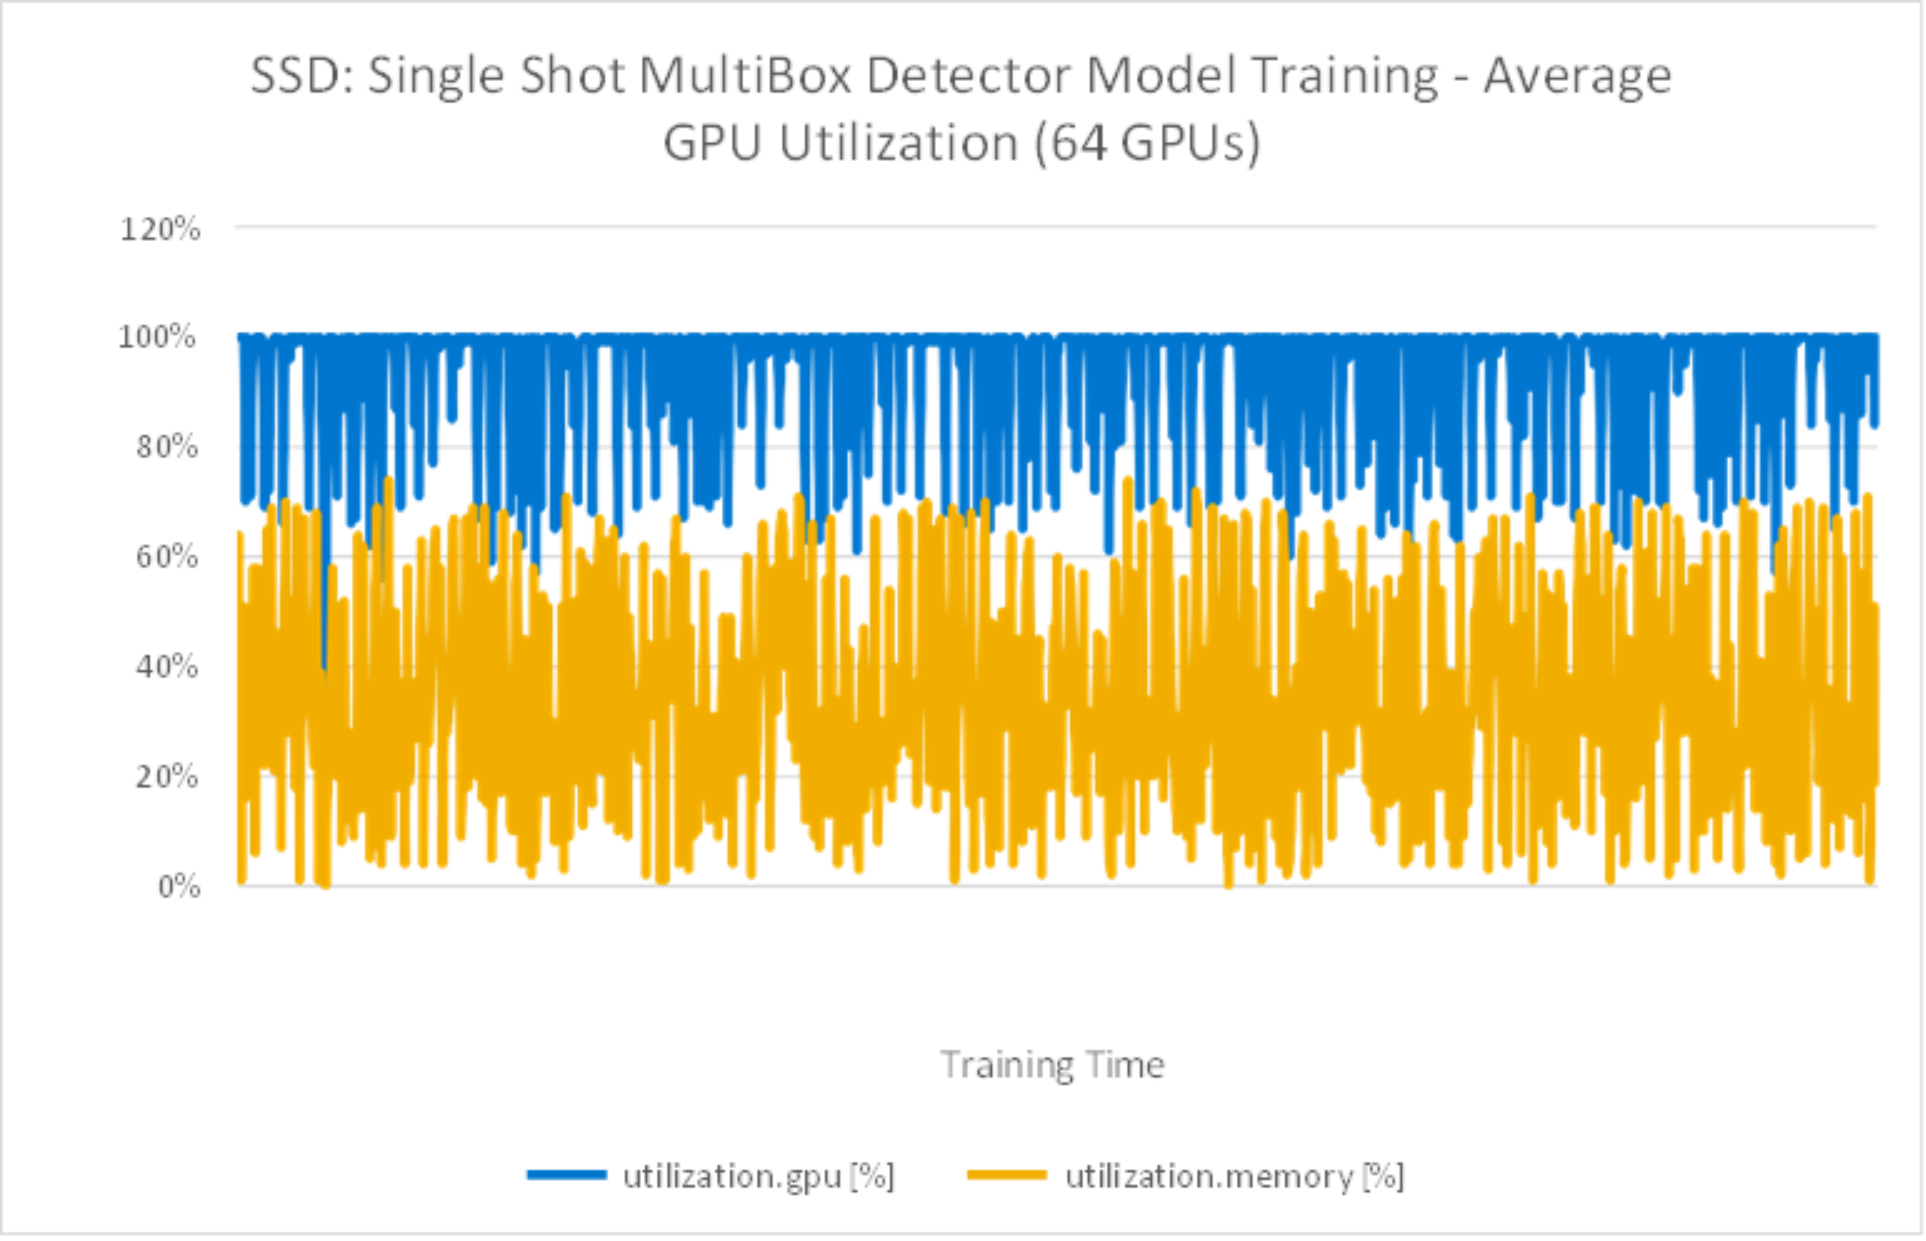
Figure 18. DeepLabv3+ Model Training with average 64GPU utilization
Image throughput with multiple epochs
We also ran SSD model training with multiple epochs to compare and contrast. Figure 19 compares test results by running 1 epoch versus multiple epochs. It is obvious that running 1 epoch or multiple epochs had no difference on the image/sec performance results.
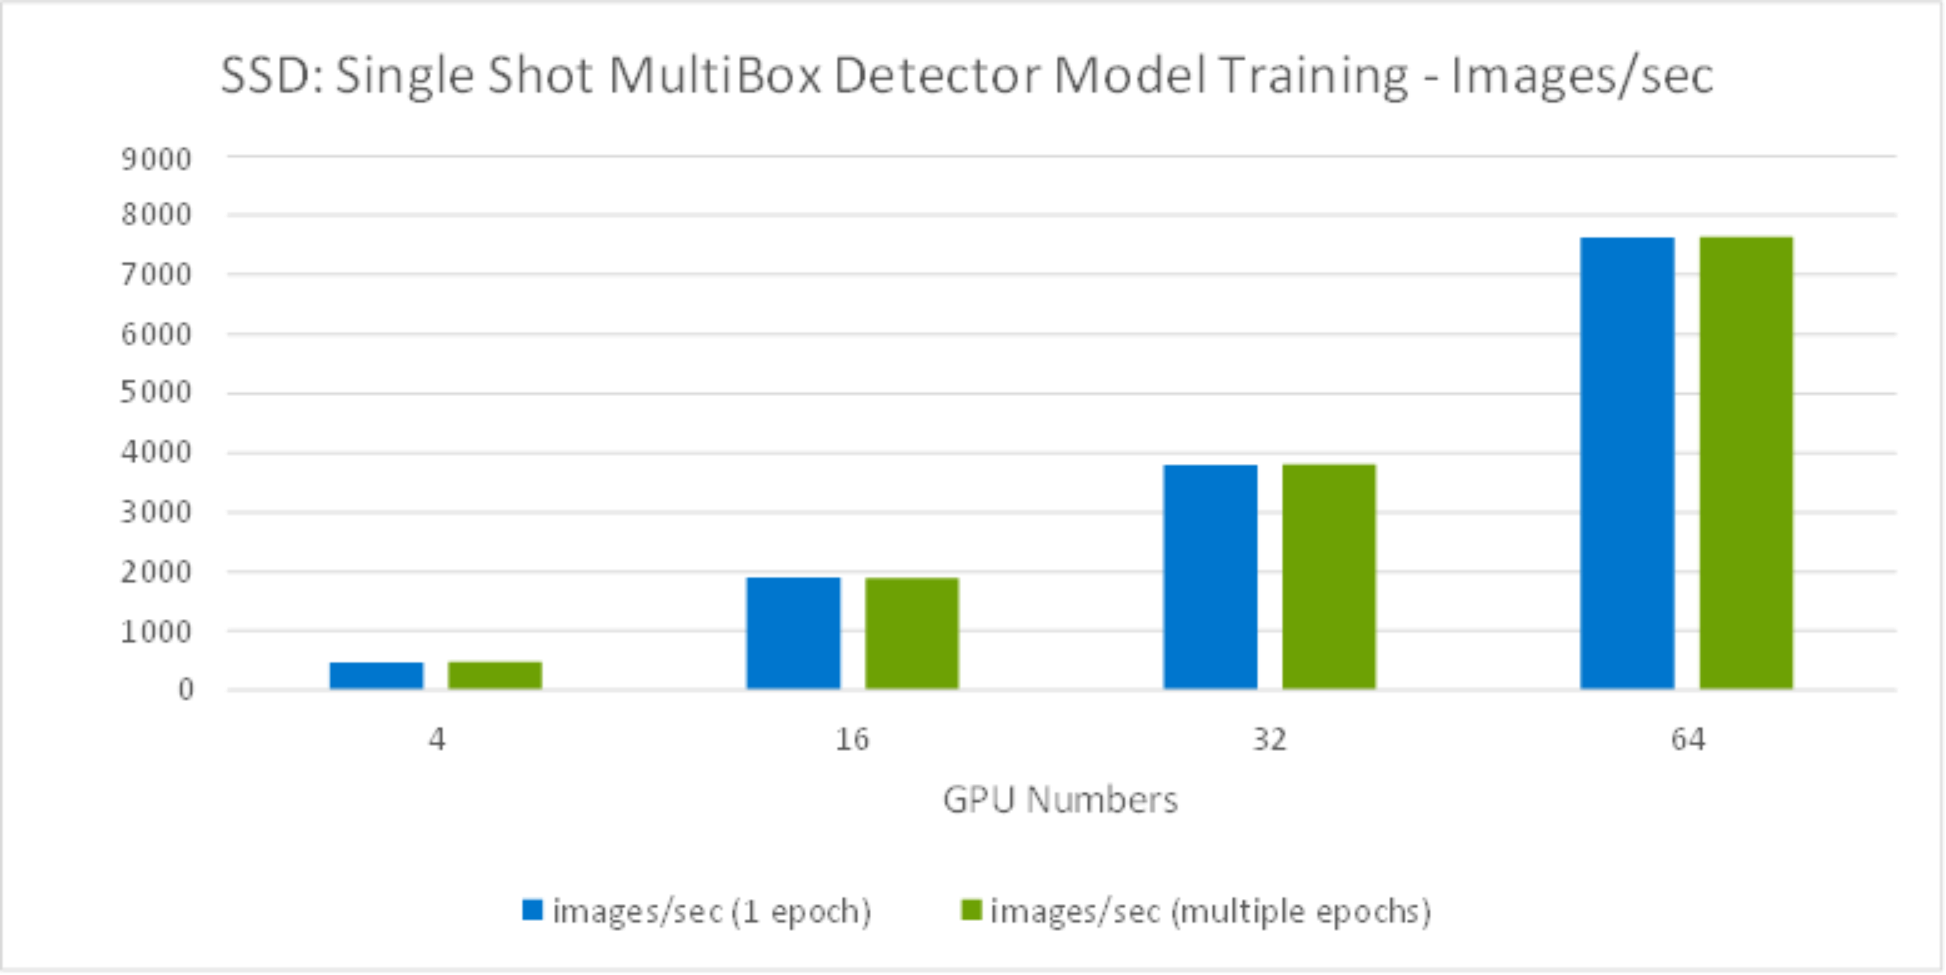
Figure 19. SSD Model training Images throughput comparison
Meanwhile, we observed the storage throughput dropped while running more than 32GPUs, as shown in Figure 20. This was because the dataset is only 3TB, while running more than 32GPUs with 8 compute nodes, the server cache exceeded the total dataset, enabling some of the data to cached on the server side - which reduced the storage throughput required during the training.
For training, the system memory is consumed by the following critical variables: parameters - including weights and bias, gradients, input data and intermediate data. Among them, the intermediate data is the most memory demanding. The intermediate data includes the workspace and feature map. The workspace is the memory consumed by the DL framework and varies with each framework developers choose. The feature map, sitting in the middle of two neighbor layers of a CNN model, is generated by one layer, and used as input to the next layer. With more system memory, it gives more cache for intermediate data which will reduce the storage throughput requirement during the training.
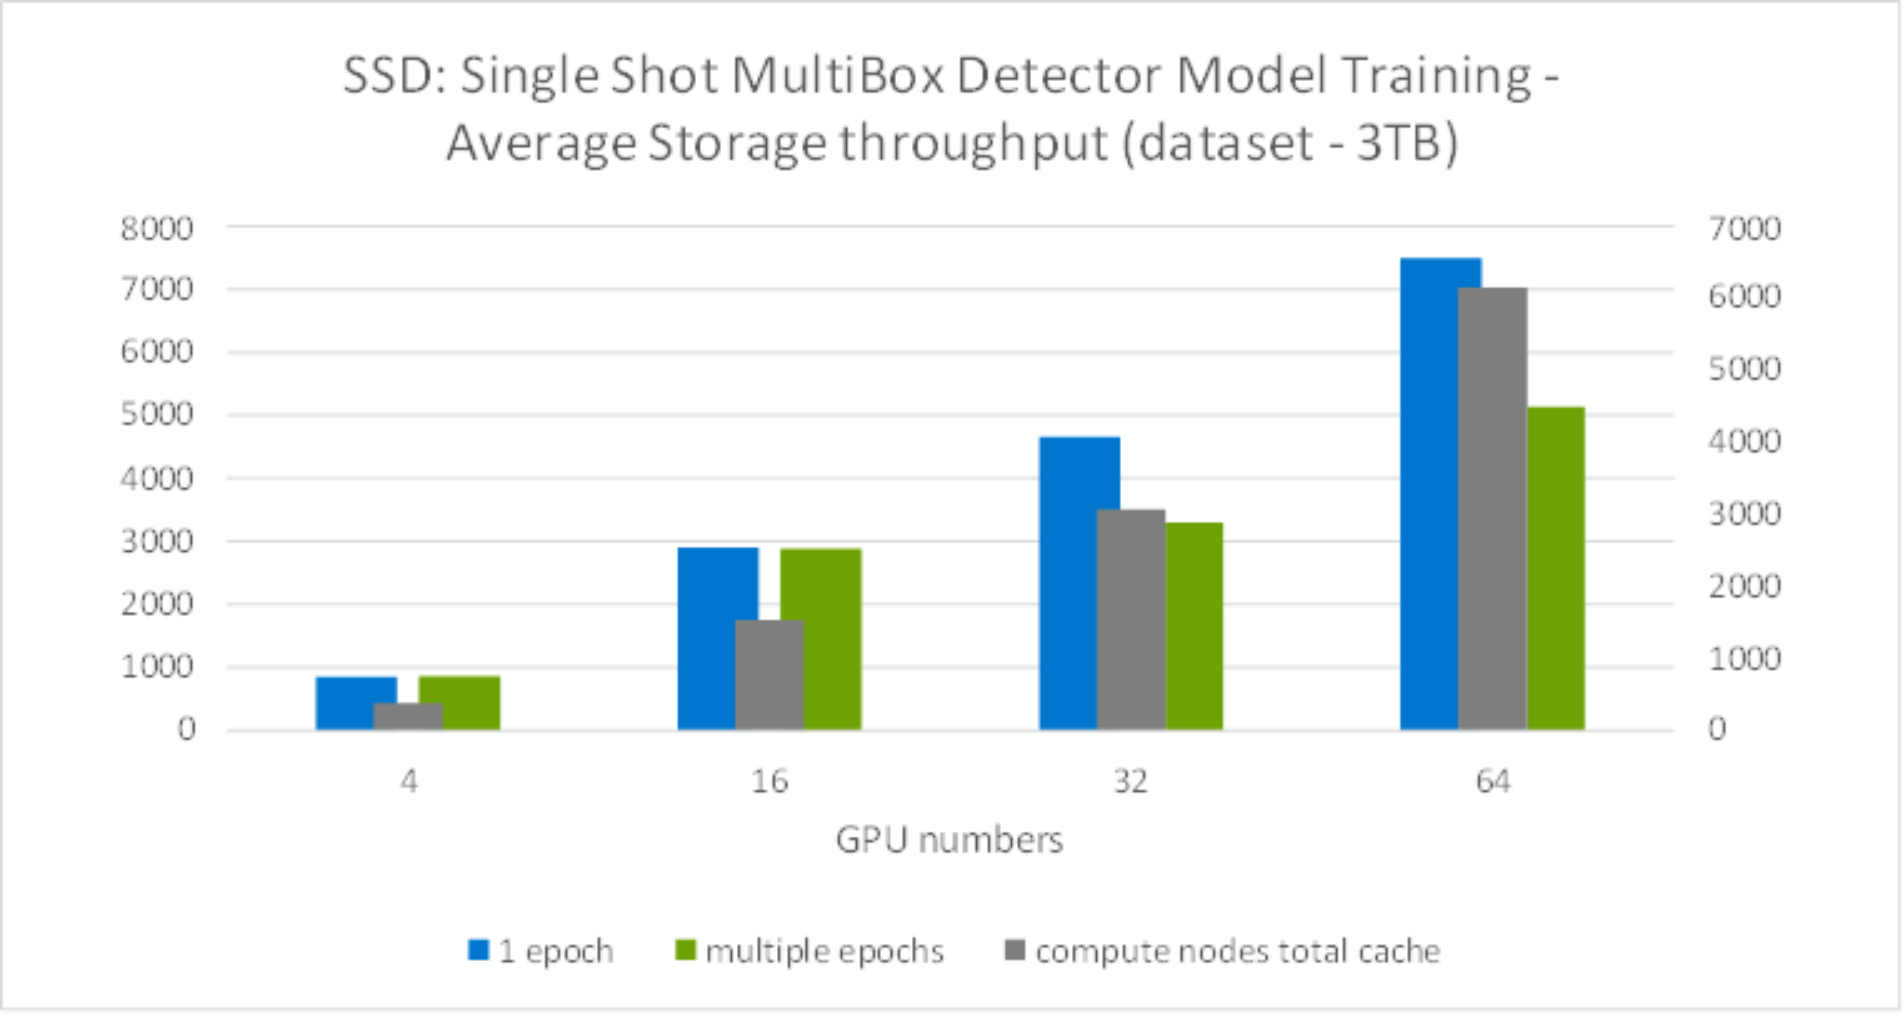
Figure 20. Model training storage throughput comparison