
Presentation and database layers
Presentation and database layers
-
The following figure shows the production and DR site components, with remote sites containing Collector servers that are not subject to disaster recovery:
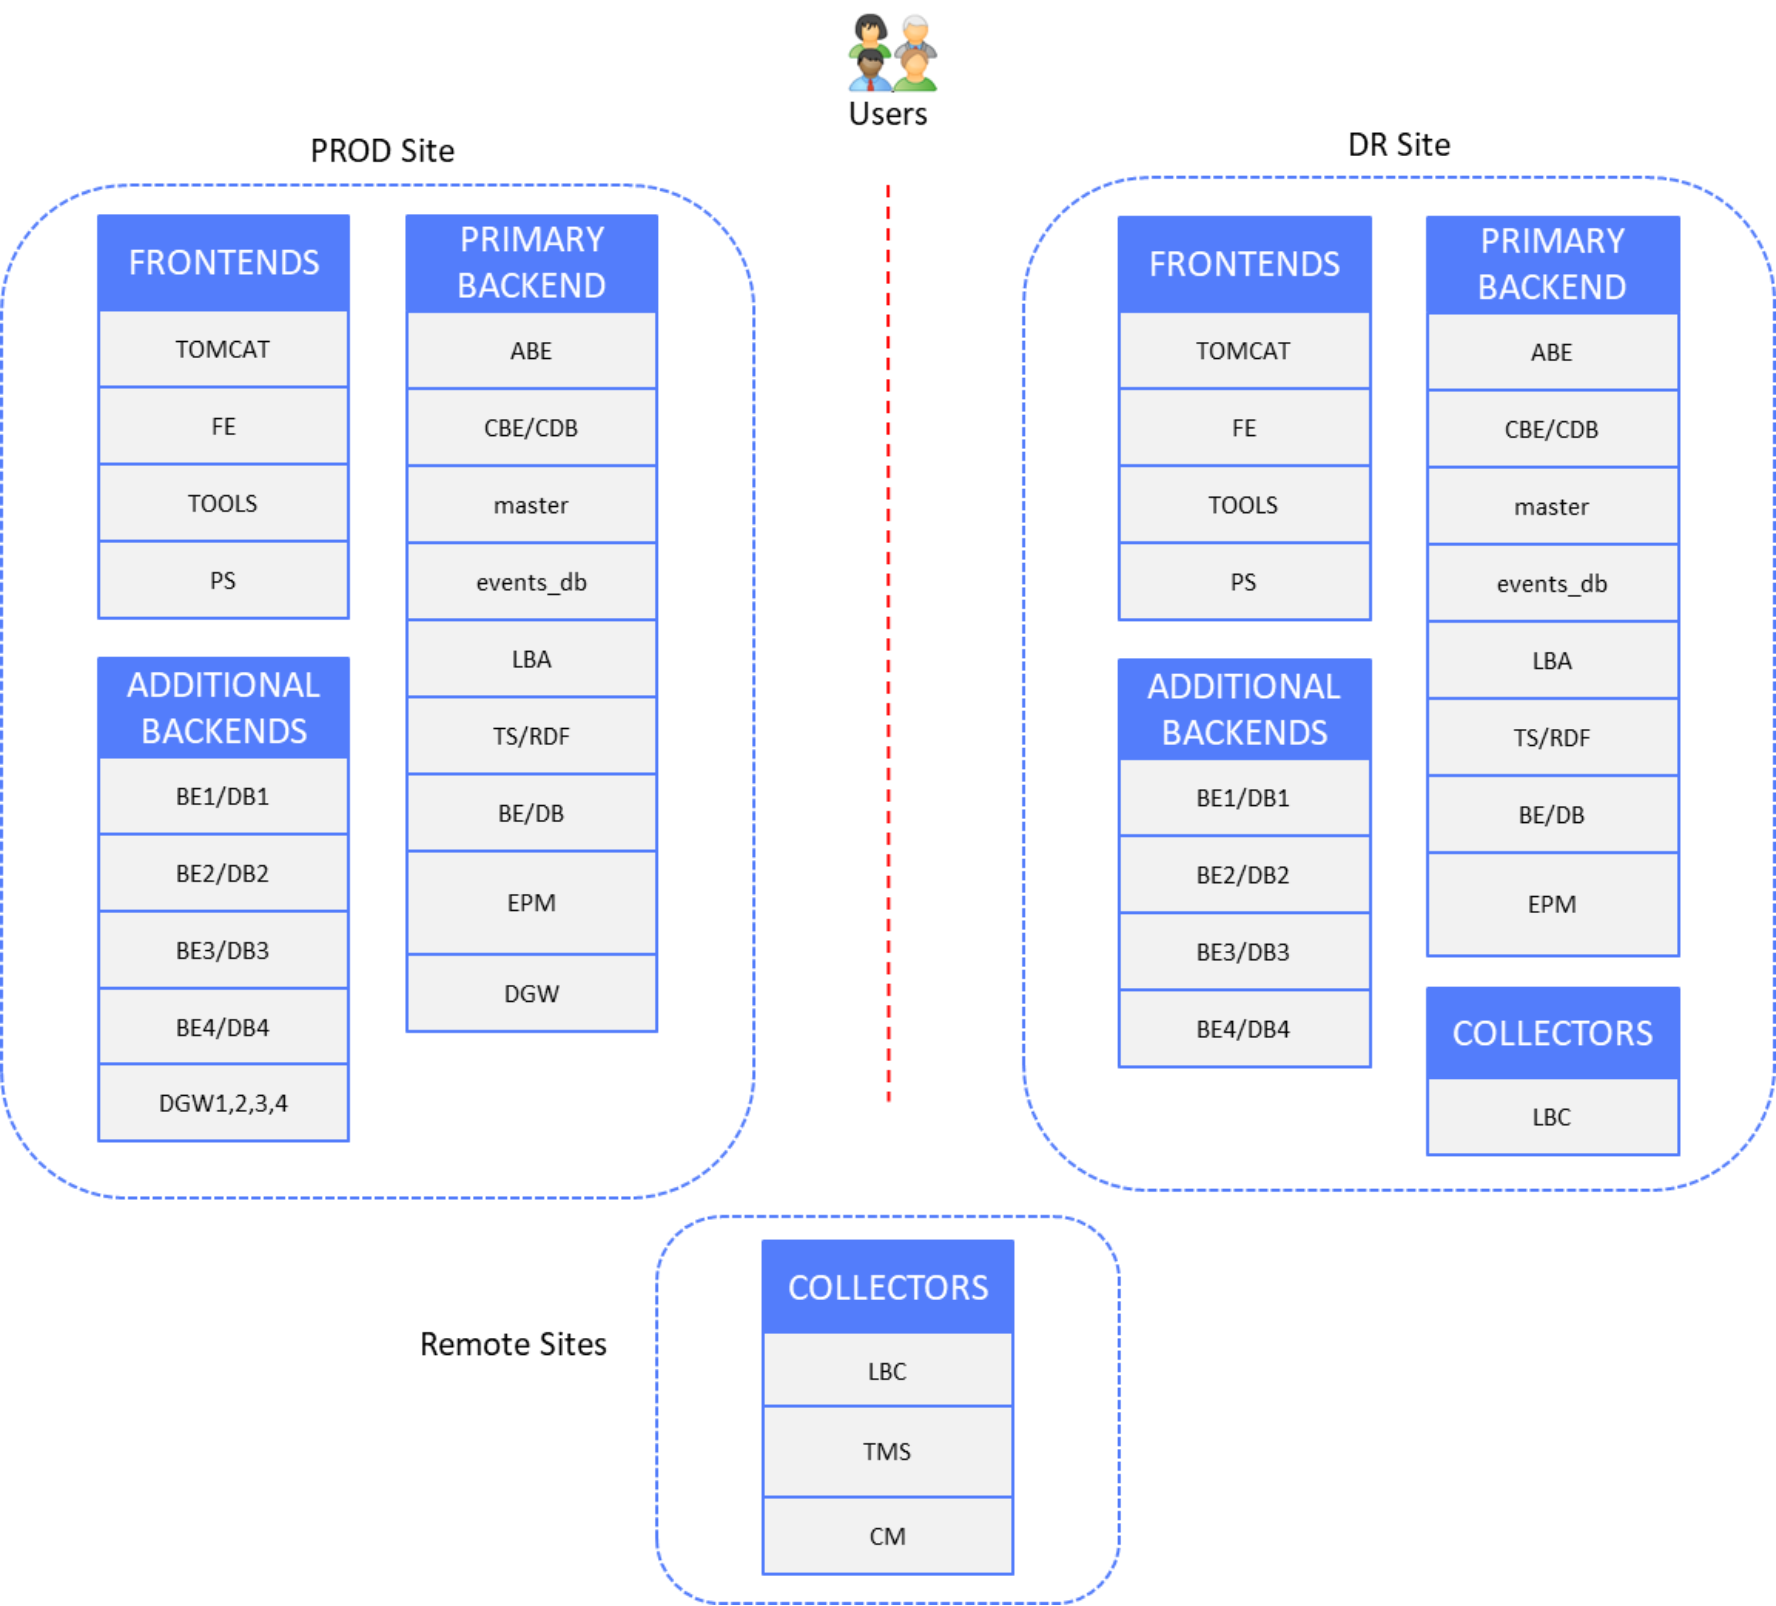
Figure 25. Presentation and database layers DR
DR solutions are shown per datatype to simplify diagrams and configuration examples.
Time-series and alerts data
The following figure shows the time-series and alerts data components:
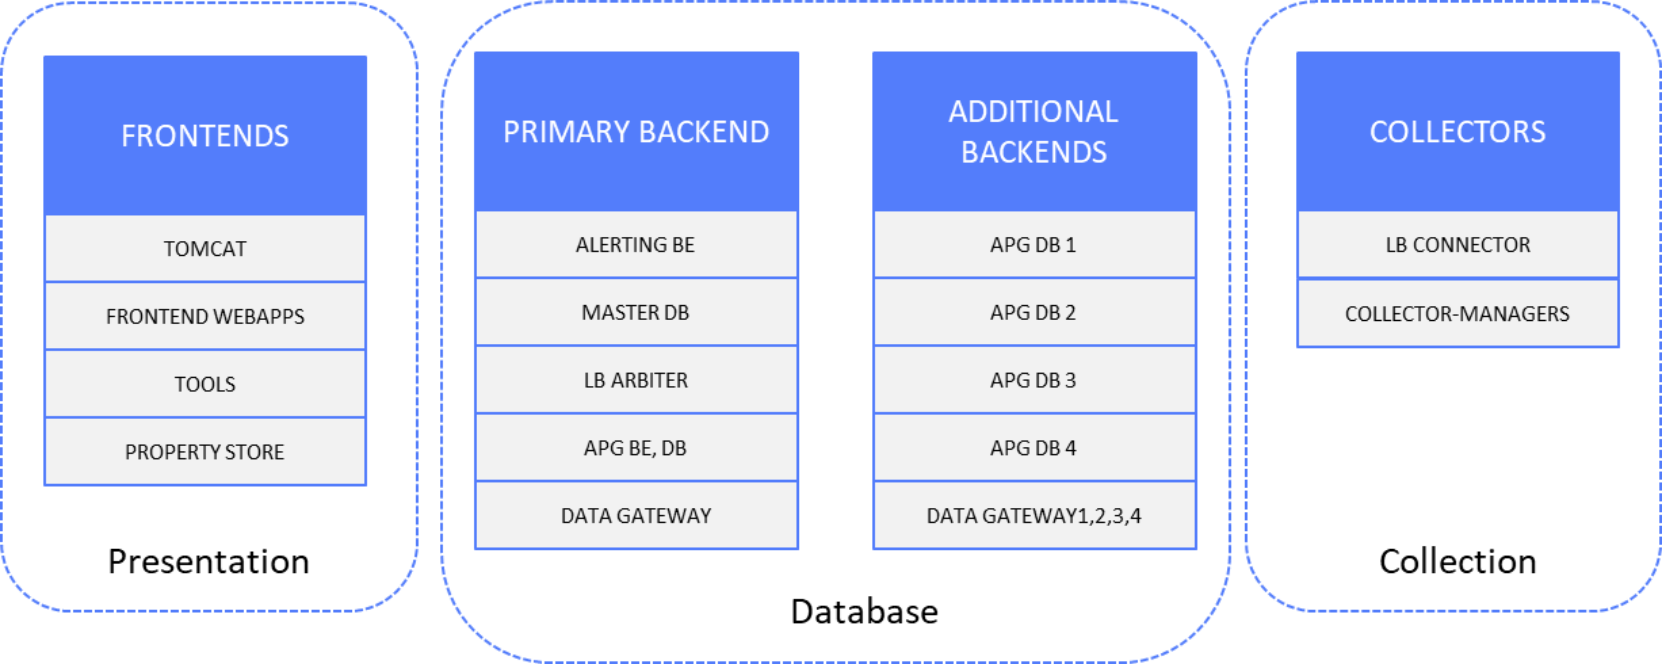
Figure 26. Time-series and alerts data solution components
Setup
In following “normal operation” scenario of production site, end users are connected to PROD site frontend servers. DR site components are in standby mode (stopped) except Primary and Additional Backend server components, which are in active mode.
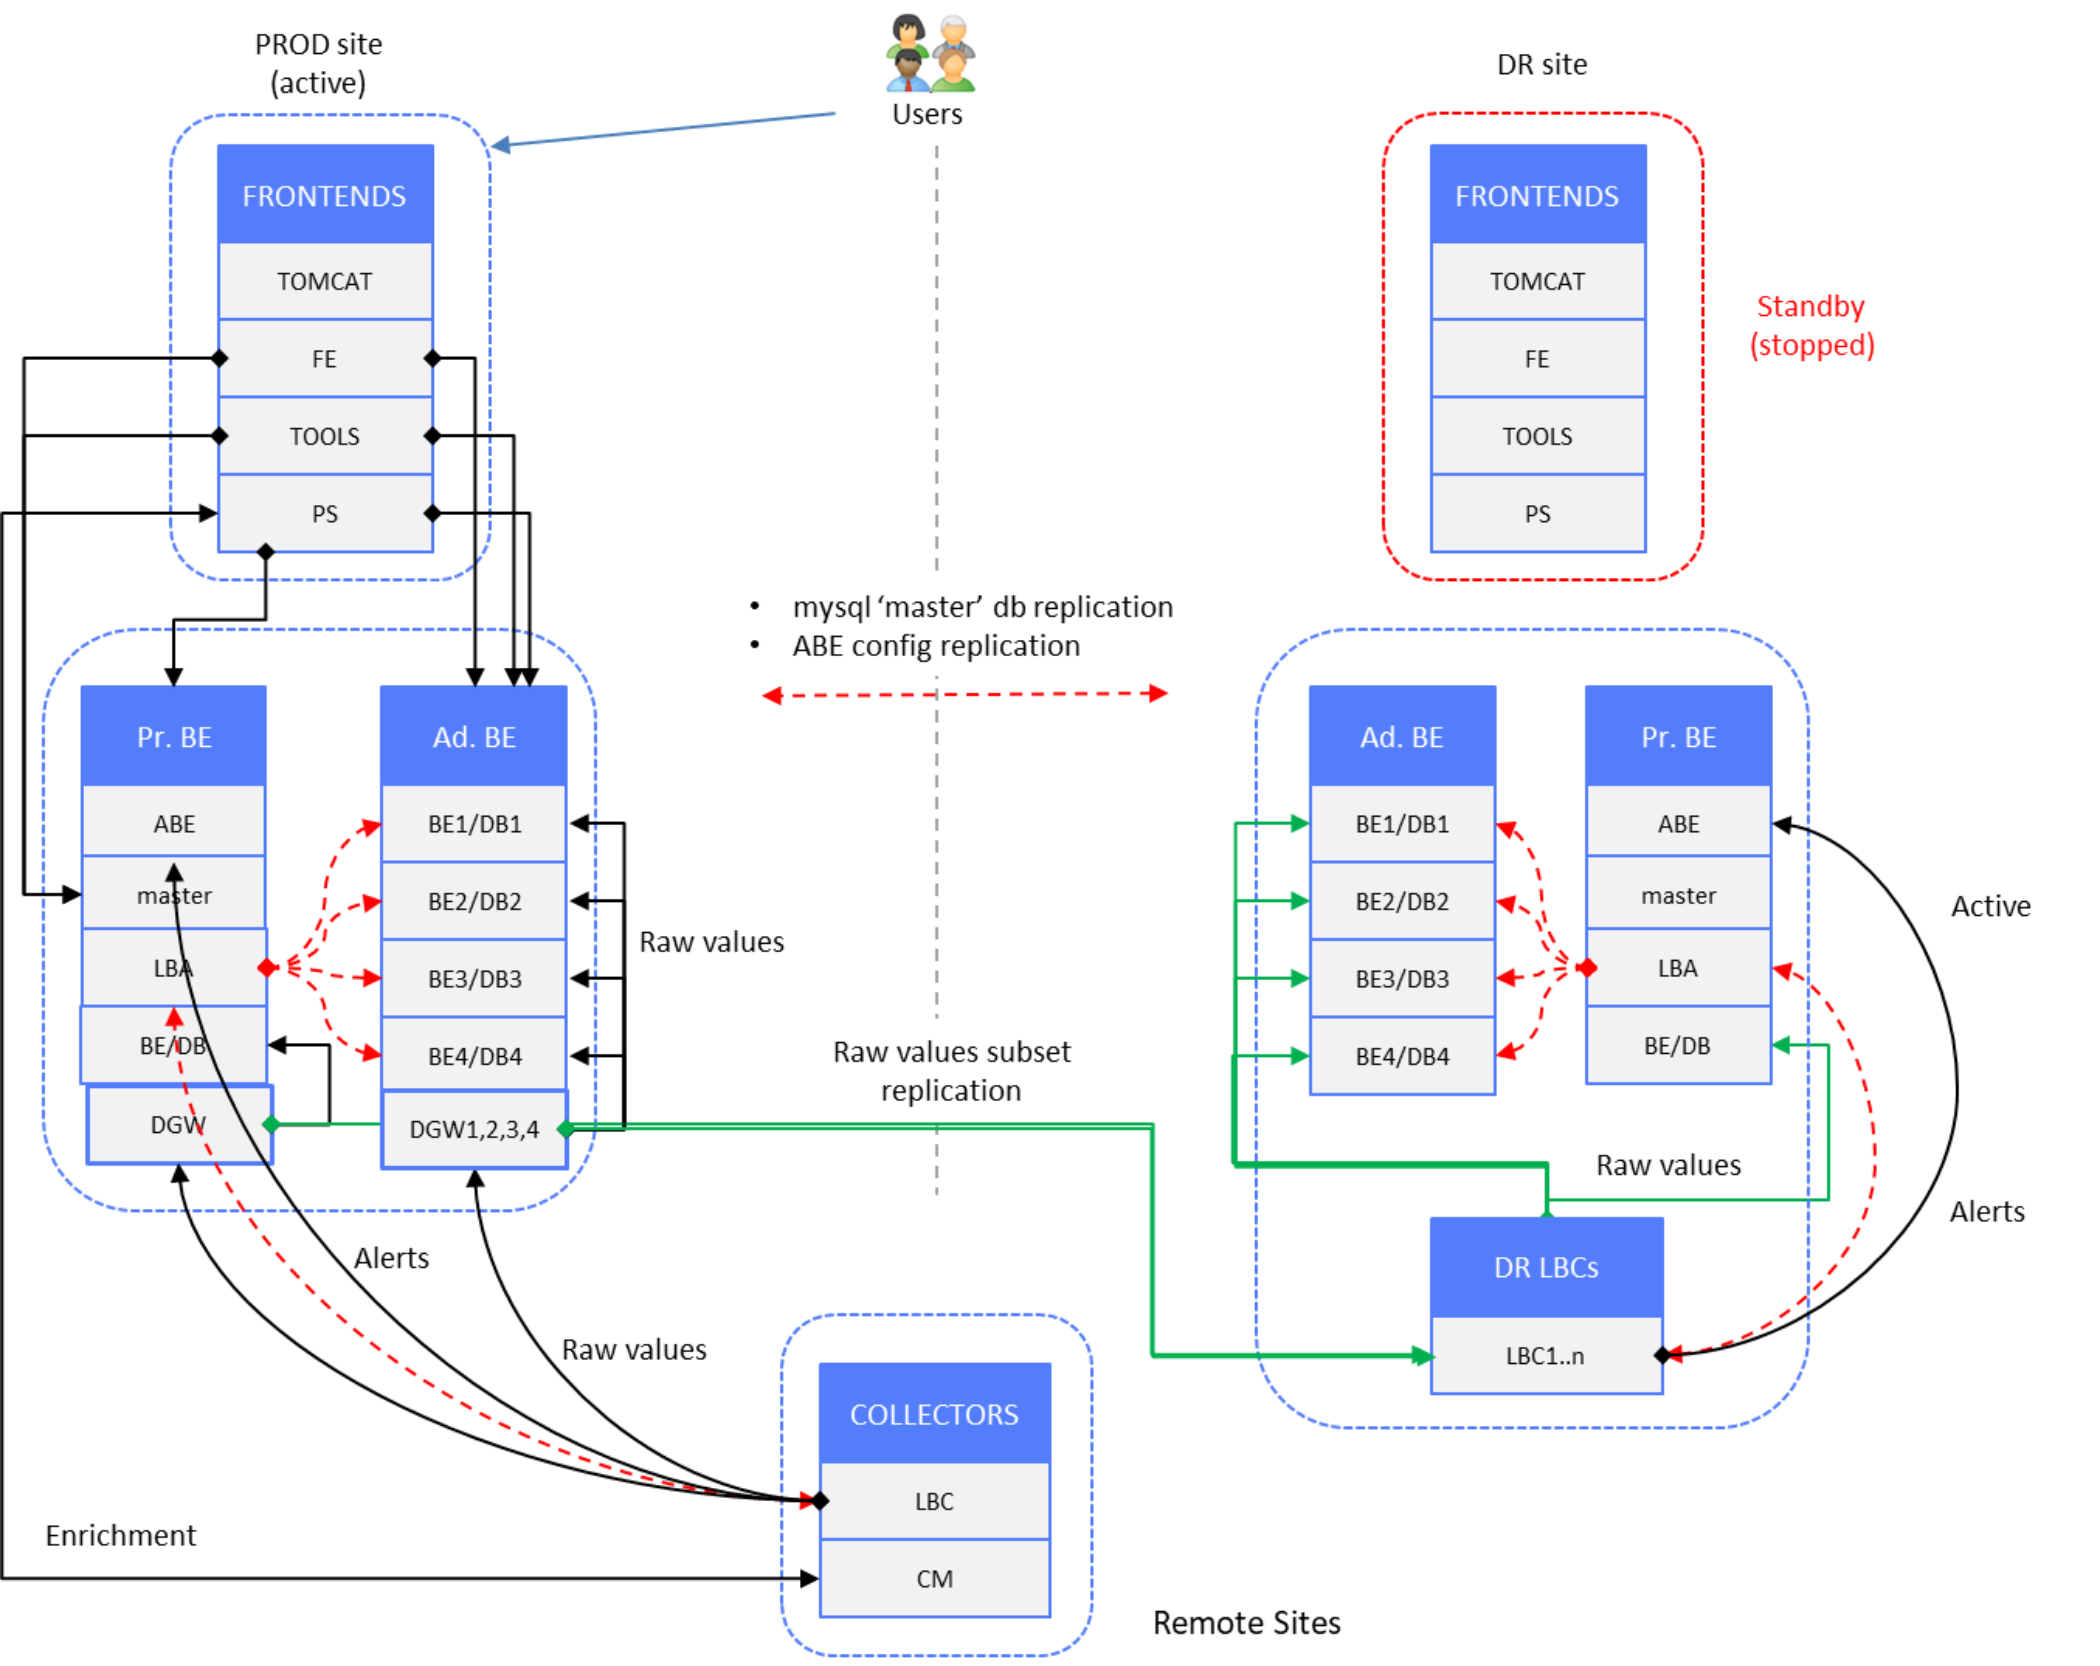
Figure 27. Time-series and alerts data – PROD site active, DR site backends active
Data redundancy is achieved by splitting the raw data stream at the backend layer.
LBAs on PROD and DR site PBE servers have a different set of backend/database instances declared. There are fewer Additional Backend servers on the DR site. We are targeting a maximum 6M metrics per Additional Backend server—that is, 1.5M metrics per database instance.
If new Additional Backend servers are deployed, with new backend/database instances, the LBA configuration on PROD site must be updated. If backends on the DR site are close to the limit (that is, if the number of metrics per Additional Backend server is 6M), a new Additional Backend on the DR site is deployed and the DR site LBA is updated. Then a reconstruction script is run (see Data restore).
Backend listening ports remain default ones in LBA (2000, 2100, 2200, 2300, 2400). Here is an example of the LBA reconfiguration UI for the PROD PBE backend:
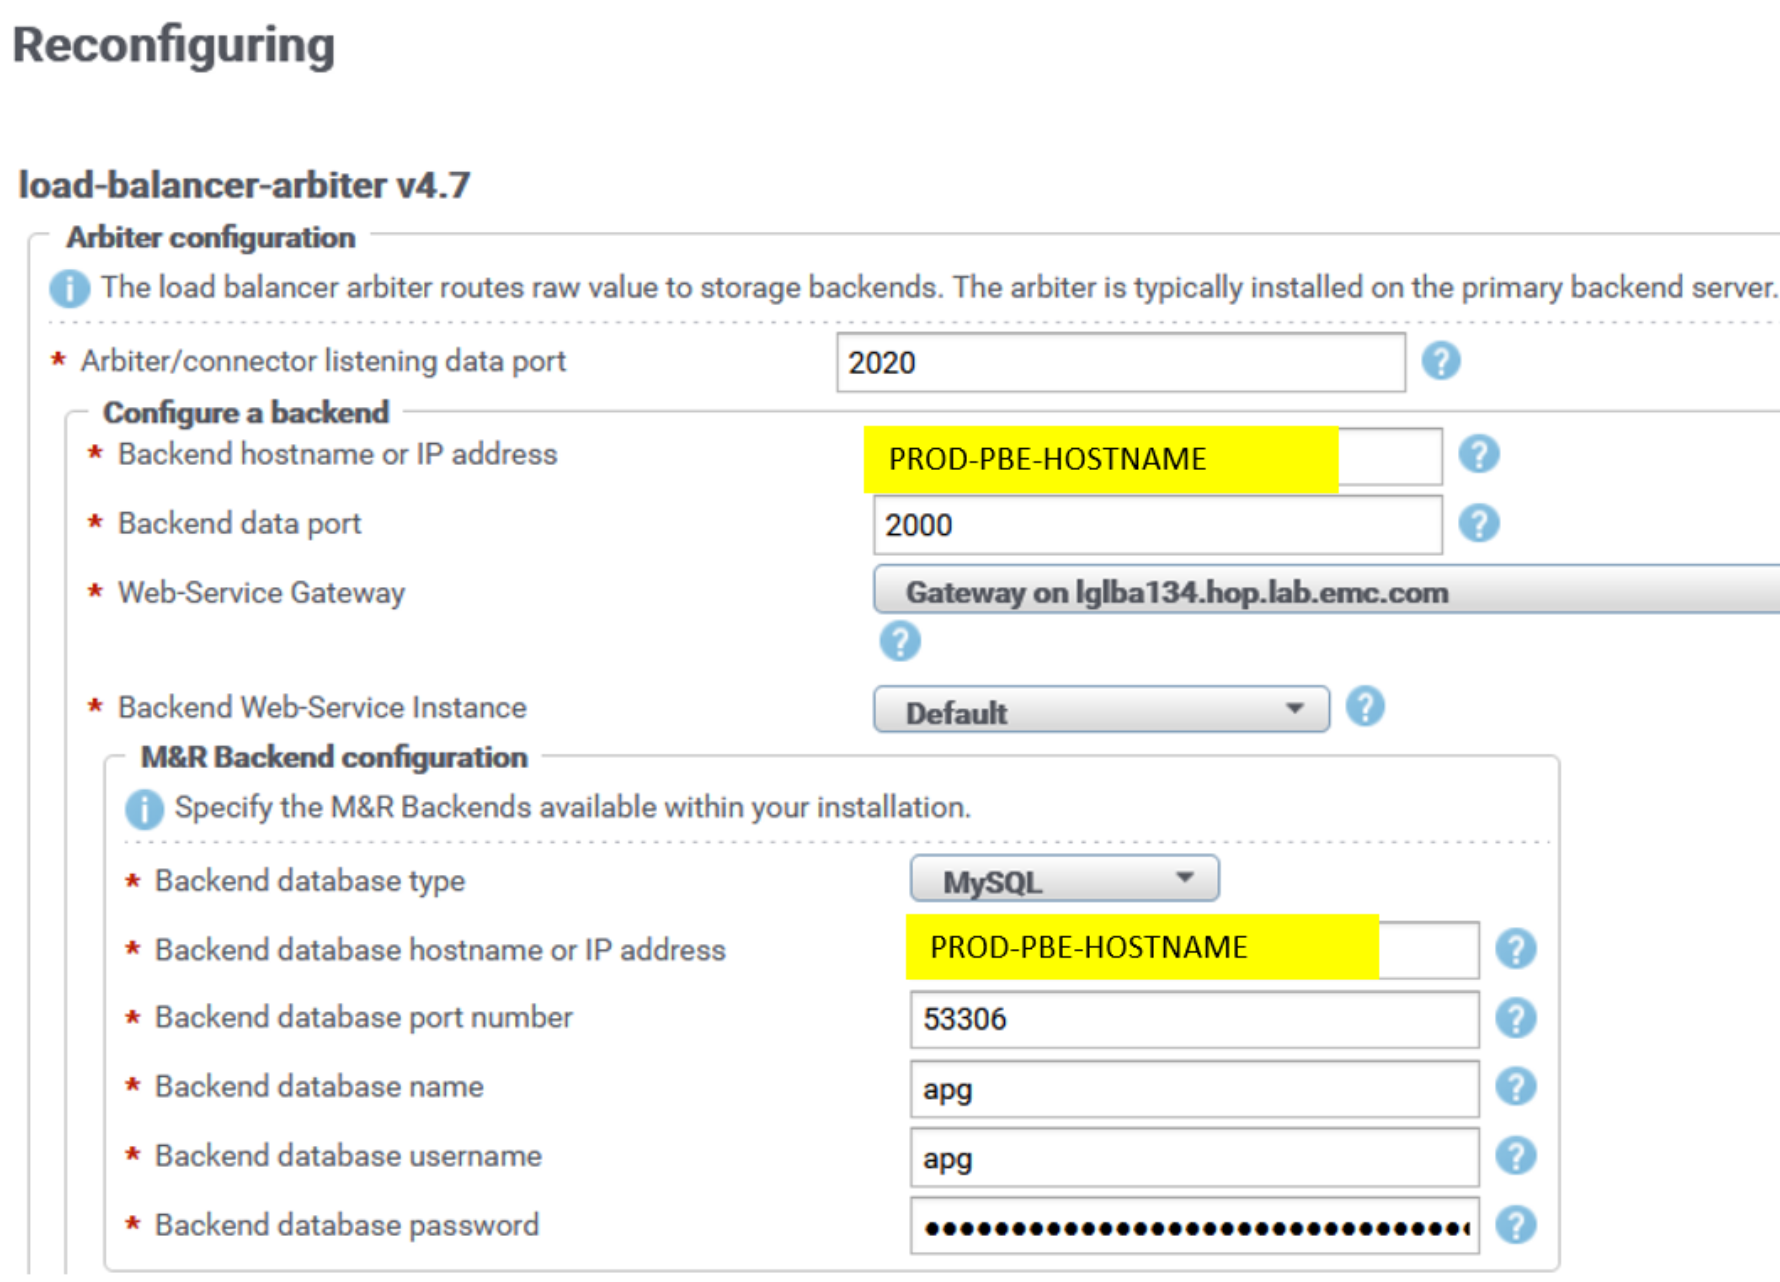
Figure 28. LBA reconfiguration UI
Backend (BE) listening ports on PROD PBE and PROD Additional Backend servers are changed from default ones (2000, 2100, 2200, 2300, 2400) to the new ones (3000, 3100, 3200, 3300, 3400).
Here is sample reconfiguration UI for backend instance apg2 on one of the PROD Additional Backends:
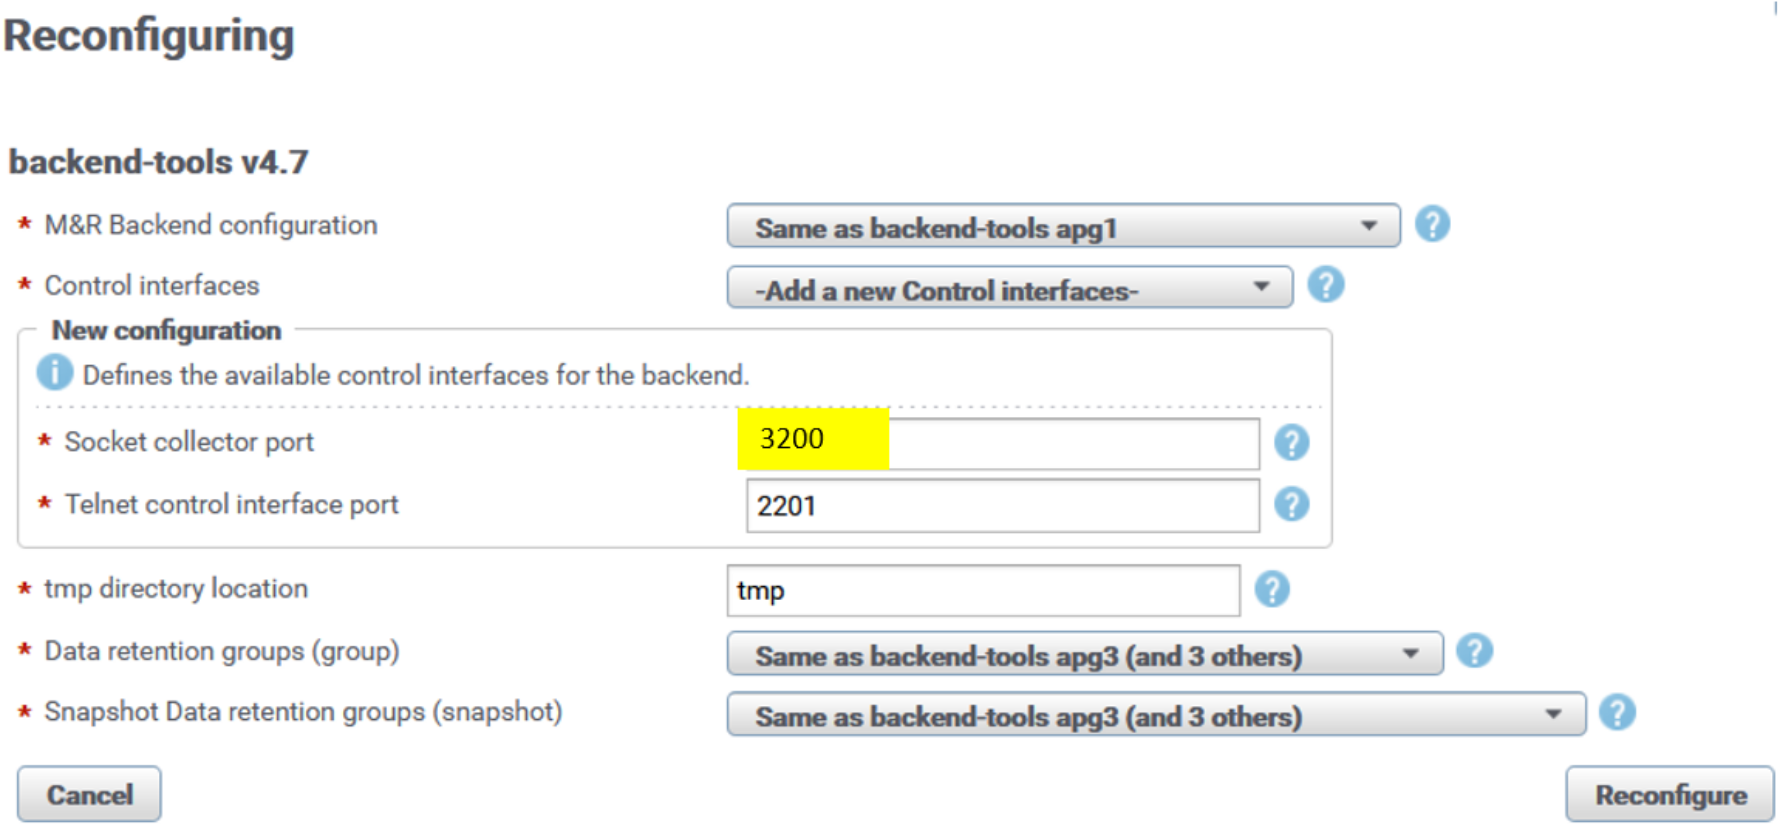
Figure 29. Backend socket reconfiguration UI
After reconfiguration, the backend instance automatically restarts and the new listening port is applied. Repeat the same procedure for every backend instance across all PROD backend servers.
Data Gateway (DGW) component on PROD backend servers is used to receive incoming data stream from remote collector LBCs and send it to two destination sockets: backend sockets on PROD site (regional) and LBC sockets on DR site (global).
DGW includes Property-Tagging-Filter and Variable-Handling-Filter, reducing the replicated set of metrics sent to the DR/global site. As a result, we have PROD site databases redistributed on DR site across fewer database instances. Here is example of the DGW configuration:
collecting.xml:
<config xmlns="http://www.watch4net.com/APG/Collecting" xmlns:xsi="http://www.w3.org/2001/XMLSchema-instance"
xsi:schemaLocation="http://www.watch4net.com/APG/Collecting collecting.xsd ">
<connectors>
<connector enabled="true" name="Global-Backend" type="Channel-Negotiation-Connector" config="conf/socketconnector-global.xml" />
<connector enabled="true" name="Regional-Backend" type="Socket-Connector" config="conf/socketconnector-regional.xml" />
</connectors>
<filters>
<filter enabled="true" name="Global-FailOver" next="Global-Backend" config="FailOver-Filter/DGW1/conf/failover-global.xml" />
<filter enabled="true" name="Regional-FailOver" next="Regional-Backend" config="FailOver-Filter/DGW1/conf/failover-regional.xml" />
<filter enabled="true" name="VHF-Global" next="Global-FailOver" config="Variable-Handling-Filter/DGW1/conf/VHF-Global.xml" />
<filter enabled="true" name="Global-Filter" next="VHF-Global" config="Property-Tagging-Filter/DGW1/conf/PTF-Global.xml" />
</filters>
<collectors>
<collector enabled="true" name="Socket-Collector" next="Regional-FailOver Global-Filter" type="Channel-Negotiation-Collector" config="conf/socketcollector.xml" />
</collectors>
</config>
PTF-Global.xml:
<property-tagging-filter-config xmlns="http://www.watch4net.com/APG/Filter/PropertyTaggingFilter">
<refresh unit="hours">1</refresh>
<files>
<text-file encoding="UTF-8" path="conf/is-global.csv">
<field-separator>,</field-separator>
<field-quoting>"</field-quoting>
<default-symbol>**</default-symbol>
<null-symbol>@@</null-symbol>
<match-all-symbol>%%</match-all-symbol>
<property-insertion end="}" start="${"/>
<key-properties>
<key-property delete-after-use="false" string-type="sqlpattern-cs">name</key-property>
<key-property delete-after-use="false" string-type="sqlpattern-cs">unit</key-property>
</key-properties>
<new-properties>
<new-property>isglobal</new-property>
</new-properties>
</text-file>
</files>
</property-tagging-filter-config>
VHF-Global.xml:
<configuration xmlns="http://www.watch4net.com/VariableHandlingFilter" xmlns:xsi="http://www.w3.org/2001/XMLSchema-instance" xsi:schemaLocation="http://www.watch4net.com/VariableHandlingFilter variable-handling-filter.xsd ">
<handling-configuration id="BlockMetrics">
<matcher class="com.watch4net.apg.v2.collector.plugins.variablehandlingfilter.matchers.APGFilterMatcher">
<parameter name="filter">!isglobal=='true'</parameter>
</matcher>
<handler class="com.watch4net.apg.v2.collector.plugins.variablehandlingfilter.handlers.BlockAllHandler"/>
</handling-configuration>
</configuration>
Metrics that target the DR (global) site pass through the PTF-Global.xml filter, where we declare which of them will be tagged with the isglobal property—only Capacity metrics, for example.
Next, the VHF-Global.xml filter discards the metrics that are not tagged with isglobal.
This is how a reduced set of metrics is sent to the DR site, which results in the use of fewer database resources.
We can compute the required number of DR/global Additional Backend servers by adding up all isglobal unique metrics from all regional frontends—for example, name=’%Capacity%’ (metric name contains “Capacity”)—and divide it by 5,000,000. That way, each database instance should have 1,250,000 metrics maximum.
The number of such %Capacity% metrics can be retrieved from Manage Database Metrics in the Admin UI of each regional frontend.
The SRM administrator must monitor DR health reports for any alerts related to database metric counts and deploy a new Additional Backend server on the DR site if the limit is reached (1.5M metrics per database).
Here is sample reconfiguration UI for a data-gateway instance on PROD PBE:
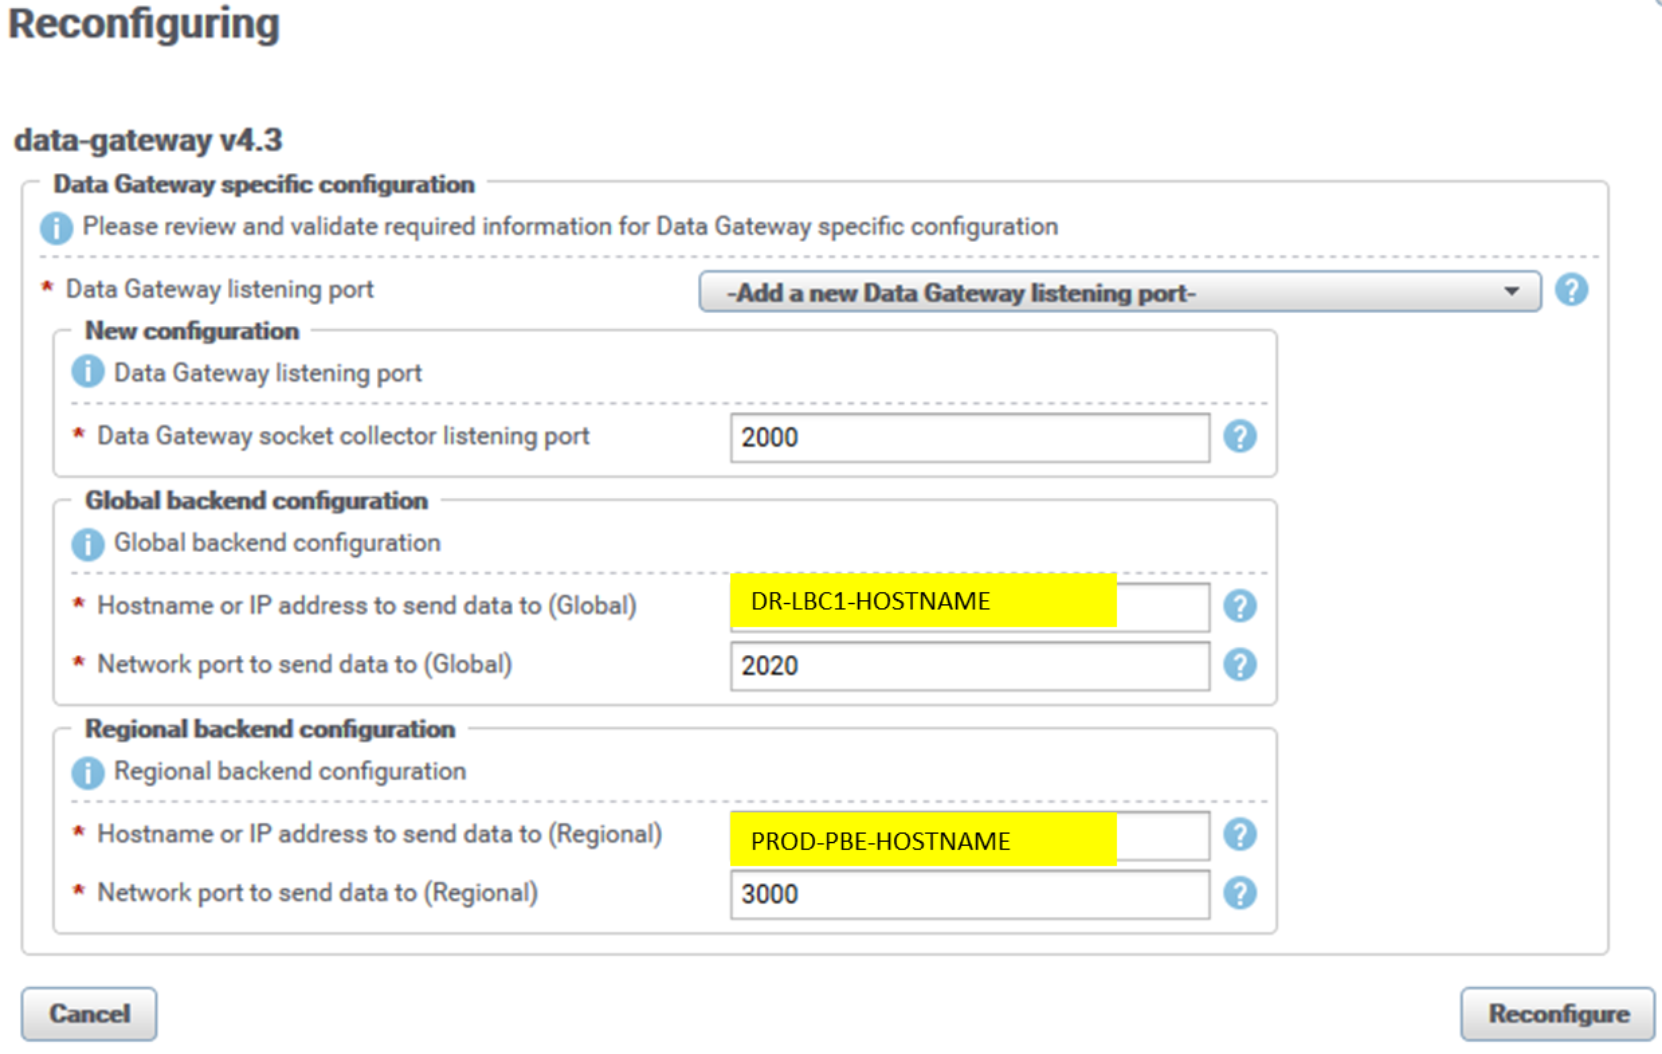
Figure 30. DGW reconfiguration UI
The listening socket collector port of the DGW instance is 2060 by default. We set it to the respective default backend listening port (2000, 2100, 2200, 2300, 2400) to accommodate the existing PROD arbiter’s (LBA) configuration based on default backend sockets. This configuration uses port 2000 for the PROD PBE server DGW instance.
DGW’s PROD (regional) backend port is set to new backend listening ports (3000, 3100, 3200, 3300, 3400). Figure 30 shows the PROD PBE backend apg instance, port 3000.
DGW’s DR (global) port is set to one of DR (global) LBC listening ports (2020, 2021, 2022, and so on). Aim is to distribute the metrics evenly across all DR (global) LBCs, so for other DGW instance use another global LBC socket. If this setup is used for federated architecture, the region’s DGW instances would have their own dedicated global site LBC (for example region “A” DGW is set to push data to global LBC instance with listening port 2020, region “B” to global LBC listening port 2021, and so forth).
LBCs on remote site Collector servers are configured to send data to the PROD DGW socket collector, which then sends data to regional and global sockets (PROD and DR). LBCs essentially receive DGW sockets information from LBA. Here is an example of Connector.xml of the remote site LBCs (there is no UI entry for a particular configuration file):
<?xml version="1.0" encoding="UTF-8"?>
<config xmlns:xsi="http://www.w3.org/2001/XMLSchema-instance" xmlns="http://www.watch4net.com/APG/ChannelNegotiationConnector">
<host>PROD-ADD-BACKEND-SERVER</host>
<port>2100</port>
<buffer-size>32768</buffer-size>
<retry-count>1</retry-count>
<retry-timeout>5000</retry-timeout>
<connect-timeout>60000</connect-timeout>
<write-timeout>5000</write-timeout>
<drop-control-fields>true</drop-control-fields>
<capabilities>compression(@active=suggested)</capabilities>
</config>
LBCs on remote Collector servers are configured to communicate with the Primary Backend (PBE) server’s LBA on the PROD site. LBCs' default listening port is 2020. LBC configuration is by default from the LBC block—that is, with PROD PBE hostname and web-service port (48443) set for web-service gateway, and PROD PBE hostname and port 2020 for arbiter data port.
LBCs are configured to send raw data to their respective alerting backend (ABE) on the PROD site. The ABE from the PROD site must periodically replicate its configuration to the DR site (alerting.xml and alerting-contexts.xml)—for example, a cron job scheduled once per day. If there is failover to the DR site ABE server, the DR site must have latest alert definitions in place.
The following content is an example of the PROD PBE crontab file for the root user (crontab -e), which assumes that ssh keys are in place on PROD and DR servers. (For the procedure to enable ssh authentication with keys, see Appendix A: mysql master database replication.)
0 22 * * * scp /opt/APG/Backends/Alerting-Backend/Default/conf/alerting*.xml root@DR-PBE-HOSTNAME:/opt/APG/Backends/Alerting-Backend/Default/conf/.
LBC is configured with PROD frontend web service, with PROD FE hostname and port 58443. This configuration is used for property-tagging purposes, to fetch properties from the SRM web service API that runs on a frontend server.
The following figure is an example of the reconfiguration UI for a load-balancer-connector (LBC) instance. The UI is similar for all other LBC instances across remote Collector servers. It can be found in the Admin UI under SolutionPacks > Installed SolutionPacks > Other Components:
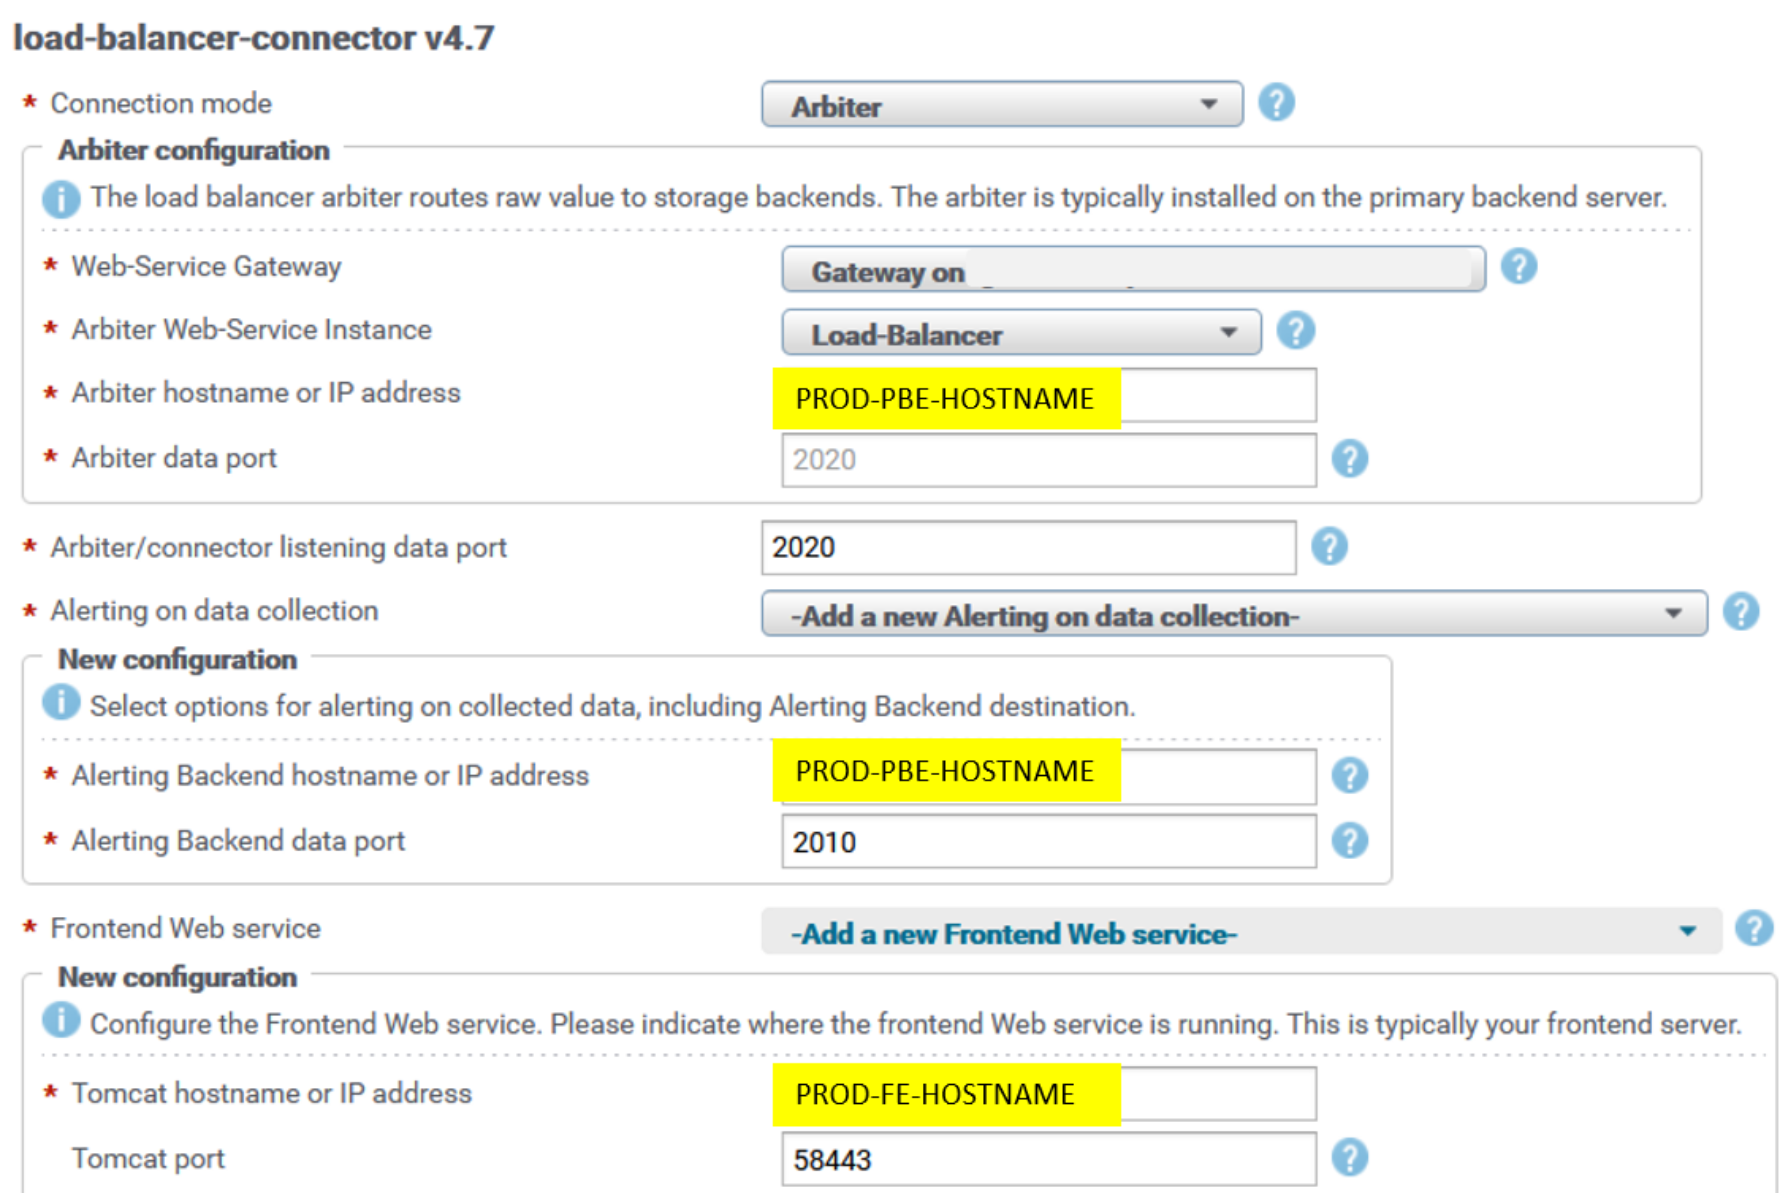
Figure 31. LBC reconfiguration UI PROD
Master database is replicated from the PROD site to the DR site to enable users to transparently log in to both PROD and DR site frontend webapps. See Appendix A: mysql master database replication for instructions on how to setup mysql replication.
Frontend components are communicating with databases from their own site only. For that purpose, if there is failover to the DR frontend, database resources must be updated on the DR site frontend. The resources master database table on the DR site contains only DR site database servers, and the respective table on the PROD site contains only PROD site database servers.
Failure scenarios
For the failure scenarios description, see Failure scenarios under Time-series and alerts data in the DR architecture section of this paper.
Data restore
Following a failure scenario, when PROD site components are restored (that is, servers are up and running), databases on PROD site servers cannot be synchronized with the respective databases on the DR site. This is because we are not mirroring PROD databases to the DR site in this DR architecture scenario.
Restore data as follows:
- Start all services on PROD site Additional Backend servers.
- Start all services on the PROD site PBE server.
- Start all services on PROD site frontend servers.
- Perform the following reconfiguration actions; for details, see the related steps in Failure scenarios under Time-series and alerts data in the DR architecture section of this paper.
- Reconfigure collection blocks of all solution packs to the PROD frontend web service hostname.
- Reconfigure collection blocks of all LBC and health solution packs to the PROD alerting backend hostname.
- Reconfigure LBCs with the PROD LBA hostname.
After these blocks are reconfigured with the proper PROD site hostnames, end users can switch to PROD site frontend servers.
- Stop all services on DR site frontend servers.
- Check for errors in log files and resolve any issues.
Note: The procedure’s drawback is in having a data gap in the PROD databases. The gap starts at the moment the PROD site fails and ends at the moment when collectors start sending data to PROD databases again.
For the architecture diagram, see Figure 27.
Events
Setup
In the architecture described in Setup under Time-series and alerts data, events are natively replicated over DR LBCs to the DR PBE server, so there is no need to set up events database replication.
Failure scenarios
For a description of failure scenarios, see Failure scenarios under Events in the DR architecture section. The failure scenarios are the same.
Data restore
For the data restore procedure, see Data restore under Events in the DR architecture section. The data restore procedure is the same.
Topology
The architecture for topology data is the same as described in Topology in the DR architecture section.