
Presentation and database layers
Presentation and database layers
-
The following figure shows the production and DR site components, with remote sites containing Collector servers that are not subject to disaster recovery:
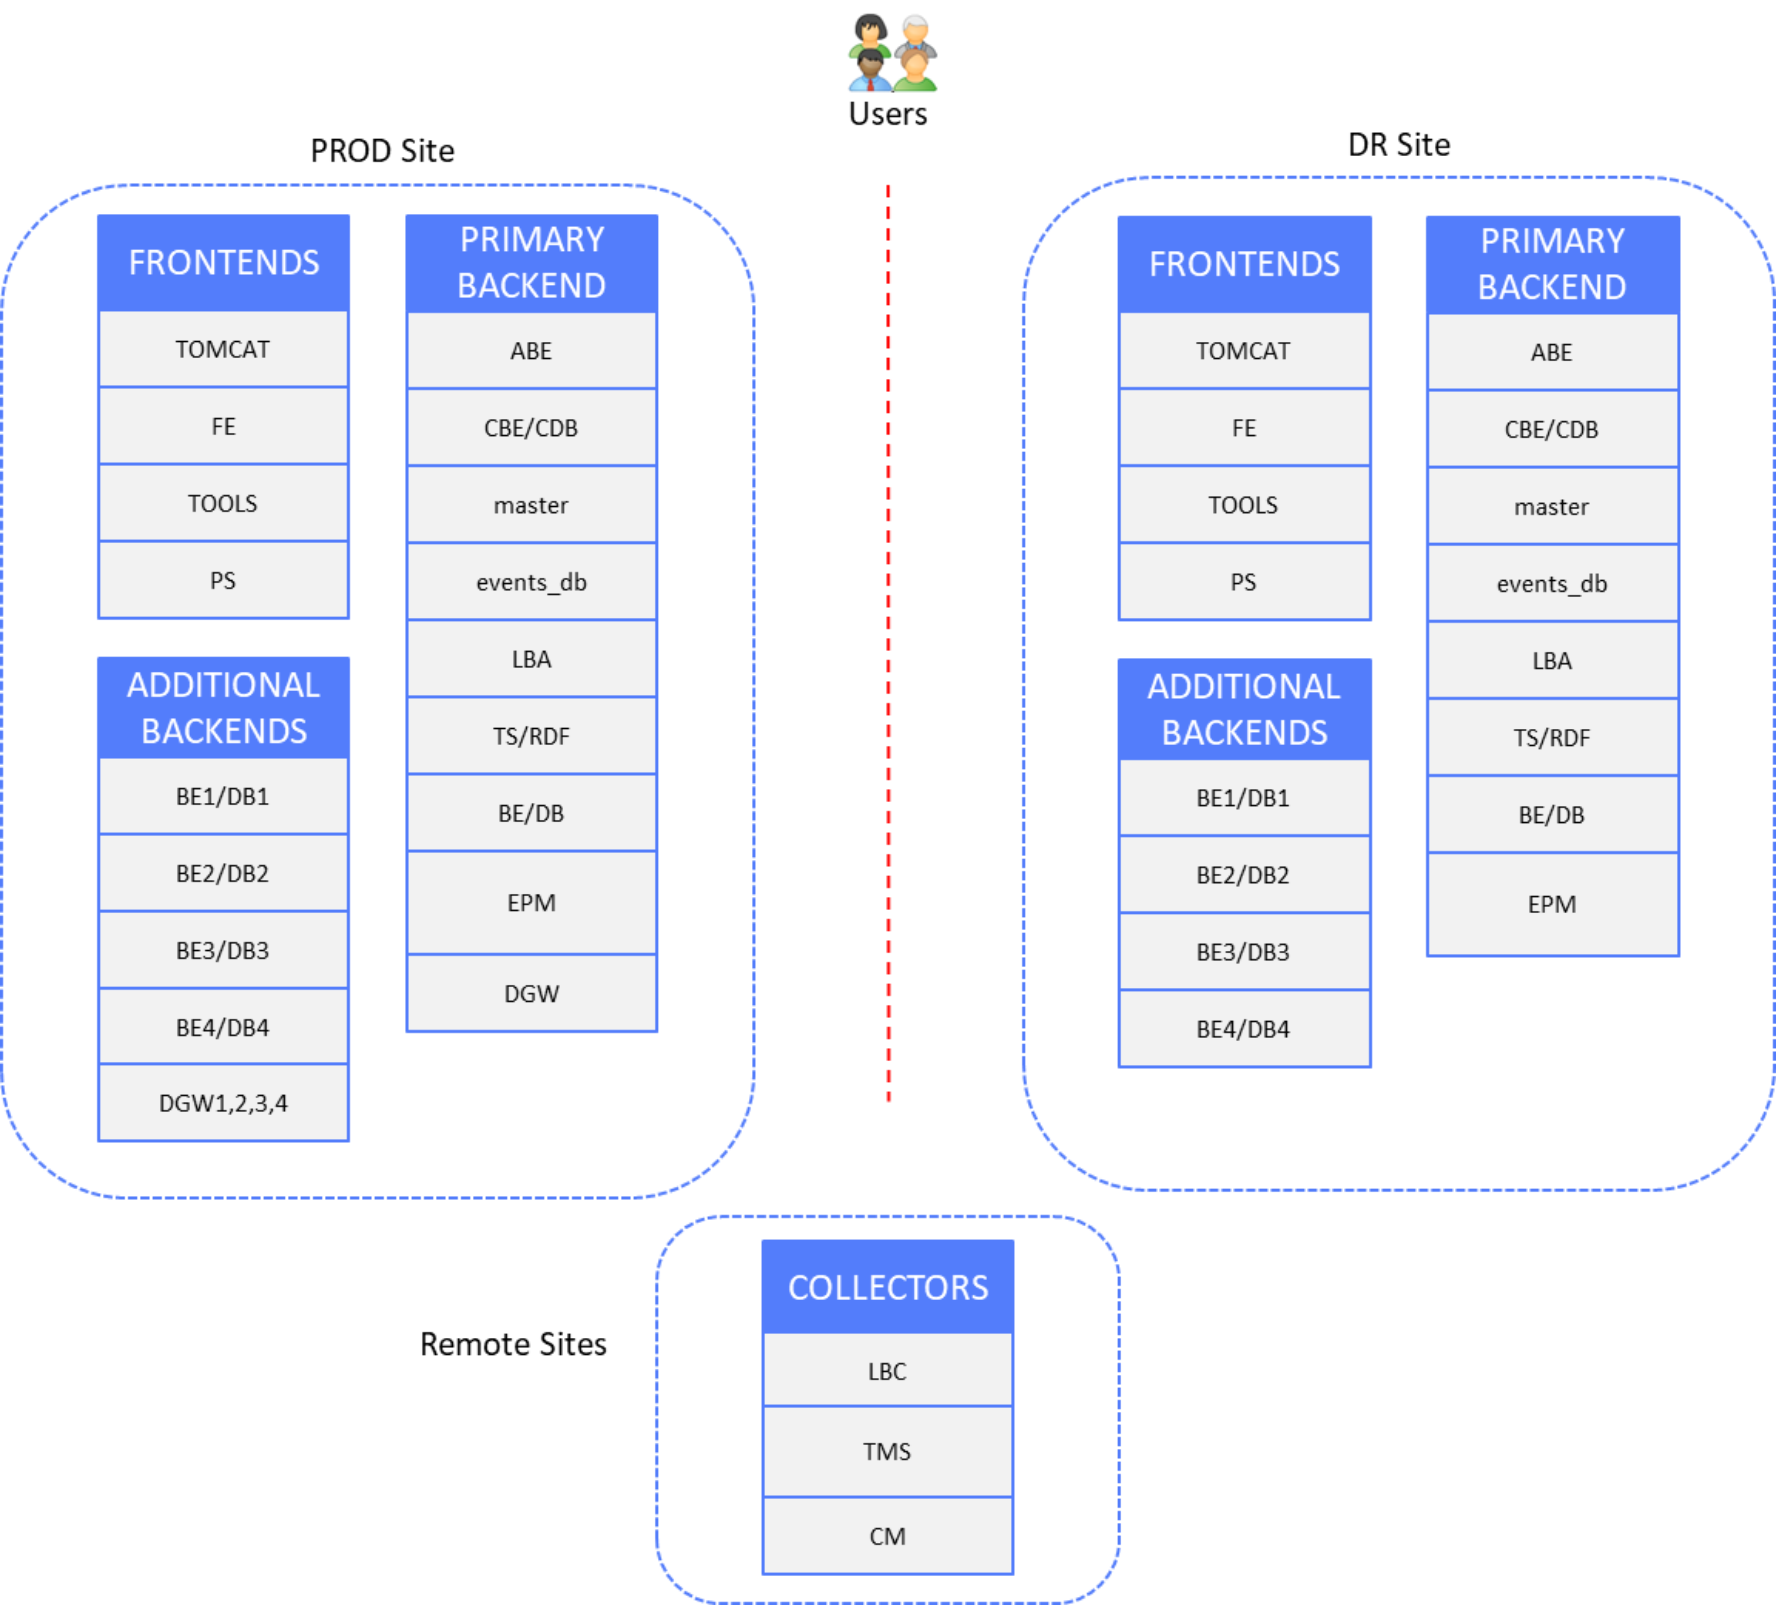
Figure 2. Presentation and database layers DR
DR solutions are shown per datatype to simplify diagrams and configuration examples.
Time-series and alerts data
The following figure shows the time-series and alerts data components:
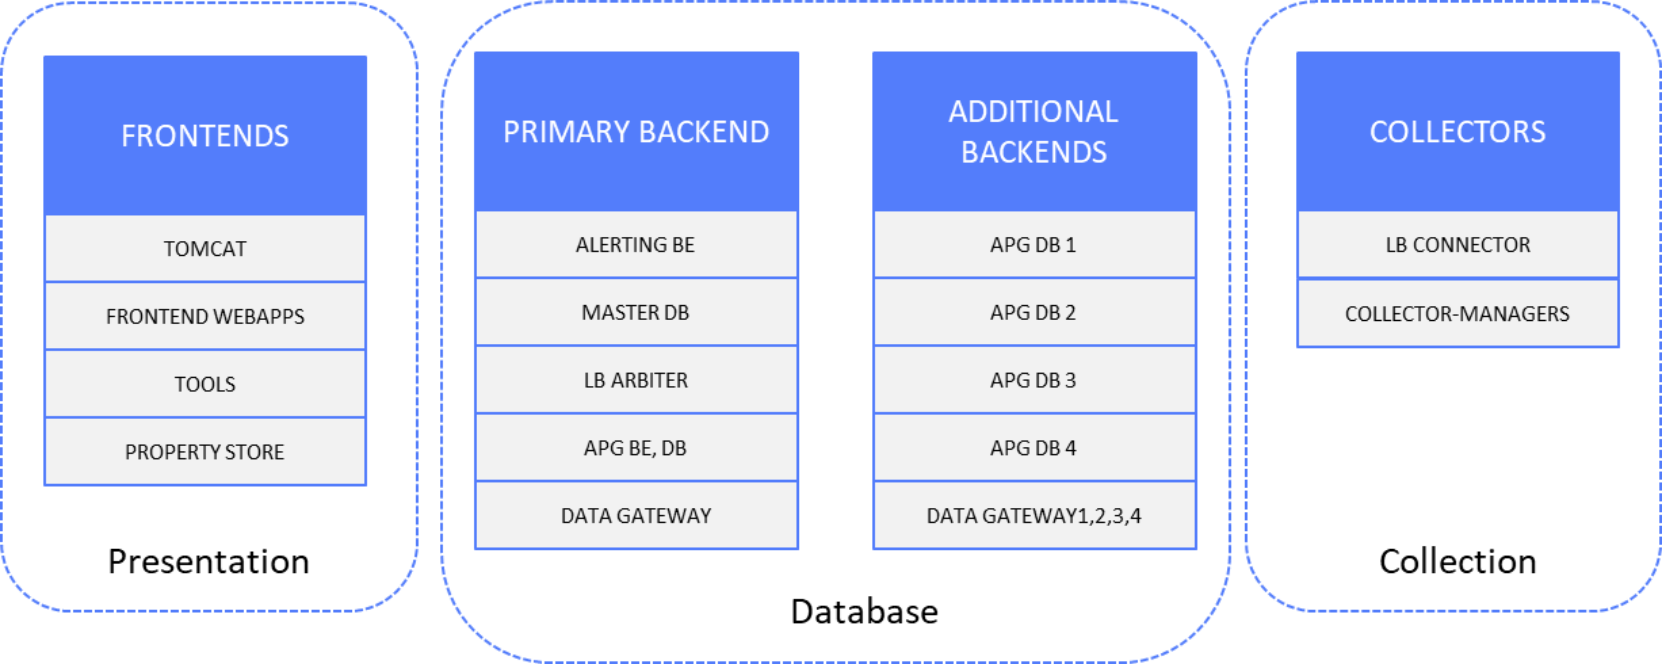
Figure 3. Time-series and alerts data solution components
Setup
The following figure shows a “normal operation” scenario of a production site, where end users are connected to PROD site frontend servers. DR site components are in standby mode (stopped) except Primary and Additional Backend server components, which are in active mode.
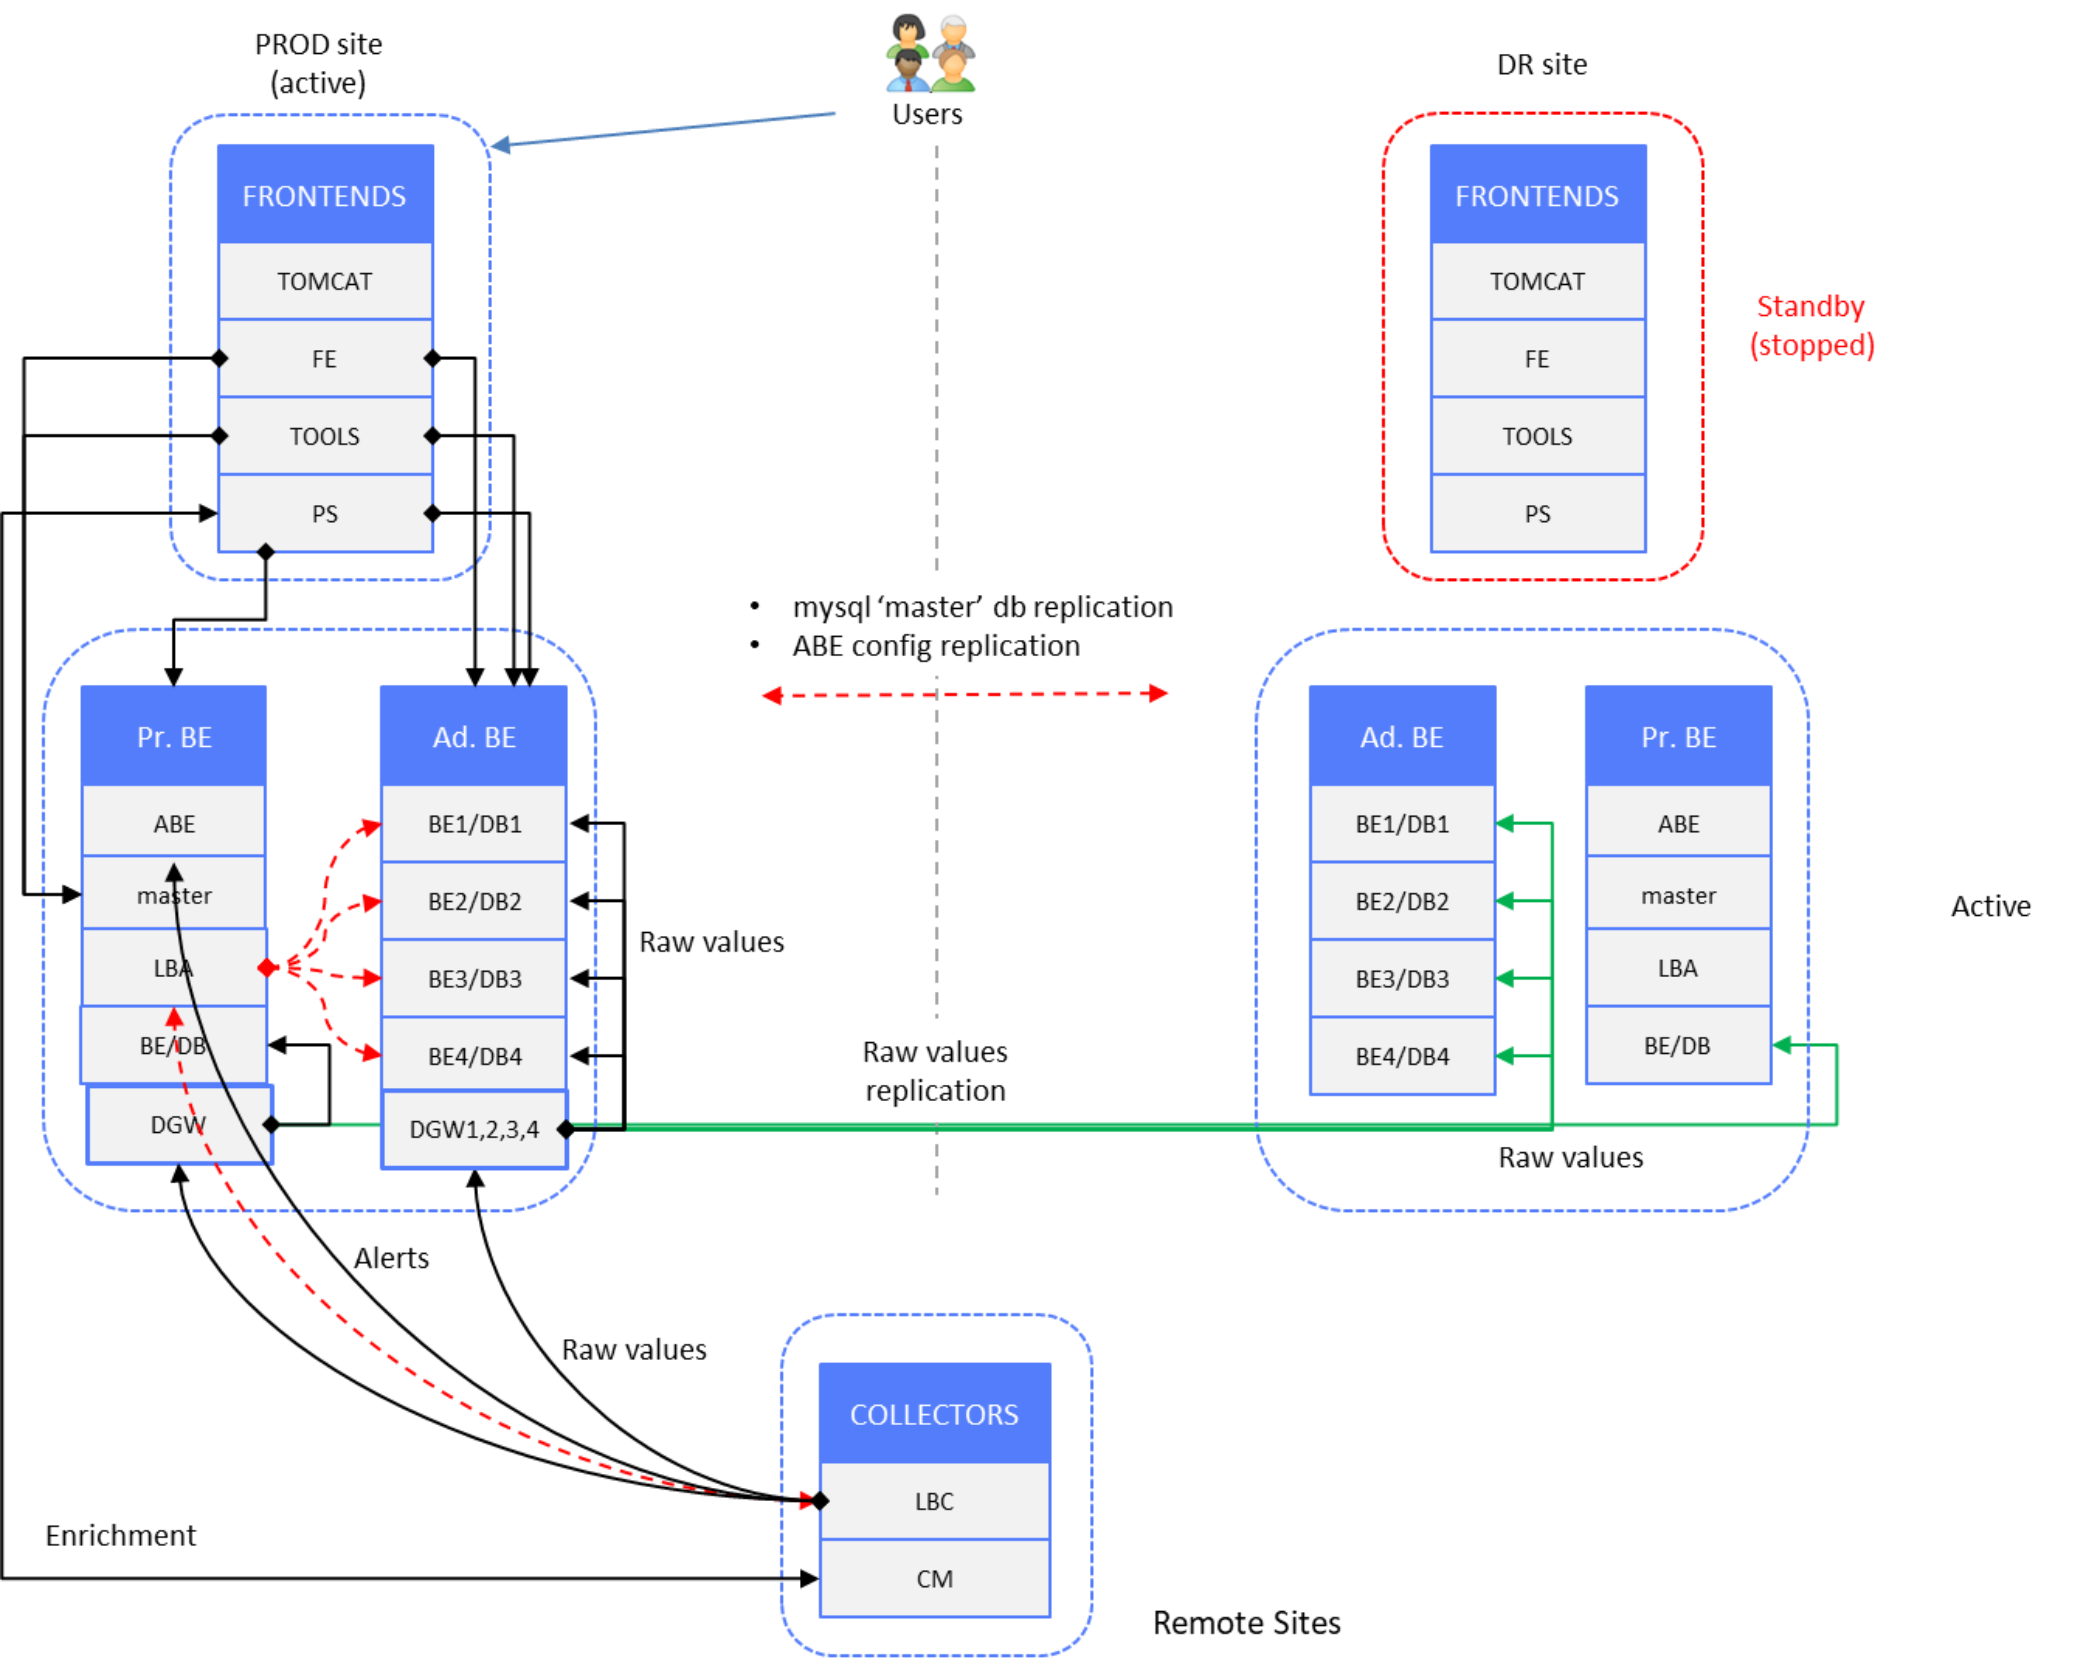
Figure 4. Time-series and alerts data – PROD site active, DR site backends active
Data redundancy is achieved by splitting the raw data stream at the backend layer.
LBAs on PROD and DR site Primary Backend (PBE) servers have the same set of backend and database instances declared; only hostnames are different on the DR site LBA. If new Additional Backend servers are deployed, with new backend/database instances, the LBA configuration on both sites must be updated. Then a reconstruction script is run (see Data restore).
Backend listening ports remain default ones in LBA (2000, 2100, 2200, 2300, 2400). Here is an example of the LBA reconfiguration UI for the PROD PBE:
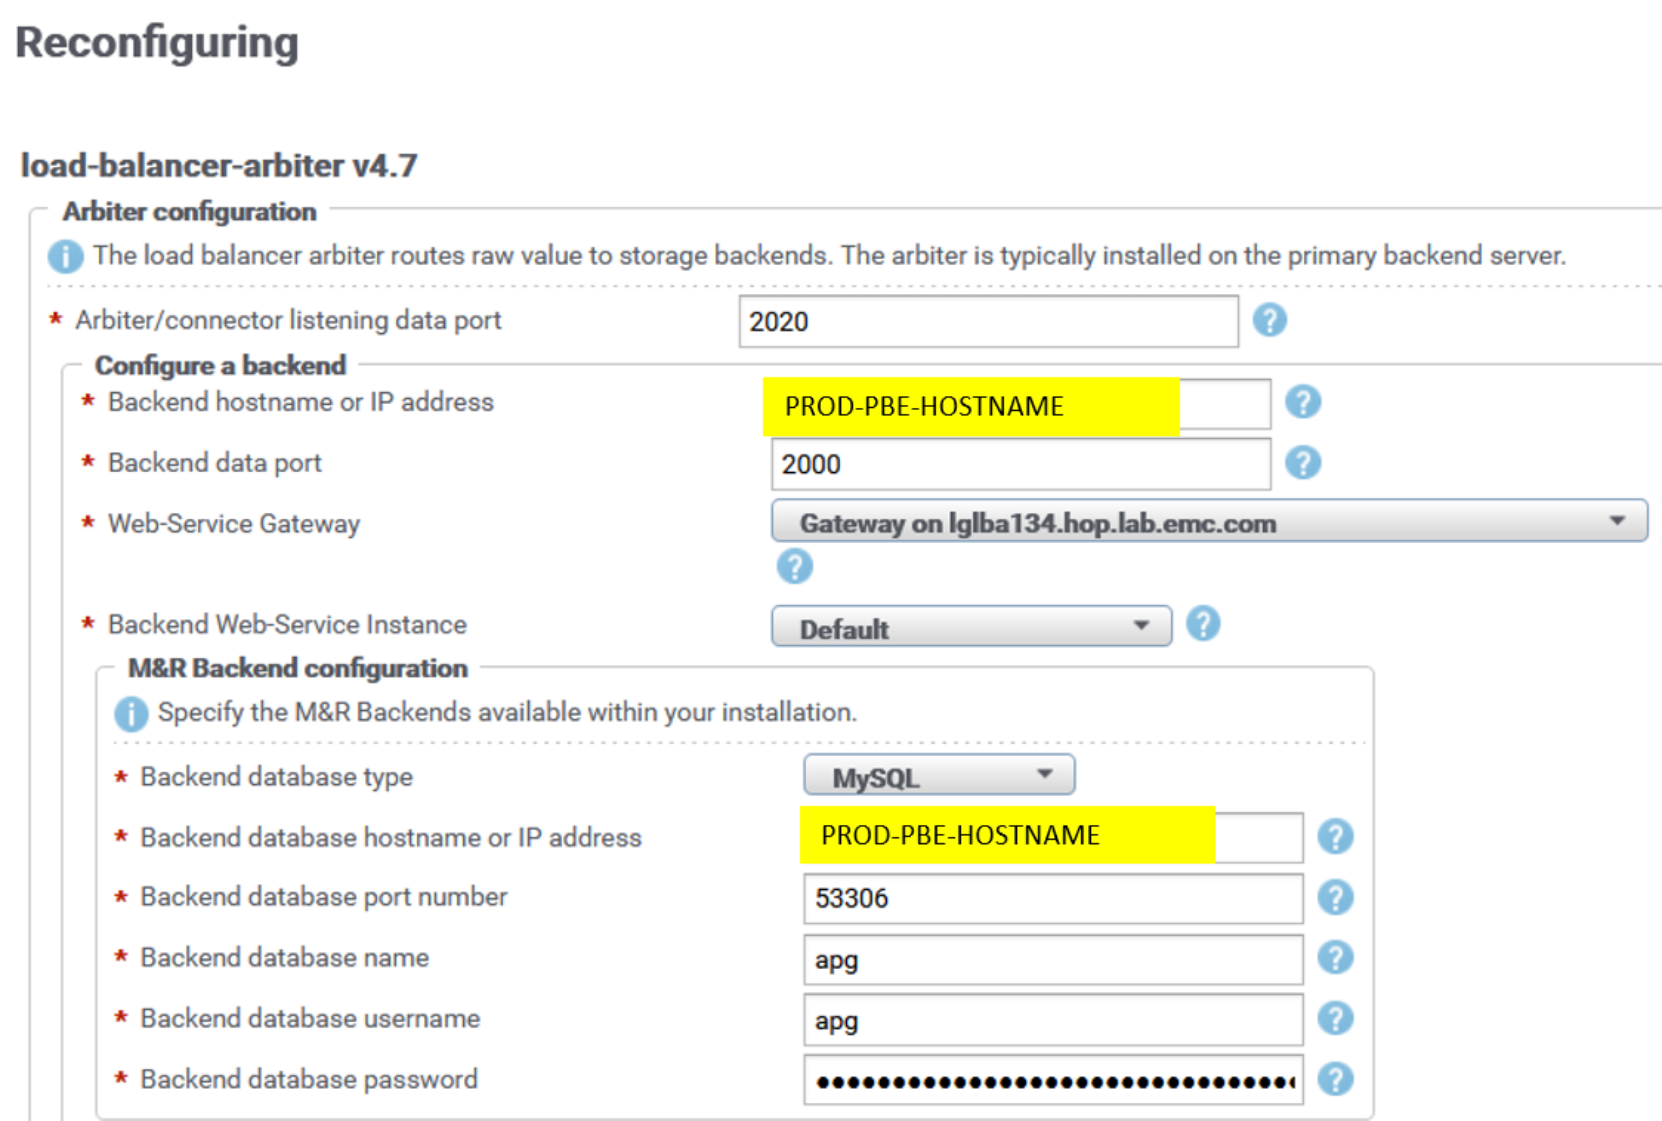
Figure 5. LBA reconfiguration UI
Backend (BE) listening ports on PROD PBE and PROD Additional Backend servers are changed from default ones (2000, 2100, 2200, 2300, 2400) to the new ones (3000, 3100, 3200, 3300, 3400).
Here is sample reconfiguration UI for the backend instance apg2 on one of the PROD Additional Backends:
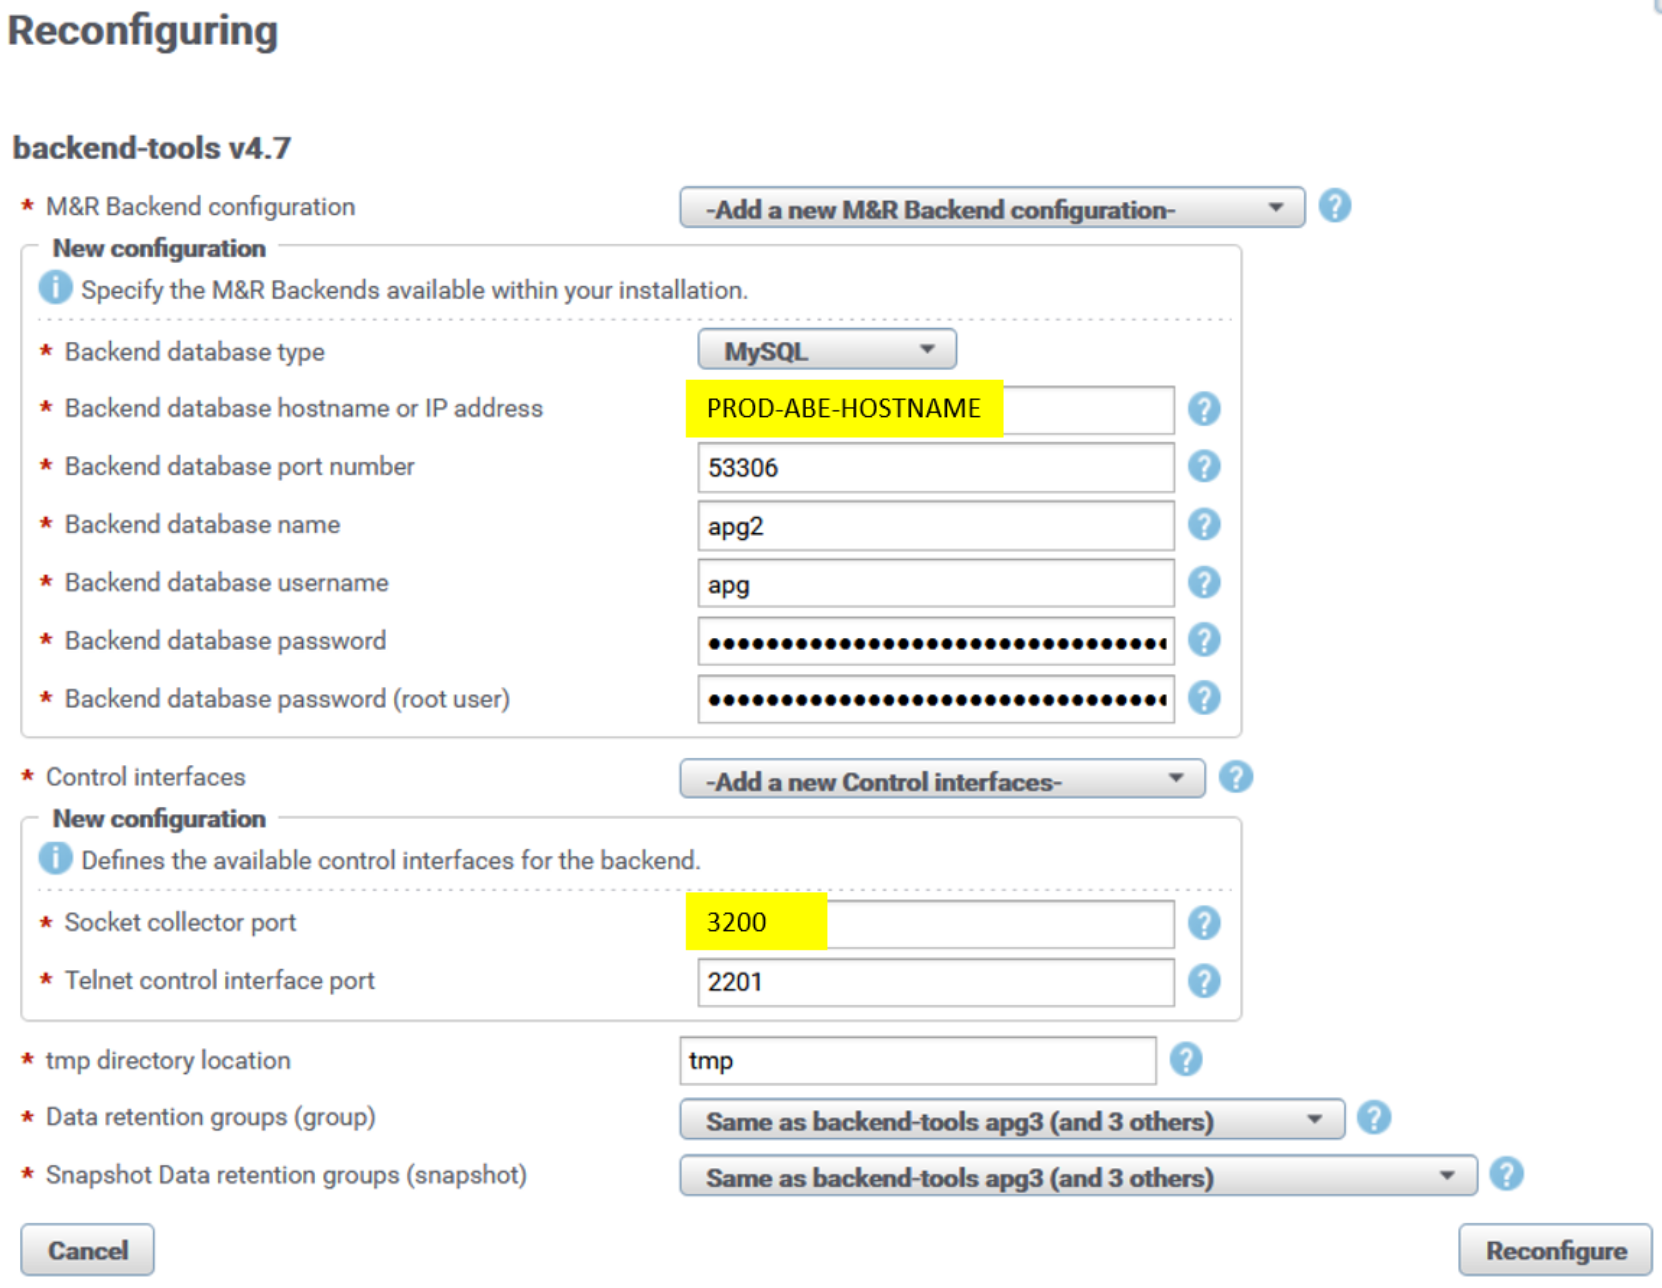
Figure 6. Backend socket reconfiguration UI
After reconfiguration, the backend instance automatically restarts and the new listening port is applied. Repeat the same procedure for every backend instance across all PROD backend servers.
Data Gateway (DGW) component on PROD backend servers is used to receive incoming data stream from remote collector LBCs and send it to two destination sockets: backend sockets on PROD site (regional) and backend sockets on DR site (global). As a result, the PROD site databases are mirrored on the DR site. Each DGW points to a single backend instance on PROD and a single backend instance on DR.
The following figure is an example of the reconfiguration UI for a data-gateway instance on PROD PBE server. The UI is similar for all other DGW instances across Additional Backend servers:
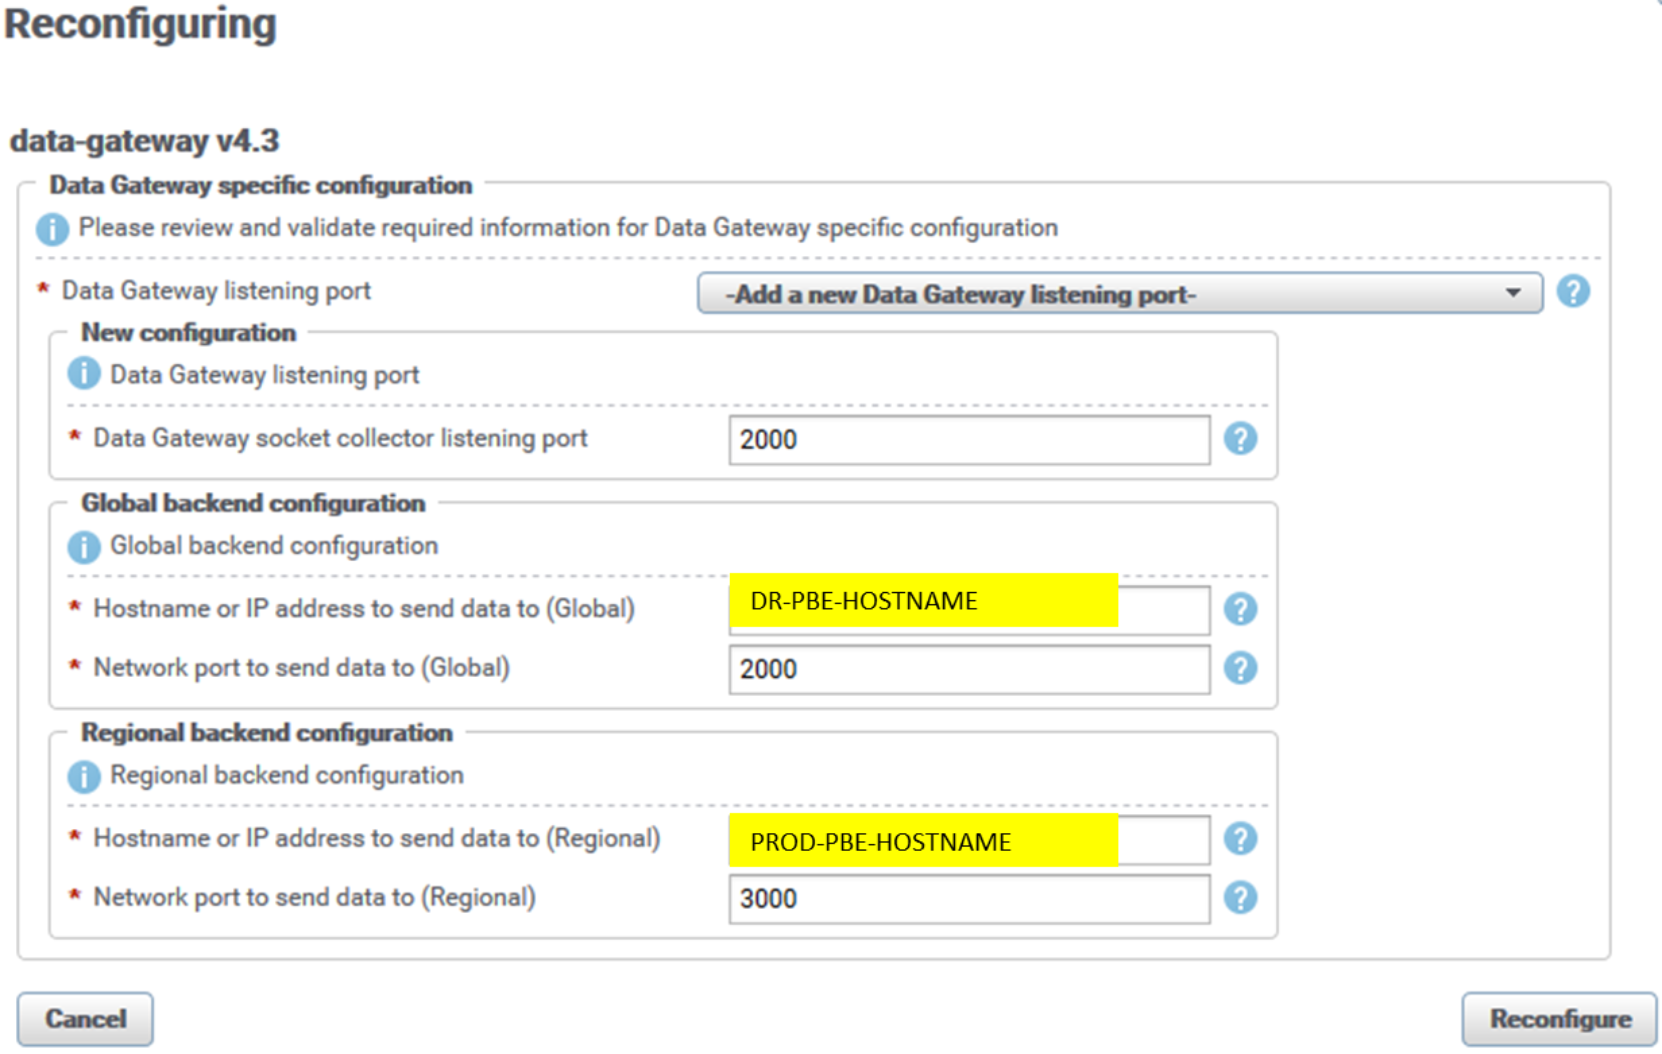
Figure 7. DGW reconfiguration UI
The listening socket collector port of the DGW instance is by default 2060. We set it to the respective default backend listening port (2000, 2100, 2200, 2300, 2400) to accommodate the existing arbiter’s (LBA) configuration based on default backend sockets. In our configuration, port 2000 is used for the PROD PBE server DGW instance.
The DGW PROD (regional) backend port is set to new backend listening ports (3000, 3100, 3200, 3300, 3400). Figure 7 shows the PROD PBE backend apg instance, port 3000.
The DGW DR (global) backend port is set to default backend listening ports (2000, 2100, 2200, 2300, 2400). Figure 7 shows the DR PBE backend apg instance, port 2000. No Data-Gateway component is running on the DR site, so changing backend listening ports on DR backends is not necessary.
LBCs on remote site Collector servers are configured to send data to the PROD DGW socket collector, which then sends data to backend sockets (PROD and DR). LBCs essentially receive DGW sockets information from LBA. The following example is of Connector.xml of the remote site LBCs (there is no UI entry for a particular configuration file):
<?xml version="1.0" encoding="UTF-8"?>
<config xmlns:xsi="http://www.w3.org/2001/XMLSchema-instance" xmlns="http://www.watch4net.com/APG/ChannelNegotiationConnector">
<host>PROD-ADD-BACKEND-SERVER</host>
<port>2100</port>
<buffer-size>32768</buffer-size>
<retry-count>1</retry-count>
<retry-timeout>5000</retry-timeout>
<connect-timeout>60000</connect-timeout>
<write-timeout>5000</write-timeout>
<drop-control-fields>true</drop-control-fields>
<capabilities>compression(@active=suggested)</capabilities>
</config>
LBCs on remote Collector servers are configured to communicate with the PBE server’s LBA on the PROD site. LBCs' default listening port is 2020. LBC configuration is default, with PROD PBE hostname and web-service port (48443) set for the web-service gateway, and PROD PBE hostname and port 2020 set for the arbiter data port.
LBCs are configured to send raw data to their respective alerting backend (ABE) on the PROD site. The ABE from the PROD site must periodically replicate its configuration to the DR site (alerting.xml and alerting-contexts.xml); for example, a cron job could be scheduled once per day. If there is failover to the DR site ABE server, the server must have the latest alert definitions in place.
The following content is an example of the PROD PBE crontab file for the root user (crontab -e), which assumes that ssh keys are in place on PROD and DR servers. (For the procedure to enable ssh authentication with keys, see Appendix A: mysql master database replication.)
0 22 * * * scp /opt/APG/Backends/Alerting-Backend/Default/conf/alerting*.xml root@DR-PBE-HOSTNAME:/opt/APG/Backends/Alerting-Backend/Default/conf/.
LBC is configured with PROD frontend web service, with PROD FE hostname and port 58443. This configuration is used for property-tagging purposes, to fetch properties from the SRM web service API that runs on a frontend server.
The following figure is an example of the reconfiguration UI for the load-balancer-connector (LBC) instance. The UI is similar is for all other LBC instances across remote Collector servers. It can be found in the Admin UI at SolutionPacks > Installed SolutionPacks > Other Components:
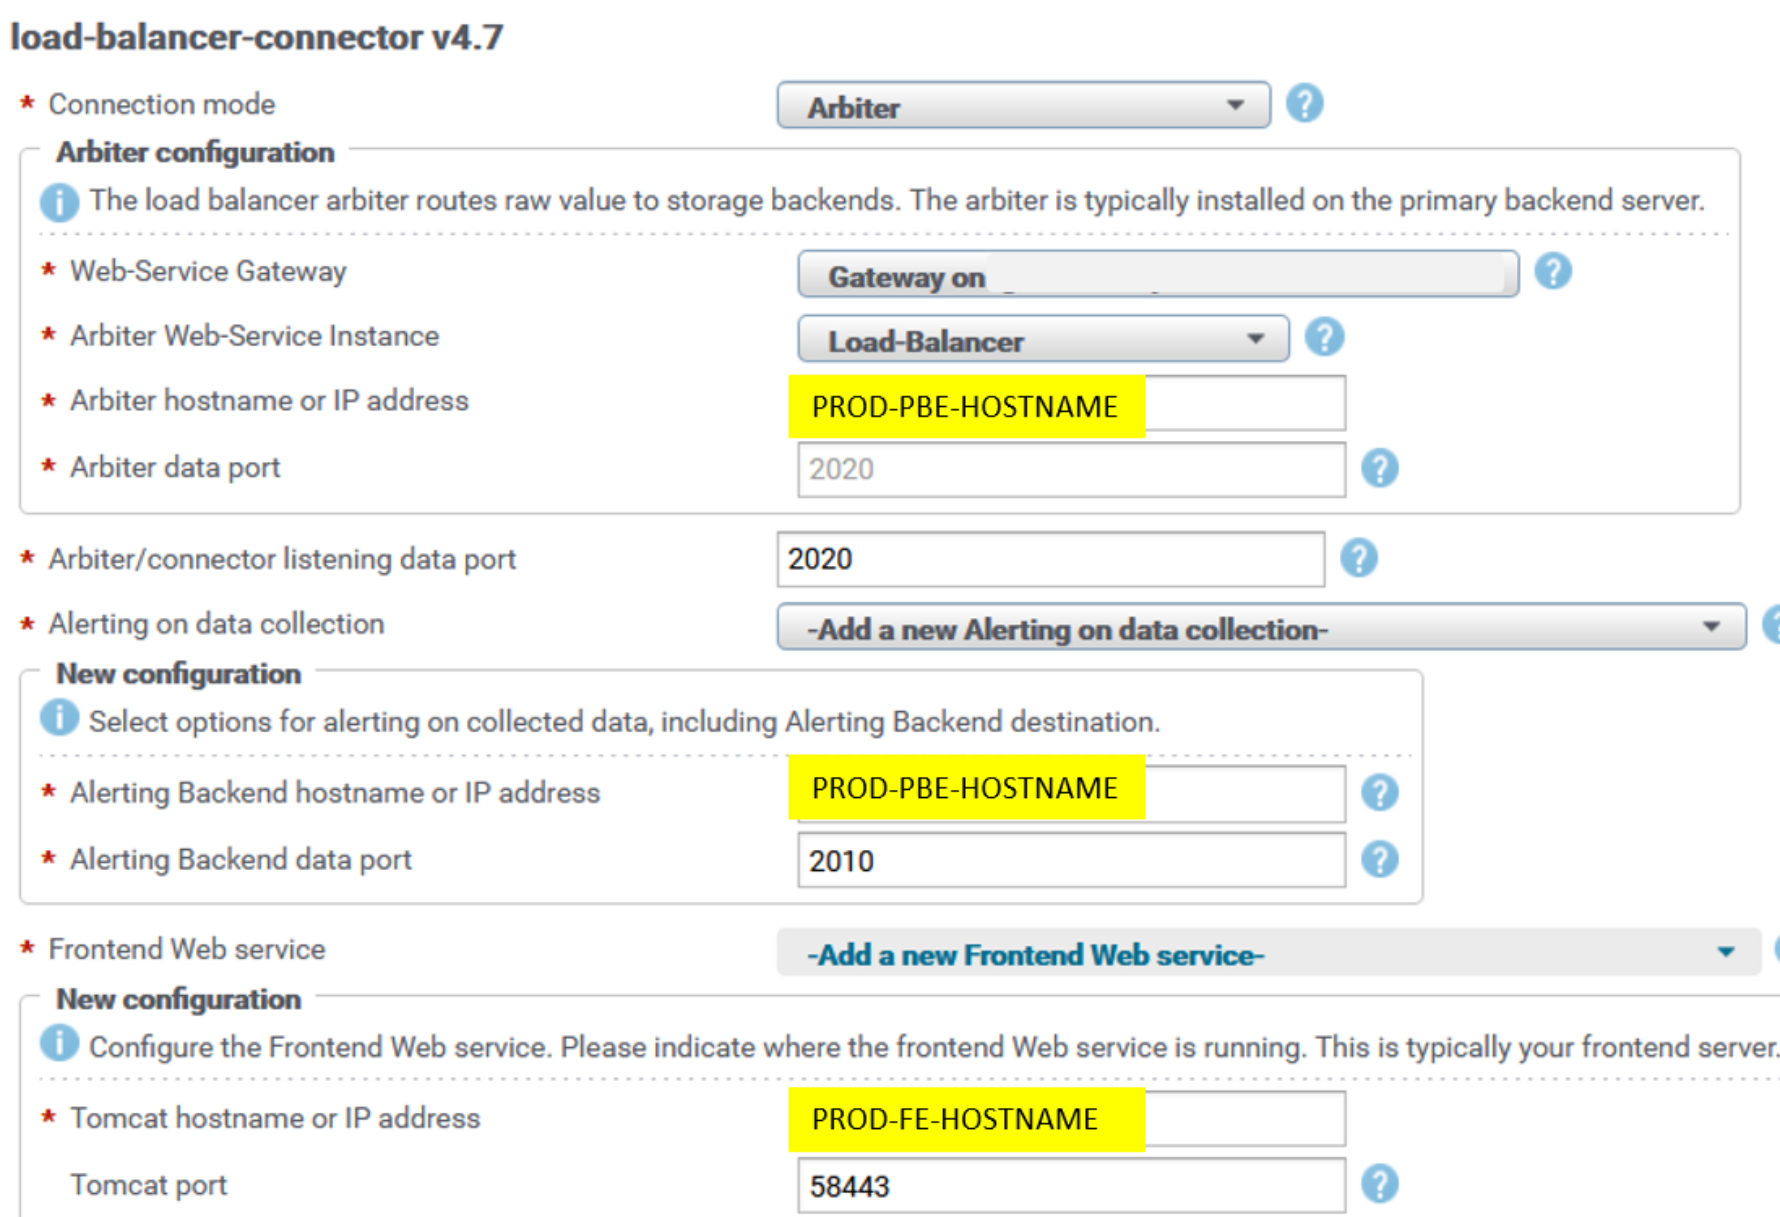
Figure 8. LBC reconfiguration UI PROD
Master database is replicated from the PROD to DR site to enable users to transparently log in to both PROD and DR site frontend webapps. For information about setting up replication, see Appendix A: mysql master database replication.
Frontend components are communicating with databases from their own site only. For that purpose, if there is failover to the DR frontend, database resources must be updated on the DR site frontend. The “resources” master database table on the DR site contains only DR site database servers, and the respective table on the PROD site contains only PROD site database servers. The following section provides more details.
Failure scenarios
There are two failure scenarios in which end users will switch to the DR site:
- PROD site disaster (frontend and backend servers affected)
- Failure of frontend or backend or both servers on the PROD site
Note: In both cases, there is either observation of the failure by administrators or end users, or there is a third-party application that monitors availability/reachability of relevant servers.
In both cases, no data loss will occur unless Collector servers are in same data center that suffered disaster. Data continues to be collected by remote Collector servers. The data is cached to their local file system and pushed to DR site backends when LBCs are reconfigured to push data to the DR site.
- Restart services on DR site frontend servers.
DR frontends must refer to their respective “master” database on the DR PBE server (set by default during SRM deployment). This database is a replica of the PROD PBE server’s master database. For details about master database replication, see Appendix A: mysql master database replication before running the following commands for resources.
- Update the database resources’ url parameter on the DR frontend with the respective DR site database server hostnames.
Each PBE and Additional Backend hostname must go with the respective database instance name (apg, apg1, apg2, apg3, apg4). For example:
# manage-resources.sh update dba/APG-DB '{"datasource":{"url":"jdbc:mysql://DR-PBE-BACKEND-HOSTNAME:53306/apg?autoReconnect=true&connectTimeout=180000&socketTimeout=180000&maxReconnects=2&useSSL=false"}}'
# manage-resources.sh update dba/APG-DB1 '{"datasource":{"url":"jdbc:mysql://DR-ADD-BACKEND-HOSTNAME:53306/apg1?autoReconnect=true&connectTimeout=180000&socketTimeout=180000&maxReconnects=2&useSSL=false"}}'
- Register any newly added SRM servers.
The DR frontend SRM Admin UI must register the respective DR backend servers, frontends, and remote Collector servers and establish connection with them. Registration is done during the initial deployment of DR servers, so new registration action is needed only for any newly added SRM servers.
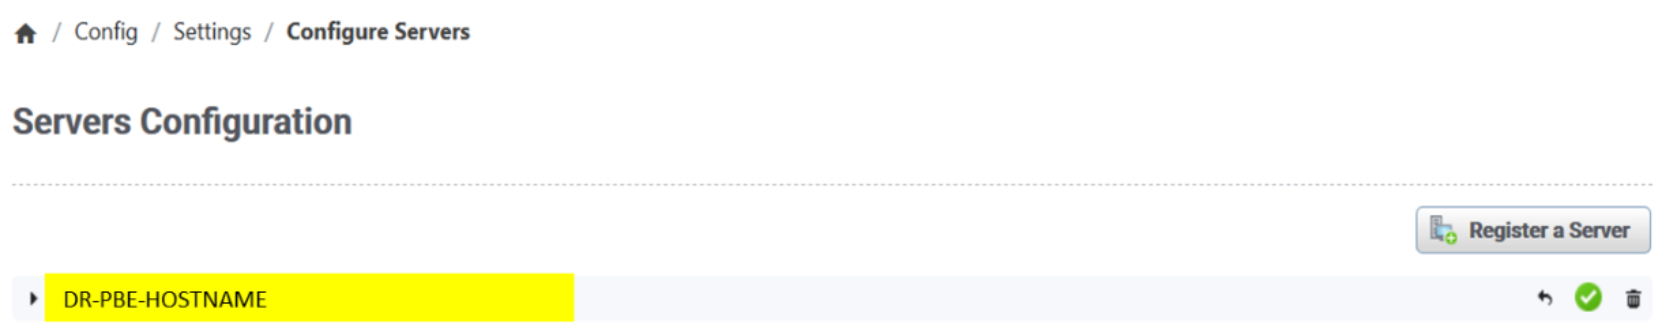
Figure 9. SRM Admin UI servers configuration
- Reconfigure collection blocks of all solution packs to the DR frontend web service hostname.
Here is example from SRM Admin UI Central Configuration Repository, where applicable solution pack collection components are listed under the configuration entries. By default, all listed components are selected, but reconfiguration can also be done by selecting only wanted SPs.
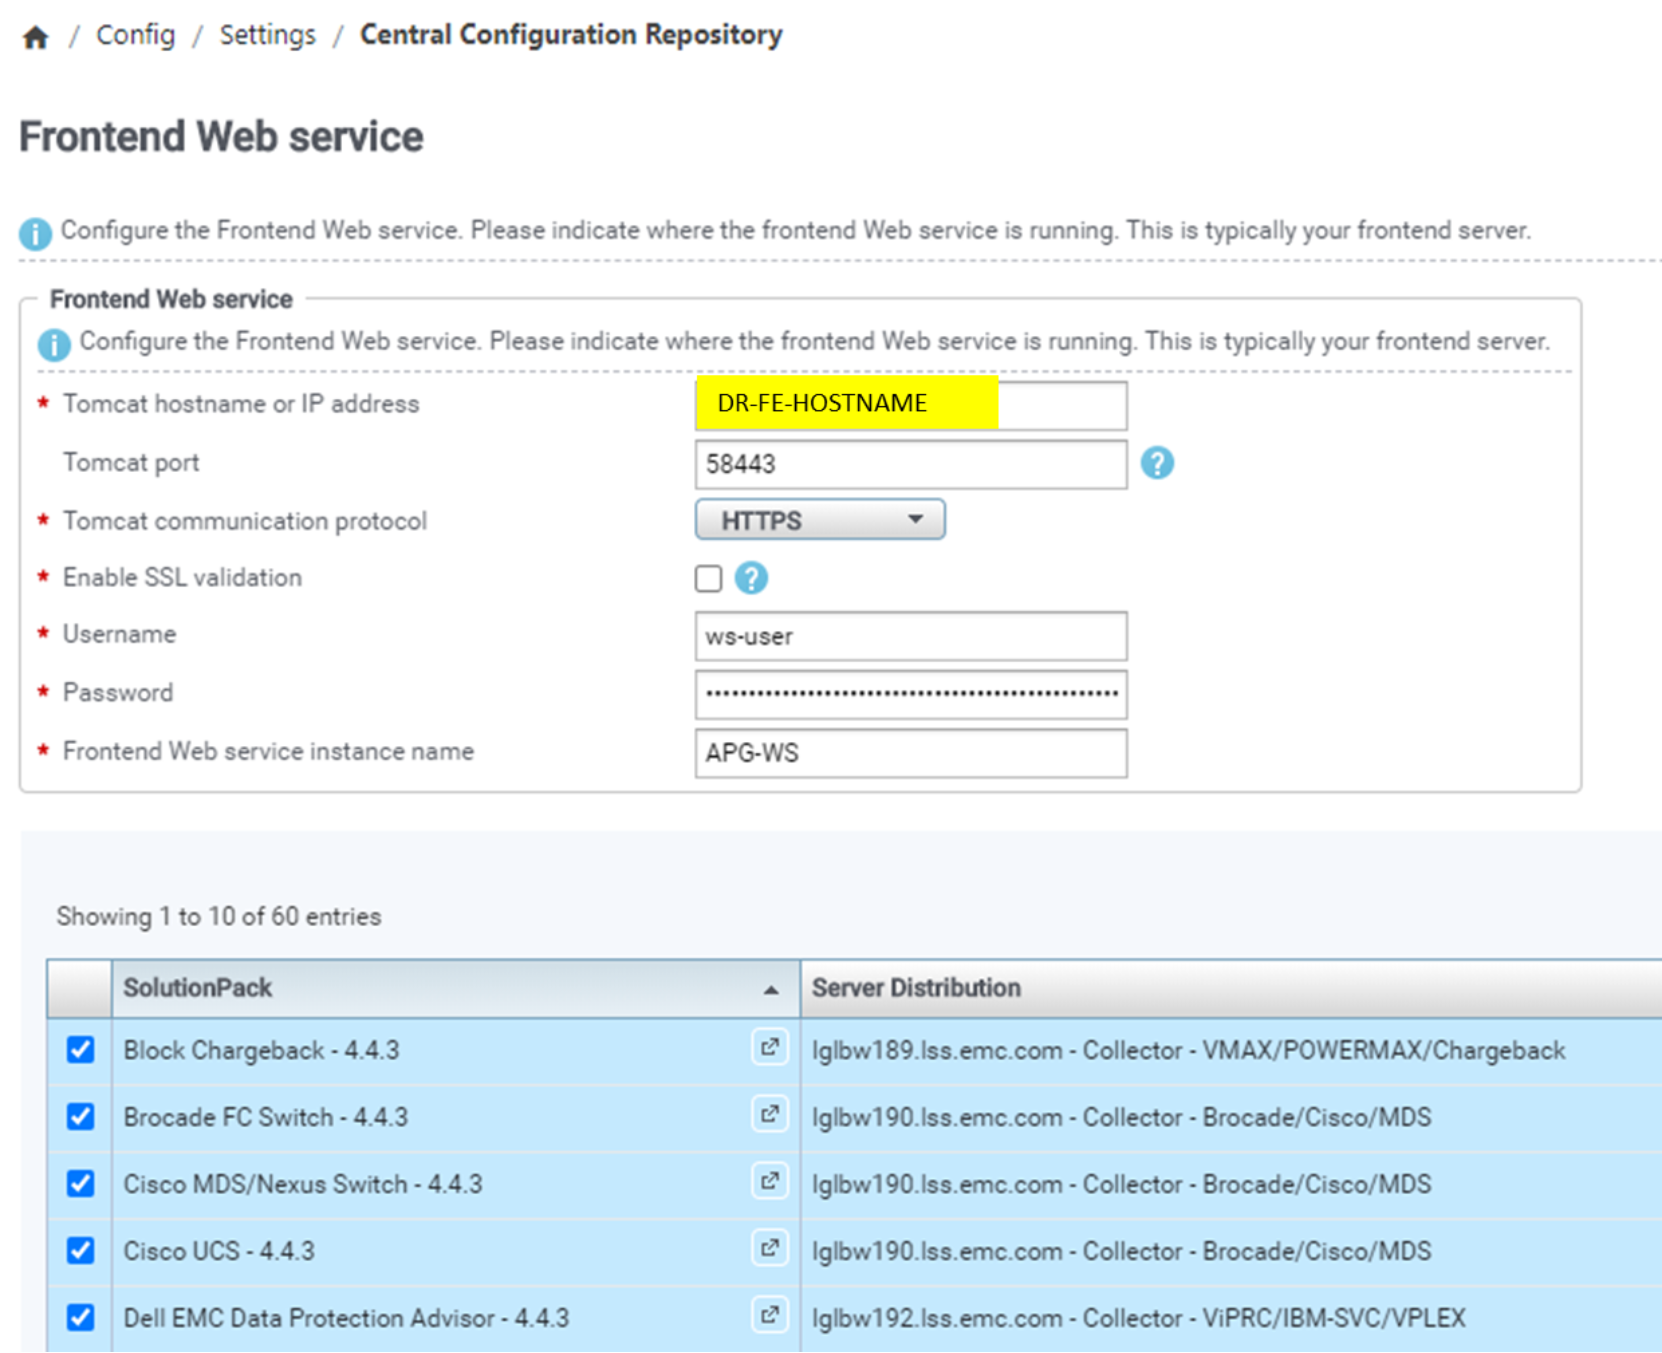
Figure 10. SP data collection block FE web service DR configuration
- Reconfigure collection blocks of all LBC and health solution packs to the DR alerting backend.
Here is example from SRM Admin UI Central Configuration Repository, where applicable solution pack collection components are listed under the configuration entries. By default, all listed components are selected, but reconfiguration can also be done by selecting only wanted SPs.
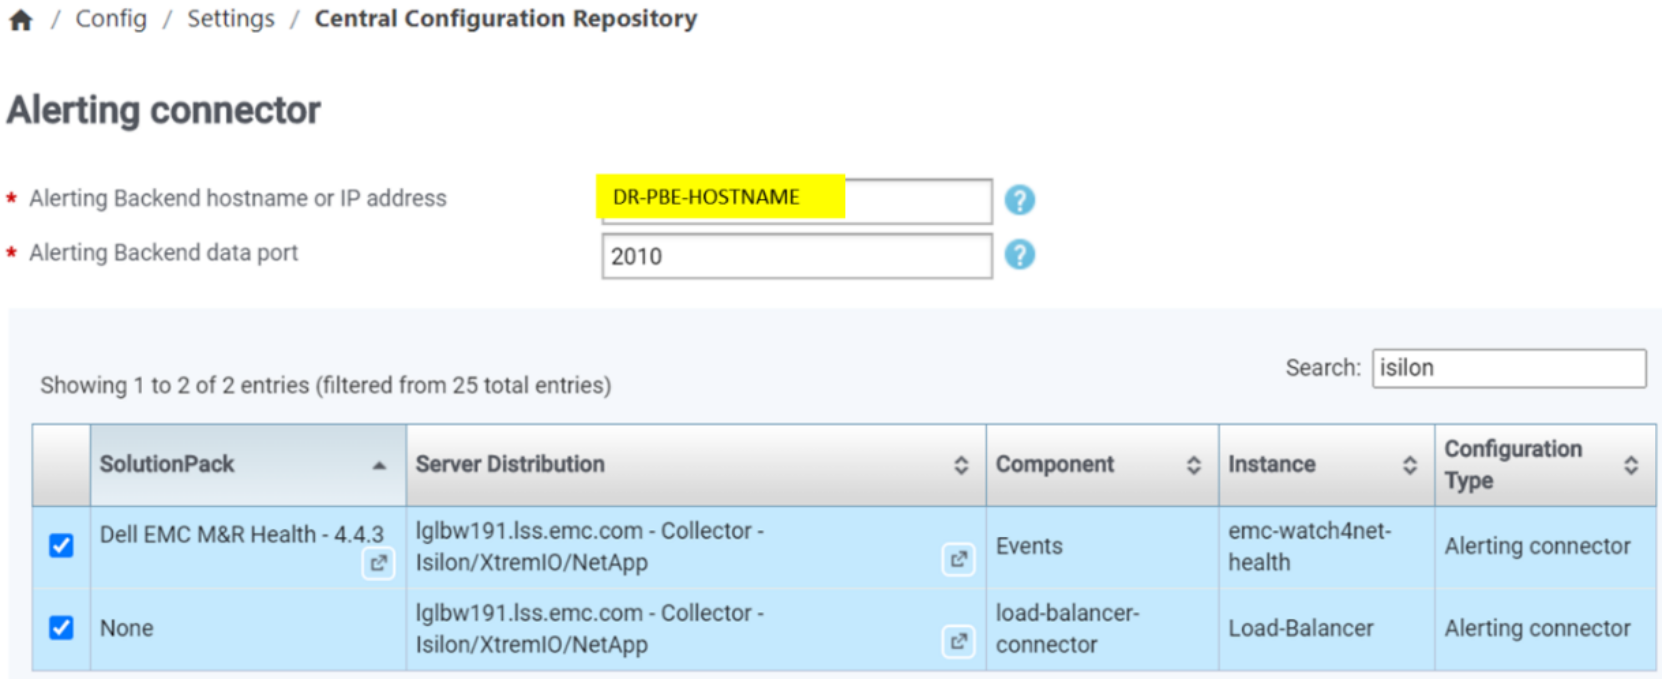
Figure 11. LBC and Health SP DR alerting backend configuration
- Reconfigure LBCs with the DR LBA hostname.
Open each load-balancer-connector configuration block under Installed Solution Packs/Other Components in the DR SRM Admin UI. For example:
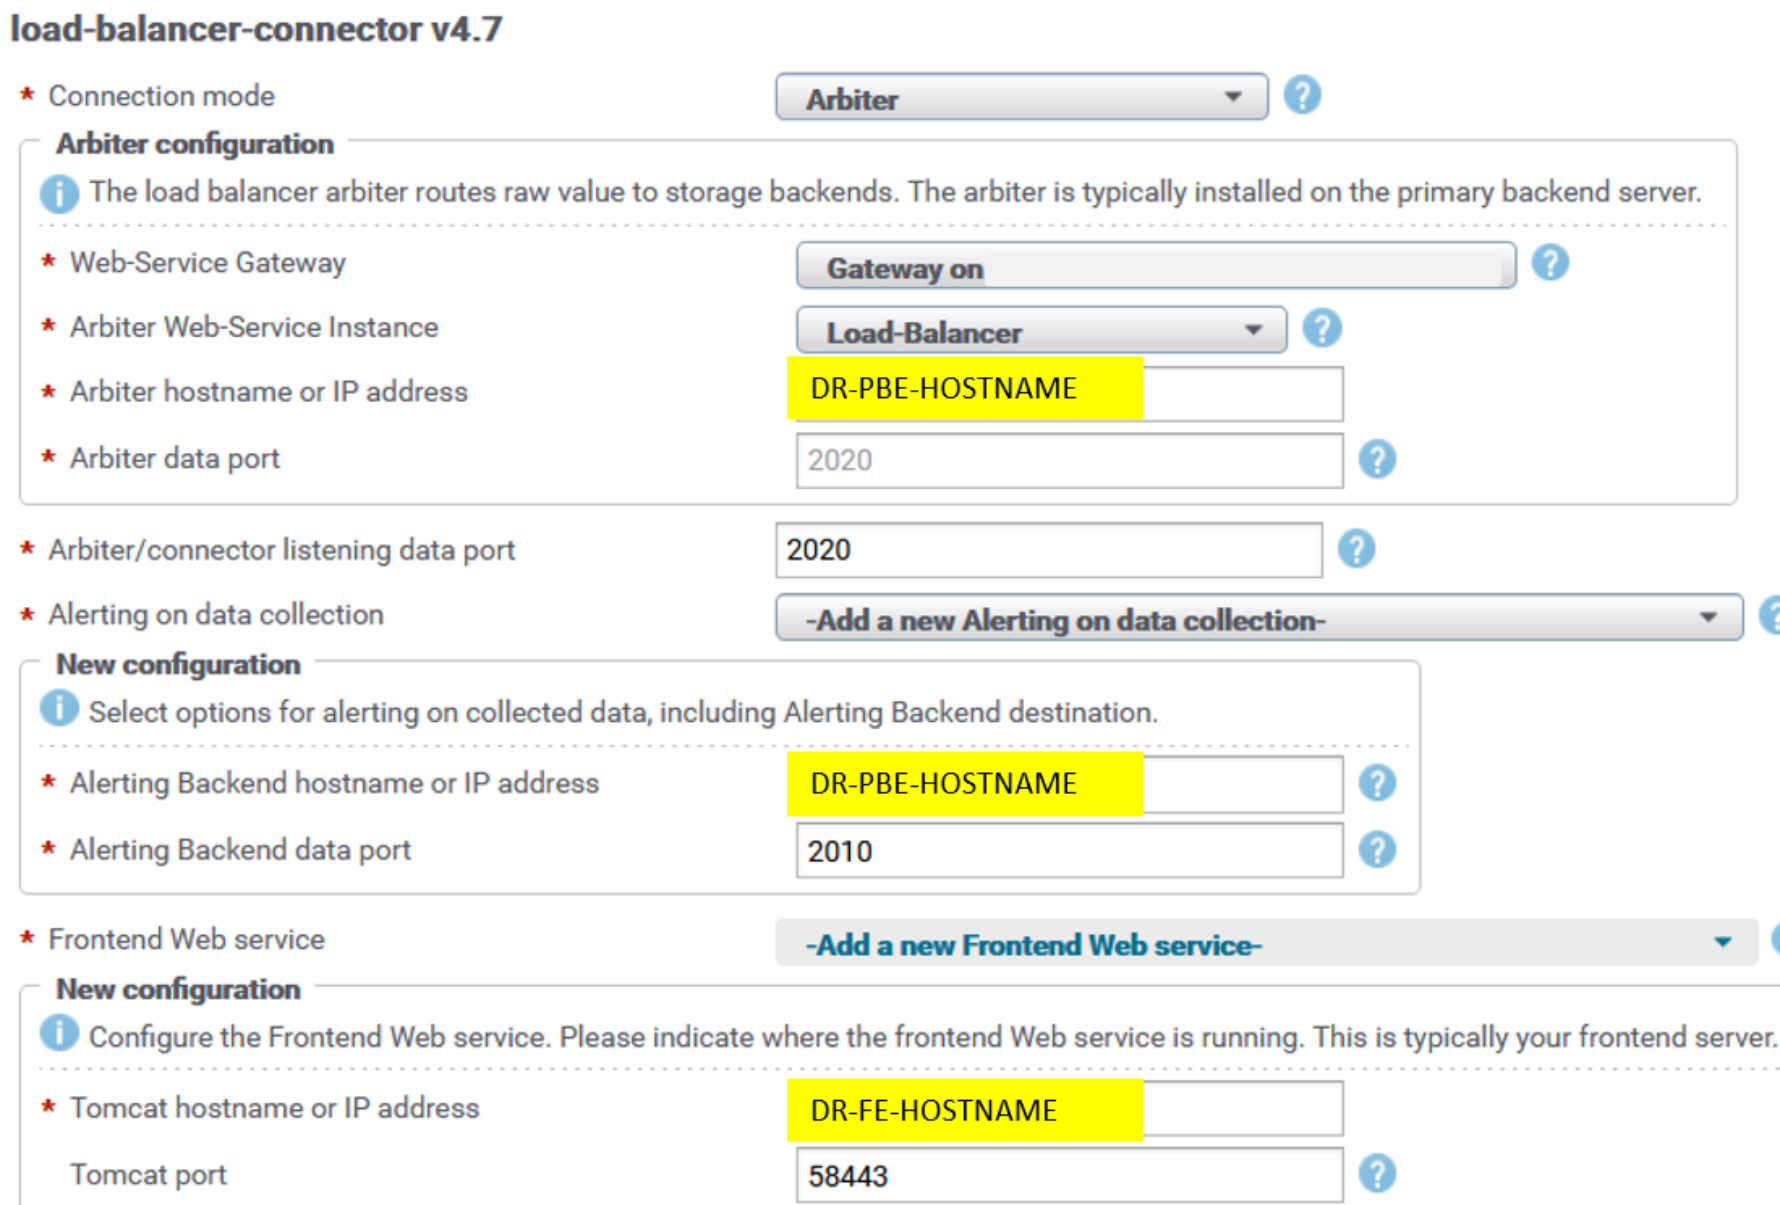
Figure 12. LBC reconfiguration UI DR
- Set the DR-PBE-HOSTNAME for Arbiter (LBA) hostname.
The frontend web service hostname (DR-FE-HOSTNAME) and alerting backend hostname (DR-PBE-HOSTNAME) were already modified in previous steps for all solution pack collection blocks and LBCs; thus, you do not have to modify it again for LBC.
After all LBCs and all SP collection blocks are reconfigured with the DR site hostnames, end users can now switch to the DR site frontend servers.
The following figure shows the SRM components activated on the DR site, with all PROD site components in failed mode.
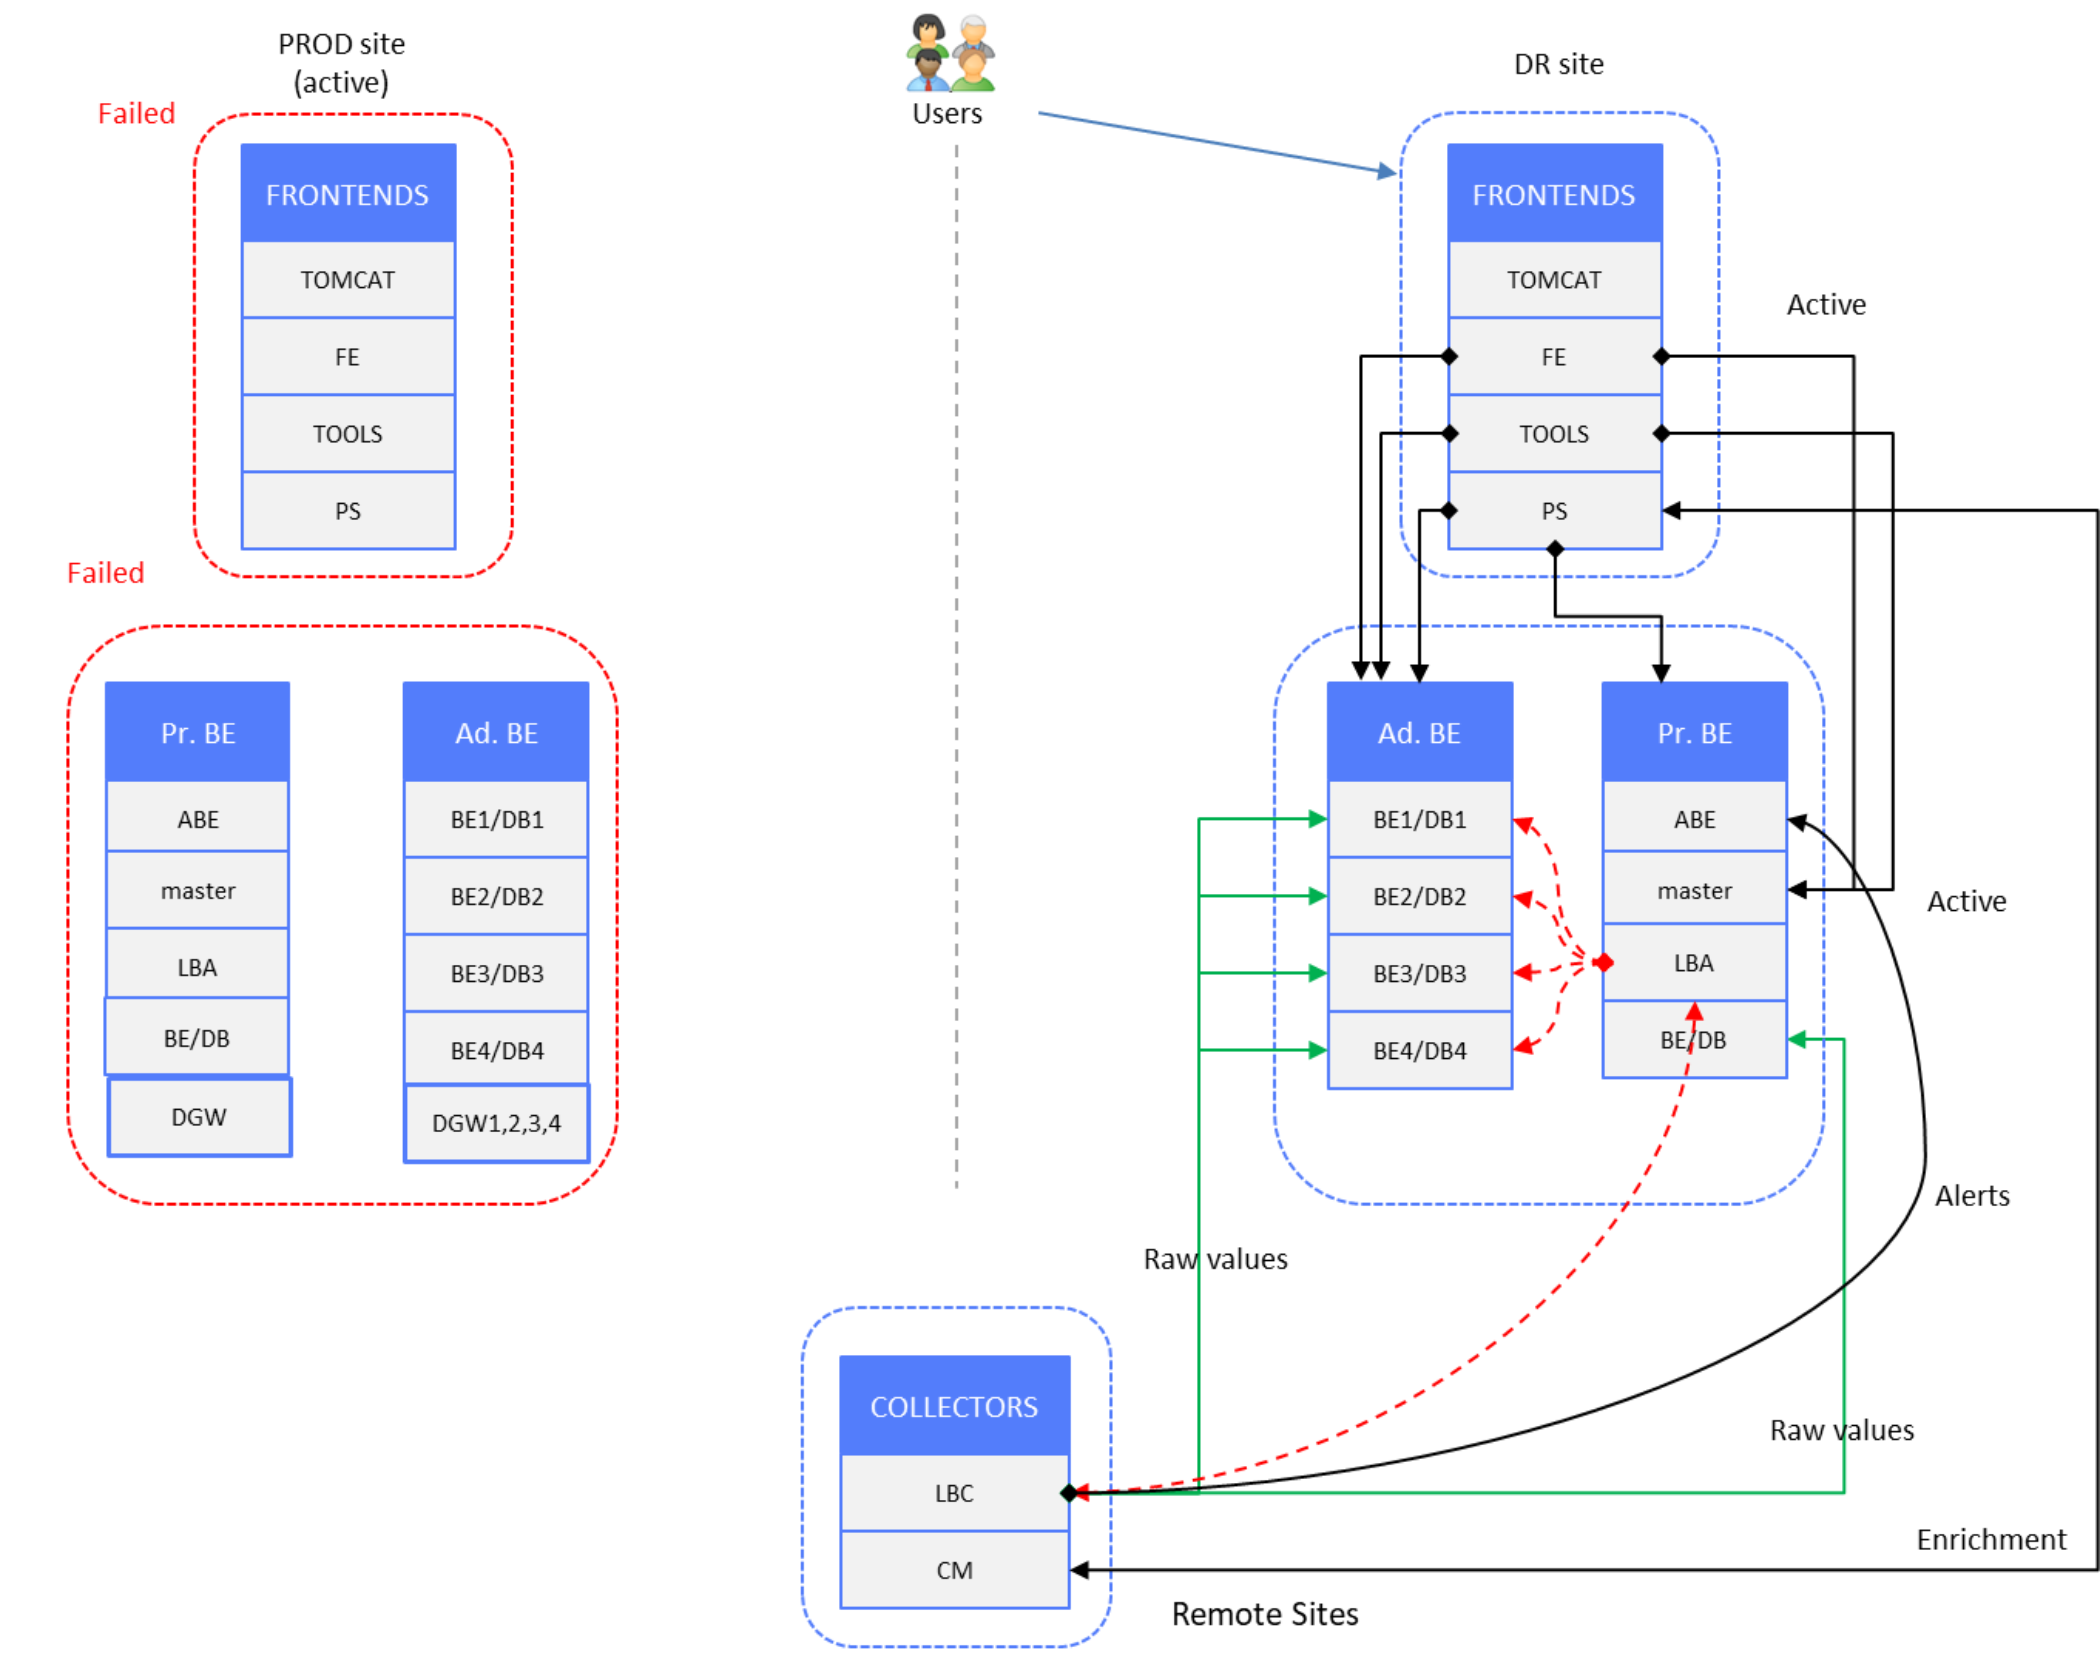
Figure 13. Time-series and alerts data – DR site active, PROD site failed
Data restore
Following the preceding failure scenarios, when PROD site components are restored (that is, the servers are up and running), databases on the PROD site servers must be synchronized with the respective databases from the DR site.
All services on PROD site servers are still stopped.
Restore data as follows:
- Synchronize the PROD site databases with the DR site databases.
Because databases on the PROD site did not receive any data during the failure, they must be synchronized with databases from the active (DR) site. Because we have 1:1 database mirroring between the PROD and DR sites, database files replication can be performed.
It is assumed that each one of the two sites has a backup procedure implemented and running periodically. The recommended way to restore database files on the PROD site is to copy the latest DR site backup of the following file system under the same path on PROD site’s PBE and Additional Backend servers:
/opt/APG/Databases/MySQL/Default/data/<TIMESERIES-DB-INSTANCE>/*
where <TIMESERIES-DB-INSTANCE> can be apg, apg1, apg2, apg3, apg4.
- After the files are copied to the PROD site servers, restart:
- The mysql service on PROD PBE
- Each of the PROD ad Additional Backend servers
- Each of the respective backend instances
- With LBA collector-manager still stopped, run the following script to get LBA on the PROD PBE server to calculate new load-factors from all backend instances:
PROD-PBE-HOSTNAME# /opt/APG/Collecting/Load-Balancer/Load-Balancer/bin/load-balancer-reconstruction.sh /opt/APG/Collecting/Load-Balancer/Load-Balancer/conf/arbiter.xml /opt/APG/Collecting/Load-Balancer/Load-Balancer/conf/reconstruction.xml
- Start LBA collector-manager and the remaining services on the PROD site PBE server.
- Start all services on the PROD site frontend servers.
- Perform the following reconfiguration actions, as described in Failure scenarios:
- Reconfigure collection blocks of all solution packs to PROD frontend web service hostname
- Reconfigure collection blocks of all LBC and health solution pack to PROD alerting backend hostname
- Reconfigure LBCs with PROD LBA hostname
After all these blocks are reconfigured with their proper PROD site hostnames, end users can switch to the PROD site frontend servers.
- Stop all services on DR site frontend servers.
- Check for errors in log files and resolve any issues.
The preceding steps ensure that the PROD site databases are synchronized with the DR site. However, there will be data gap from the moment of the last DR site backup until data collection starts again on the PROD site.
For the architecture diagram, see Figure 4.
Events
The following figure shows the events data components:
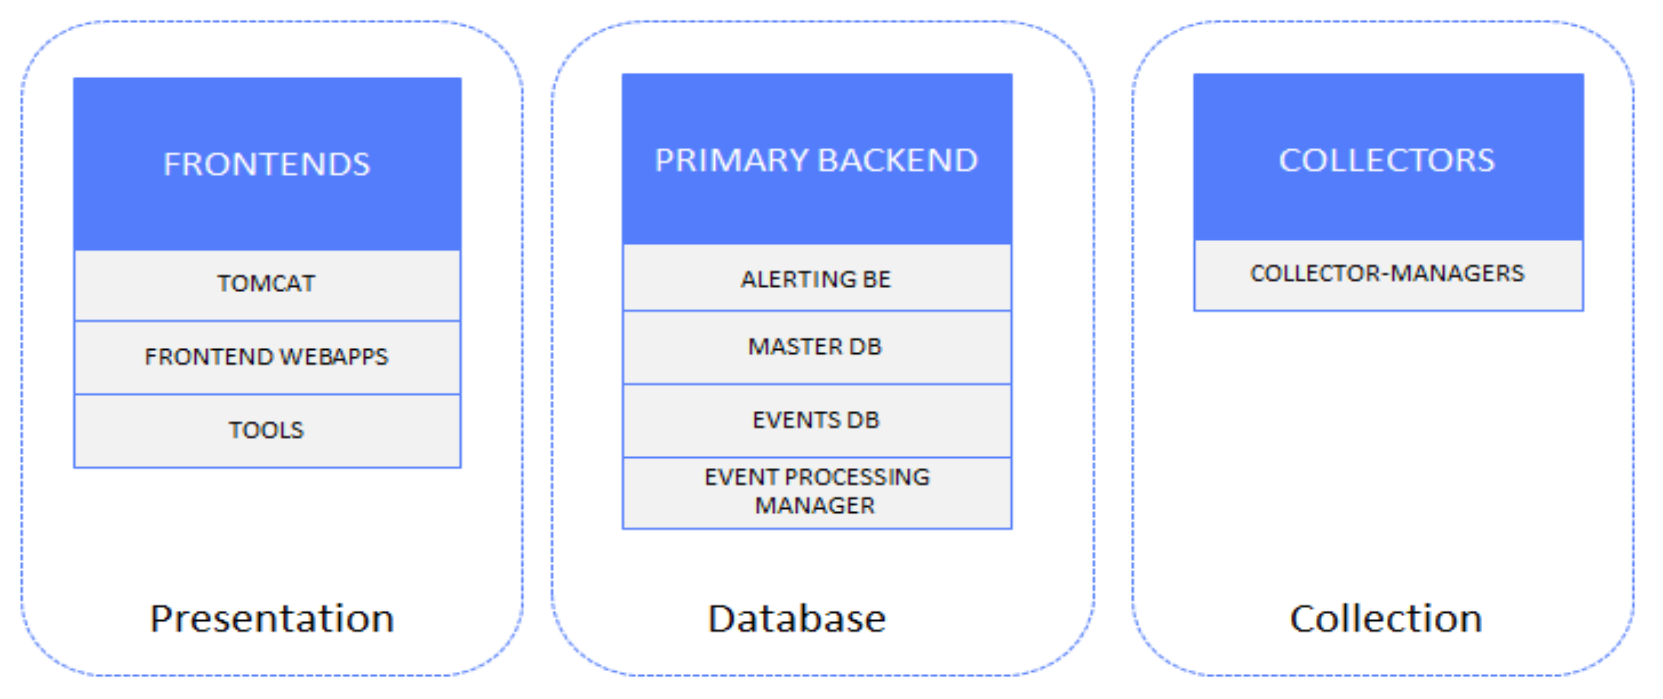
Figure 14. Events data solution components
Setup
The following figure shows a “normal operation” scenario of an active PROD site. End users are connected to PROD site frontend servers, and DR site PBE components remain in active mode.
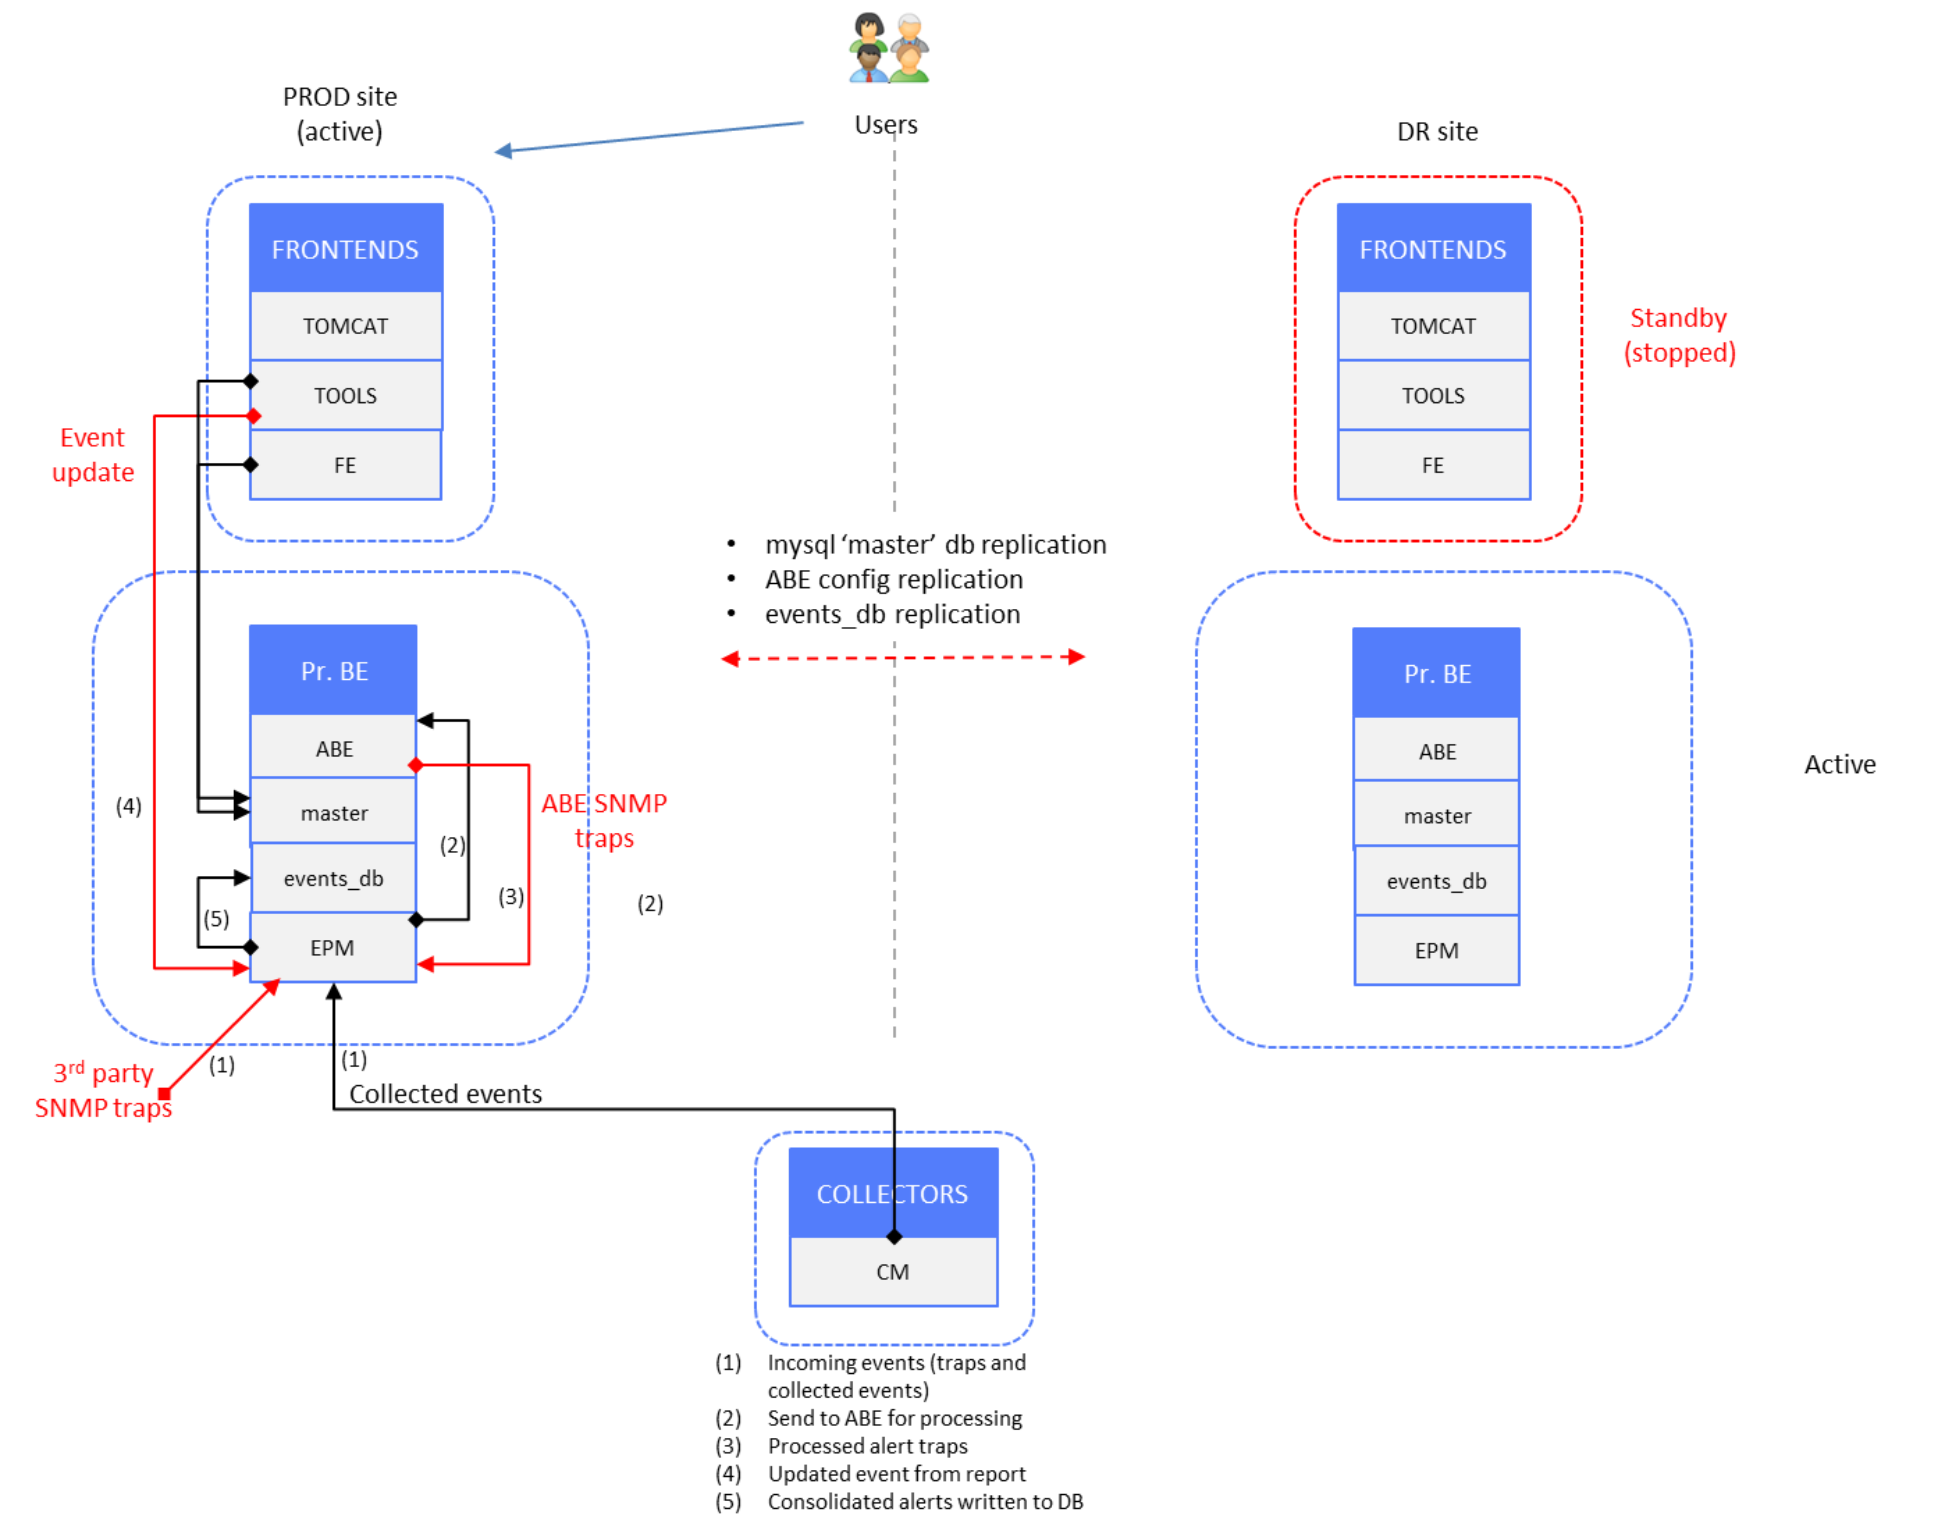
Figure 15. Events data – PROD site active, DR site Primary Backend active
In addition to the mysql master database replication between PROD and DR PBE servers, the events database is also replicated to DR site. There is a scheduled job for scp of directory /opt/APG/Databases/MySQL/Default/data/events/*, so that when SRM fails over to the DR site, the events database is up to date.
The following content is an example of the PROD PBE crontab file for the root user (crontab -e), which assumes that ssh keys are in place on PROD and DR servers. (For the procedure to enable ssh authentication with keys, see Appendix A: mysql master database replication.)
0 21 * * * scp -rp /opt/APG/Databases/MySQL/Default/data/events/ root@DR-PBE-HOSTNAME:/opt/APG/Databases/MySQL/Default/data/events/ && ssh DR-PBE-HOSTNAME "chown -R apg:apg /opt/APG/Databases/MySQL/Default/data/events/"
Failure scenarios
Two failure scenarios affect raw events reception and processing on the PROD site PBE server and end users switching to the DR site:
- PROD site disaster (frontend and backend servers affected)
- Failure of frontend or PBE server or both on PROD site
NOTE: In both cases, there is either observation of the failure by administrators or end users, or there is third-party application that monitors availability/reachability of relevant servers.
Event data loss will occur in both cases because the following components are sitting on the PBE server:
- EPM Alert-Consolidation component, which is main ingress point for raw events and egress point for consolidated alerts
- Alerting backend, which processes raw events and transforms them into SNMP trap alerts
Failure of a frontend server only affects end users who must switch to the DR site frontend when the DR PBE is up and running.
- Start all services on DR frontends.
For information about configuring master database resources, see Failure scenarios.
- Reconfigure event sources to send events to the DR site’s PBE server.
Event sources CMs on Collector servers (hostname: 2040) and Generic-Event-Sender tool on DR frontend servers (hostname: 2042) must be reconfigured with the proper sockets of the DR PBE server, while third-party SNMP trap sources must be reconfigured to send SNMP traps to DR PBE port 2041 (hostname:2041).
- Reconfigure the Data Collection solution pack block (or Compliance Backend in the Configuration Compliance SP) from the DR frontend Admin UI.
The following solution packs send events data to port 2040 of PBE:
- Dell PowerVault
- Dell Unity/VNX
- Dell PowerScale (Isilon)
- Dell ECS
- Dell PowerFlex (ScaleIO)
- Dell XtremIO
- Dell Data Protection Advisor (DPA/iDPA)
- Configuration Compliance
The following figure is an example of Dell Unity/VNX (the other solution packs in the preceding list are similar):
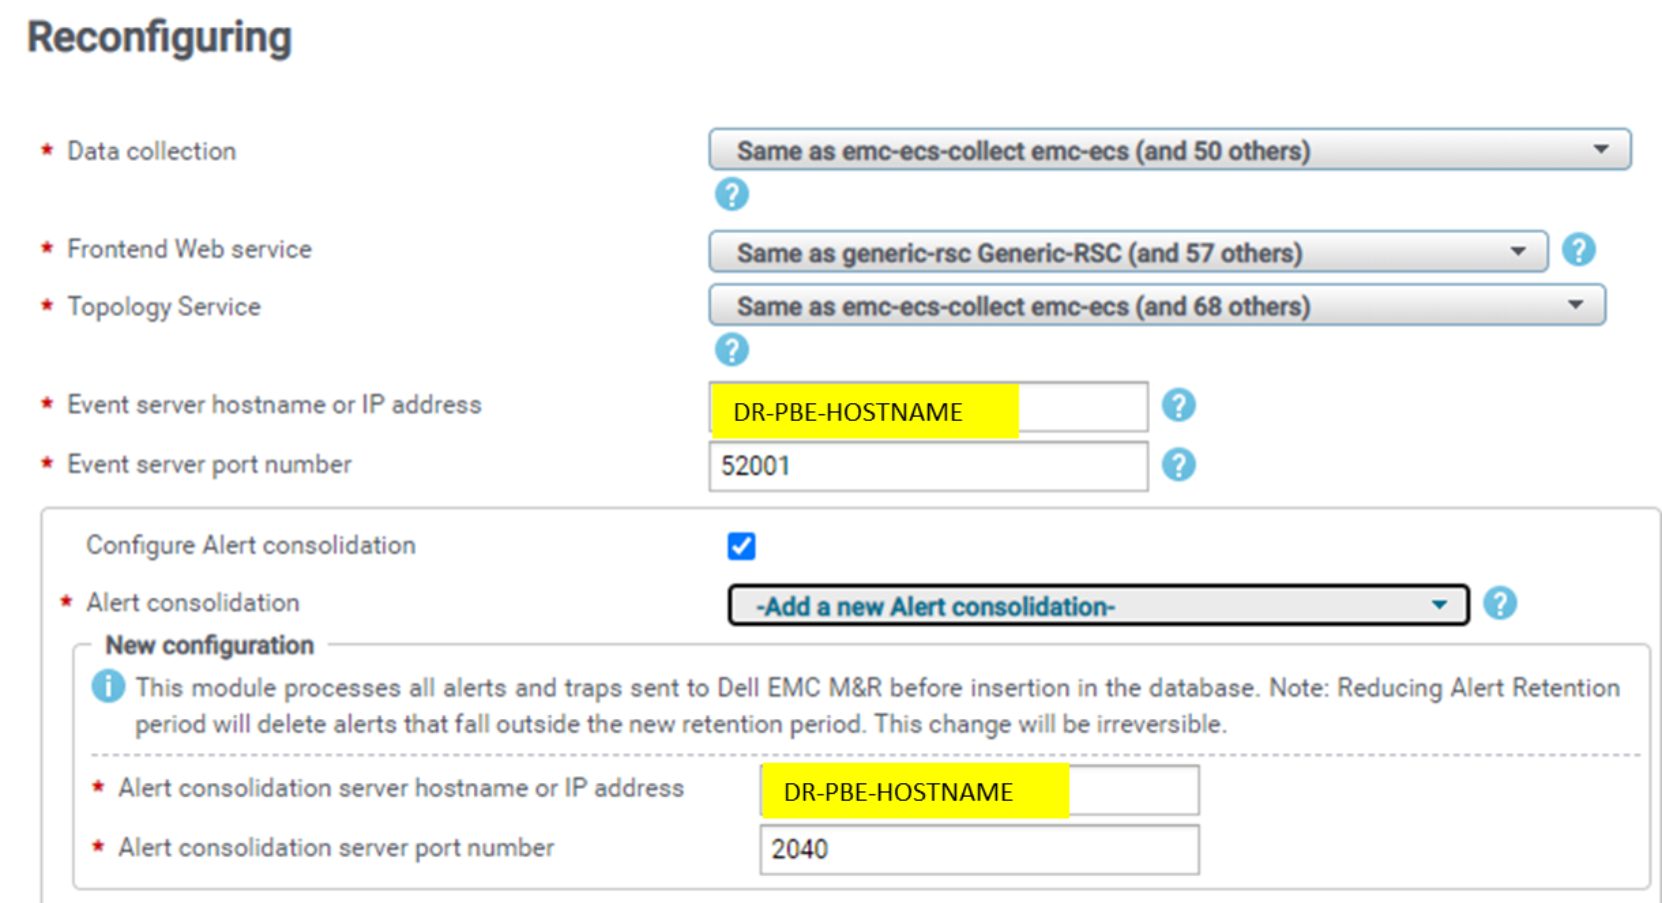
Figure 16. SP data collection block events config
The following solution packs that are collecting events and writing them directly to the events database on the PBE server have their PBE hostname modified to DR PBE:
- Dell Unity/VNX
- Dell Data Protection Advisor (DPA/iDPA)
- Cisco UCS
- VMware vSphere and vSAN
Here is example for the Dell Unity/VNX events solution pack block (the other solution packs in the preceding list are similar):
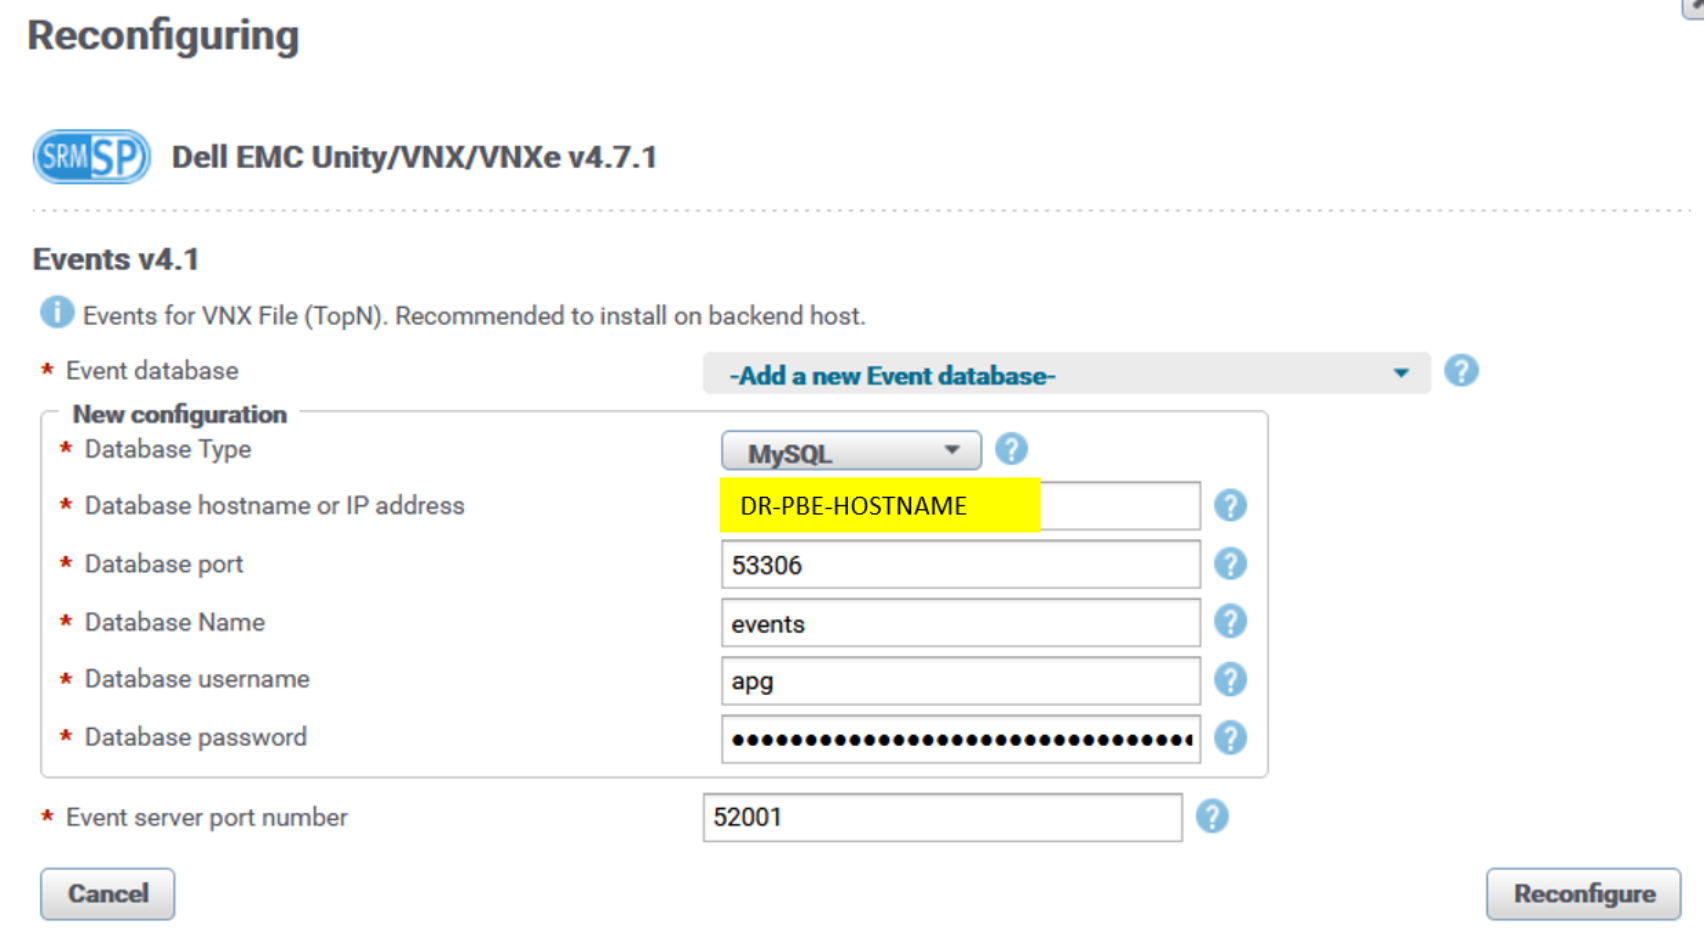
Figure 17. SP events block database configuration
- For binary deployments of SRM—not for vApp—modify the following configuration file:
/opt/APG/Custom/WebApps-Resources/Default/actions/event-mgmt/linux/conf
Update the file with the proper IP address of the DR PBE server on the DR site’s frontend servers. For example:
### For vApp distribution, this should get replaced automatically. For binary-based deployment, please change the value of 127.0.0.1 to the server where your alert consolidation is running
PRIMARYBACKEND=127.0.0.1
The PRIMARYBACKEND parameter is used as an attribute of command /opt/APG/Tools/Generic-Event-Sender/Default/bin/send-event.sh, which sends events to PBE port 2042.
End users can now switch to DR site frontend servers.
There will be events data loss on DR PBE server until all the previously described event sources are reconfigured.
The following figure shows SRM components activated on the DR site, with PROD site components all in standby mode (failure):
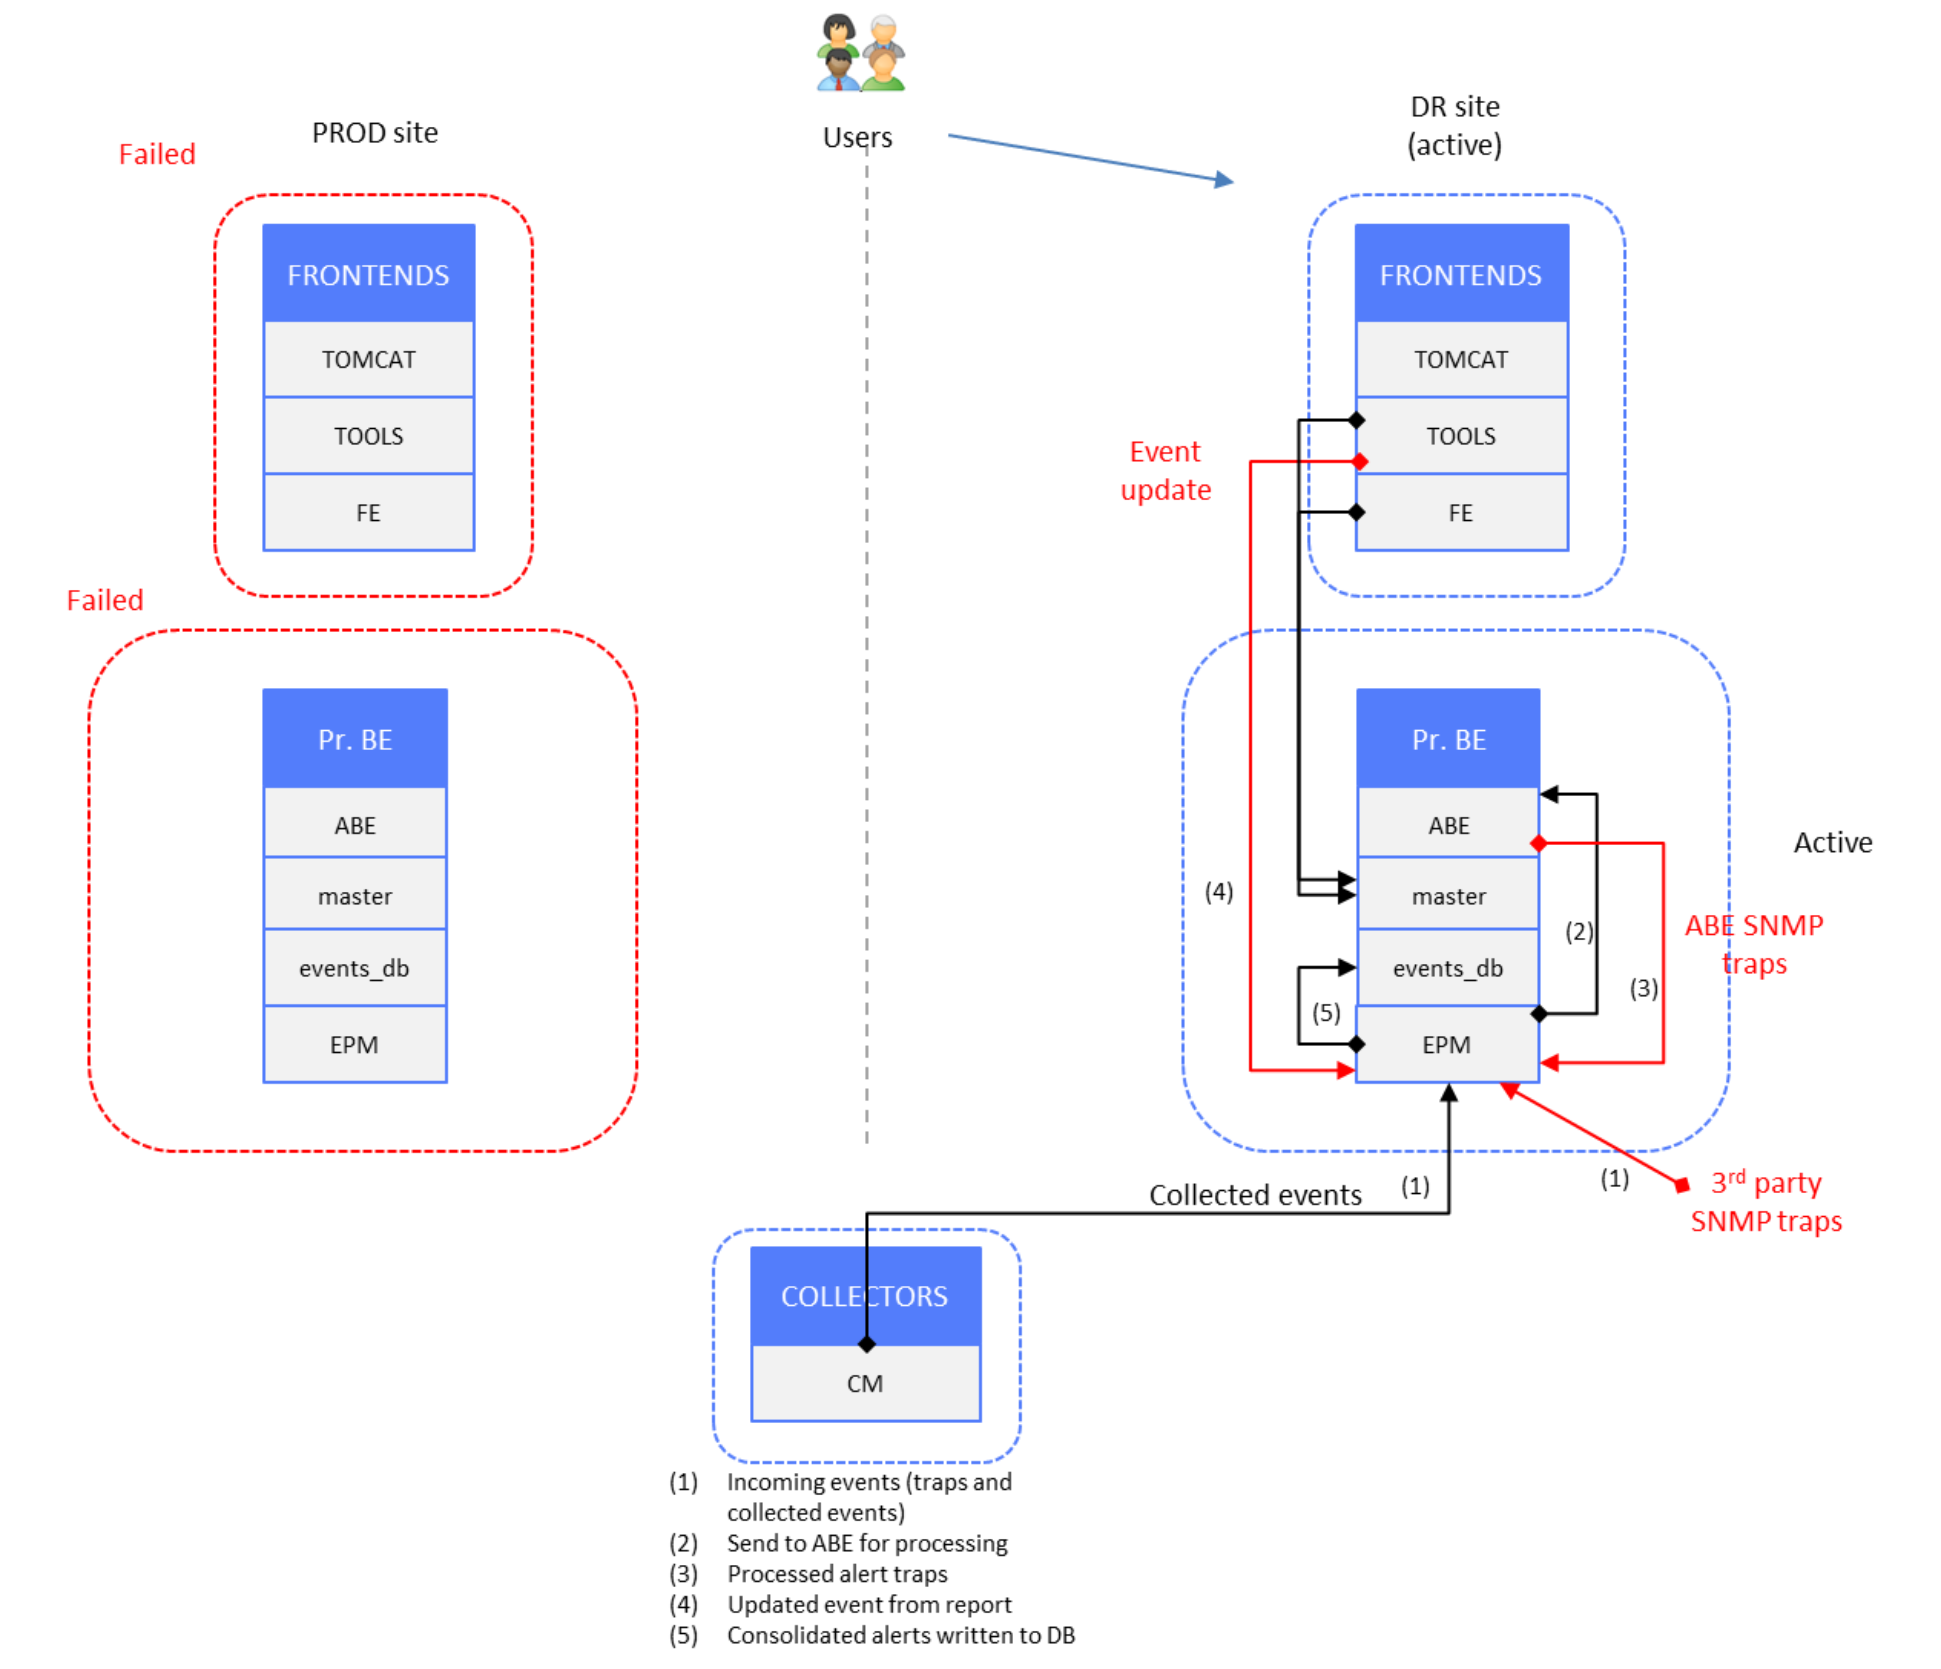
Figure 18. Events data – DR site active, PROD site failed
The following figure shows the preceding failure scenario in more detail:
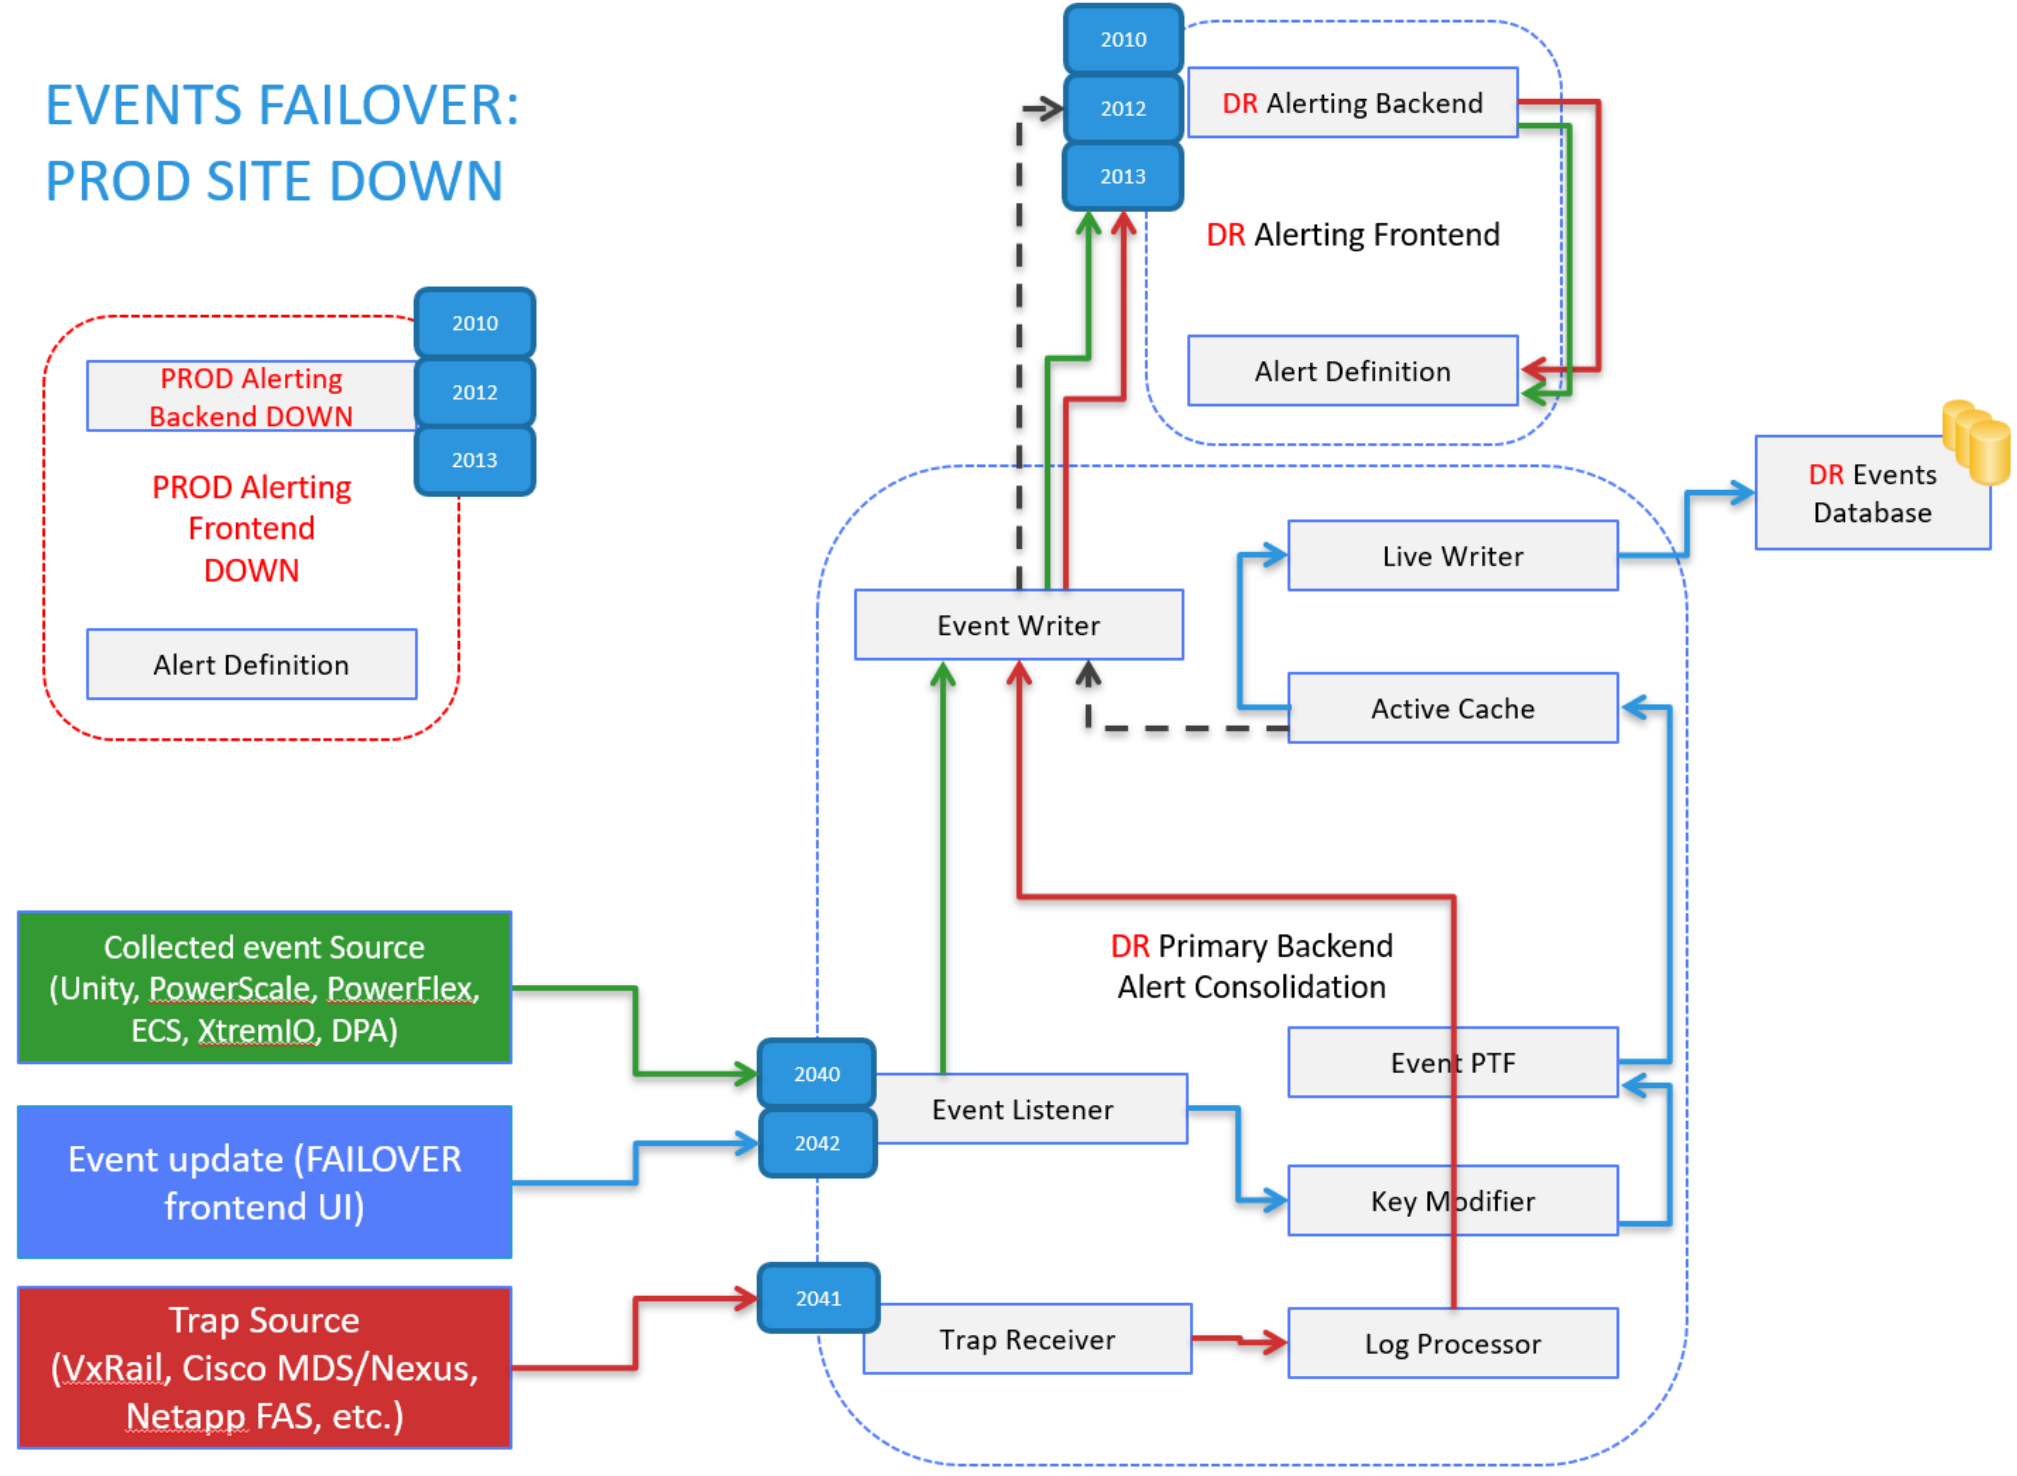
Figure 19. Events flow – DR site active - Alert-Consolidation
After an alert leaves the DR alerting backend, the alert flow is the same as in the “normal operation” scenario. The alert is sent by the alerting backend as an SNMP trap to its local trap receiver, consolidated through the log processor, and further written into the events database on the local DR PBE server:
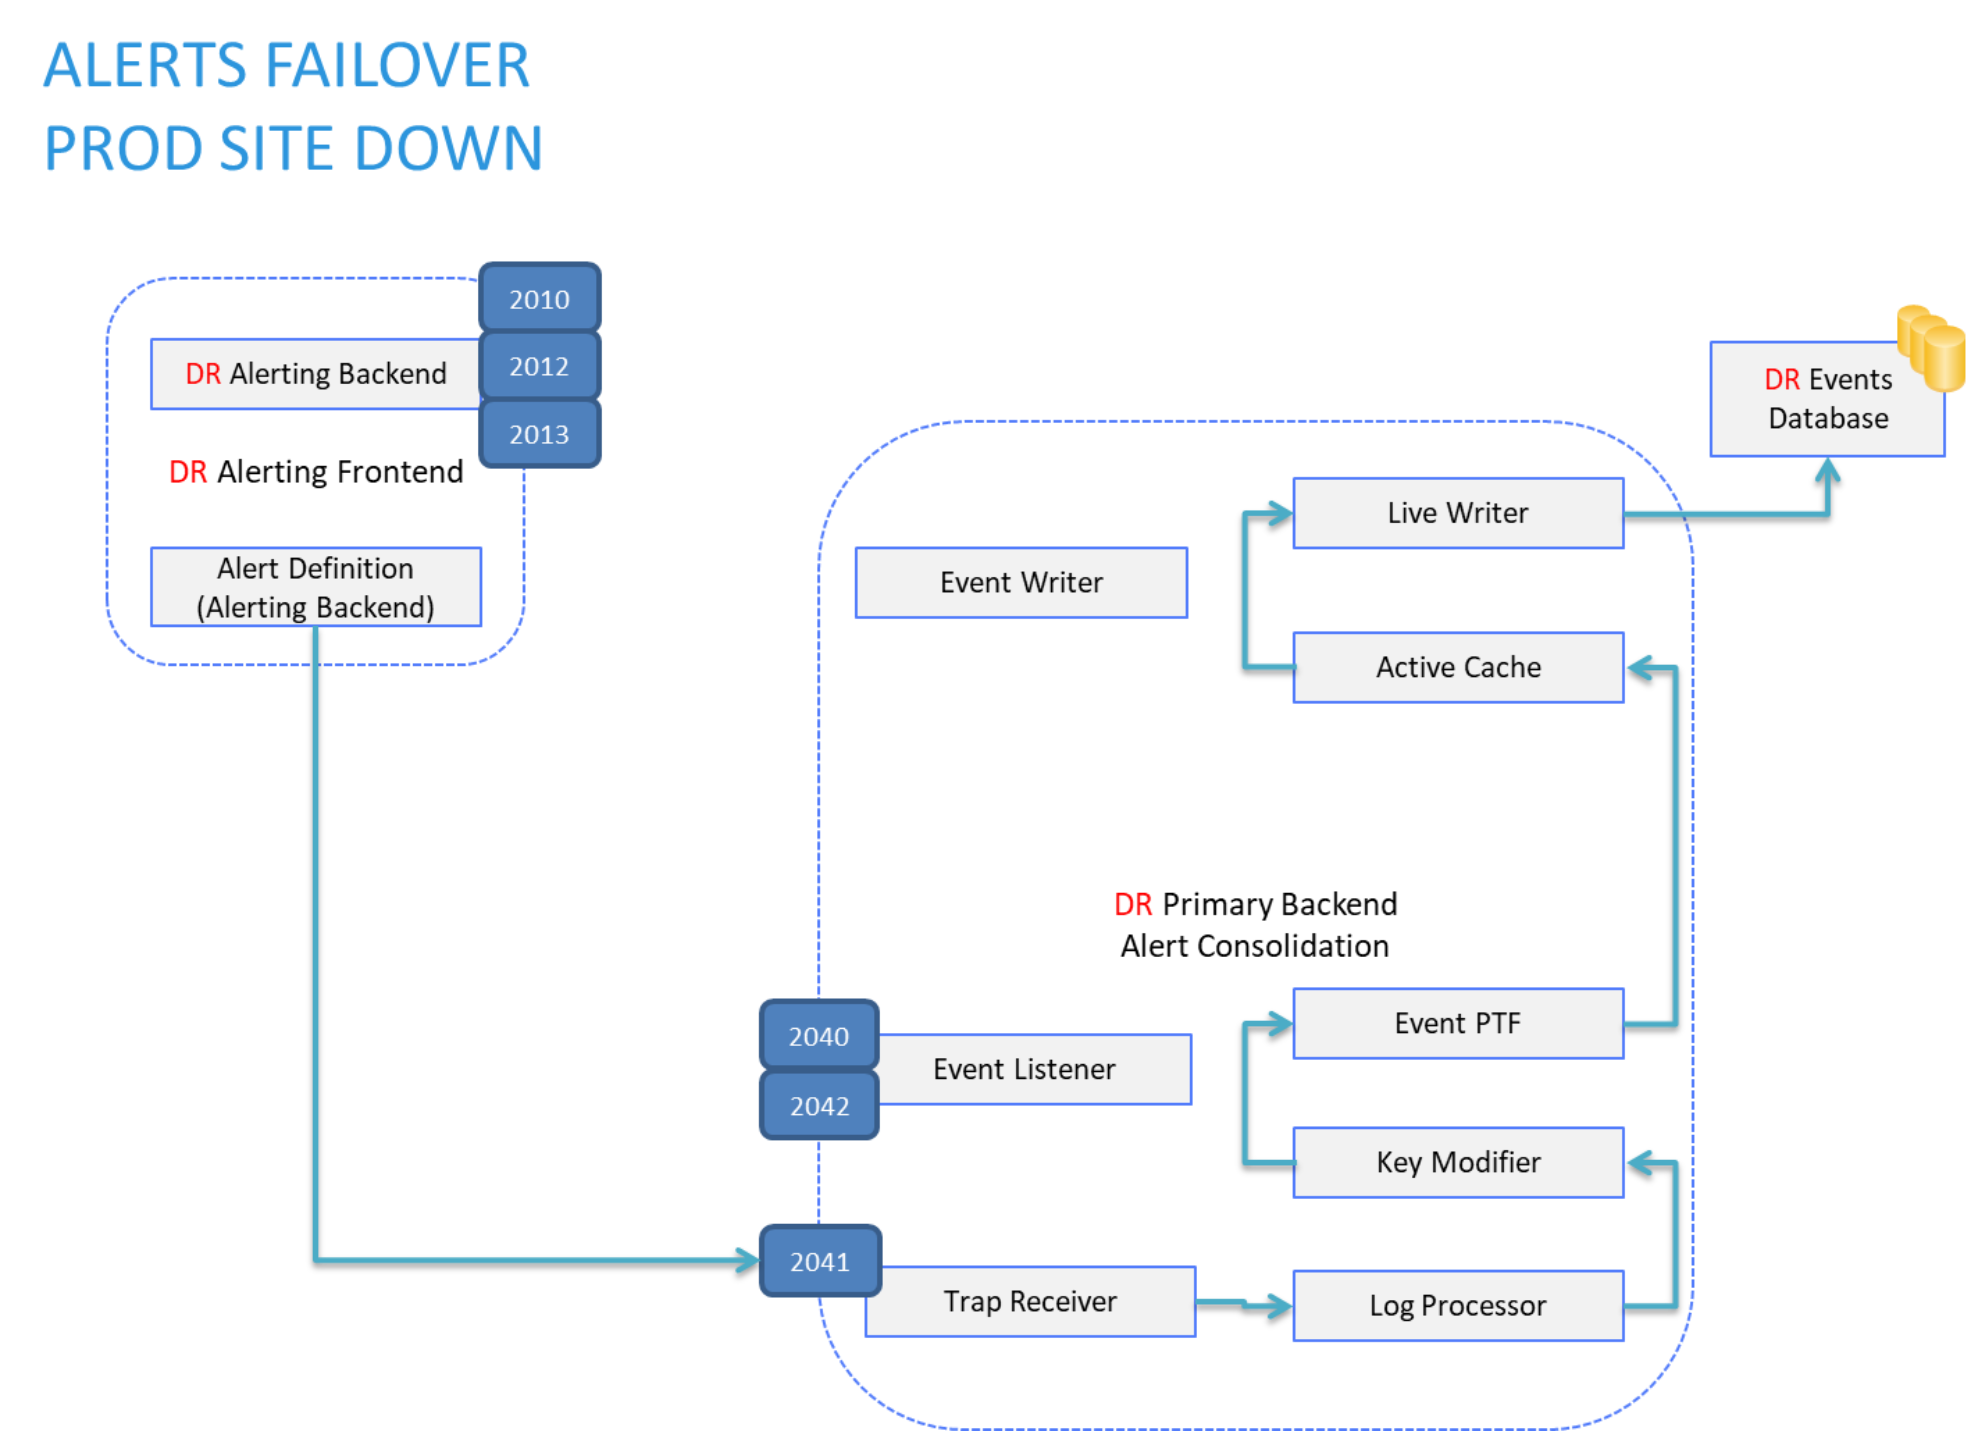
Figure 20. Alerts flow – DR site active - Alert-Consolidation
Data restore
When PROD site components are restored (that is, servers are up and running), the events database must be restored on the PROD site.
All services on PROD site servers are still stopped.
Restore data as follows:
- Synchronize the events database on the PROD site with the events database on the DR site.
Since the events database on the PROD site was not receiving any data during the failure, it must be synchronized with the events database on the active (DR) site. It is copied from DR PBE to PROD PBE server if ssh keys are generated on DR PBE and copied to PROD PBE server. (For the procedure to enable ssh authentication with keys, see Appendix A: mysql master database replication.)
DR-PBE-HOSTNAME# scp -rp /opt/APG/Databases/MySQL/Default/data/events/ root@PROD-PBE-HOSTNAME:/opt/APG/Databases/MySQL/Default/data/events/ && ssh PROD-PBE-HOSTNAME "chown -R apg:apg /opt/APG/Databases/MySQL/Default/data/events/"
- Using the PROD site frontend Admin UI, return the sockets configuration to the PROD site PBE server, following the procedure described in Failure scenarios.
- Restart the mysql service on PROD PBE and the EPM service instance Alert-Consolidation on the PROD PBE server.
- Start all services on PROD site frontend servers.
- Stop all services on DR site frontend servers.
- Check for errors in log files and resolve any issues.
The preceding steps ensure that the PROD site events database is synchronized with the DR site.
Topology
The following figure shows the topology data components:
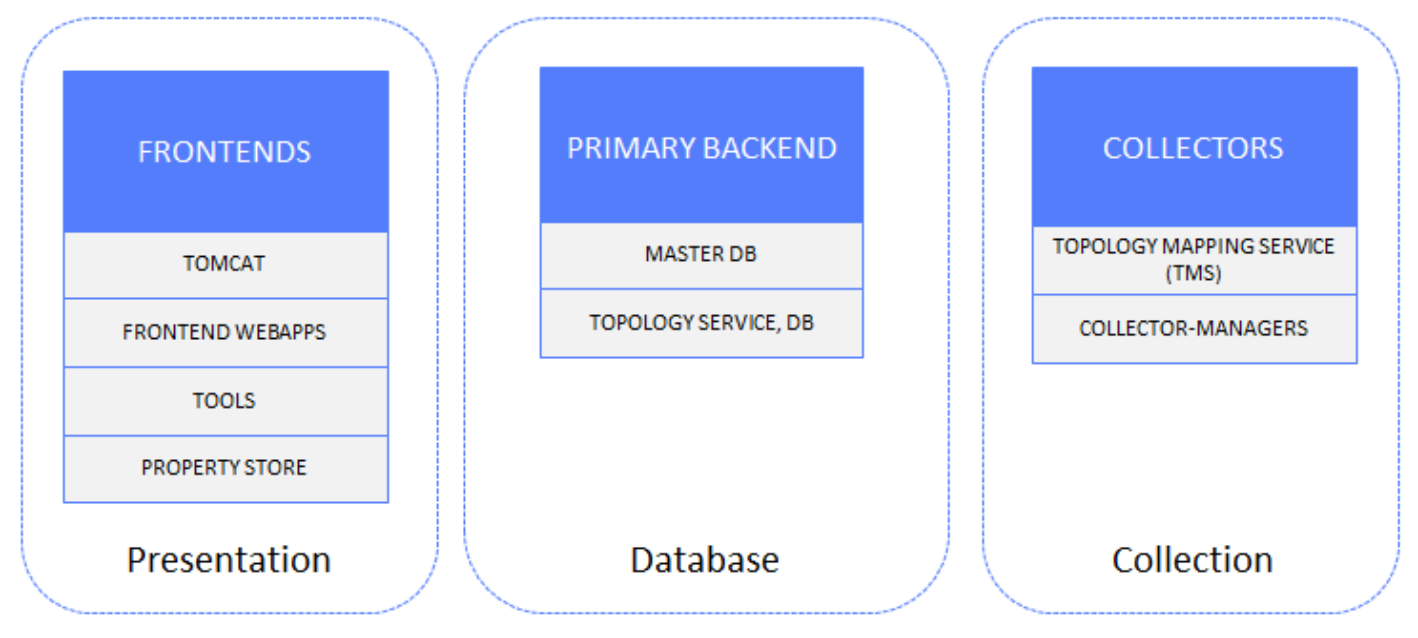
Figure 21. Topology data solution components
Setup
In the following “normal operation” scenario of the active PROD site, end users are connected to PROD site frontend servers. DR site components except the PBE server (TS component) are in standby mode (stopped).
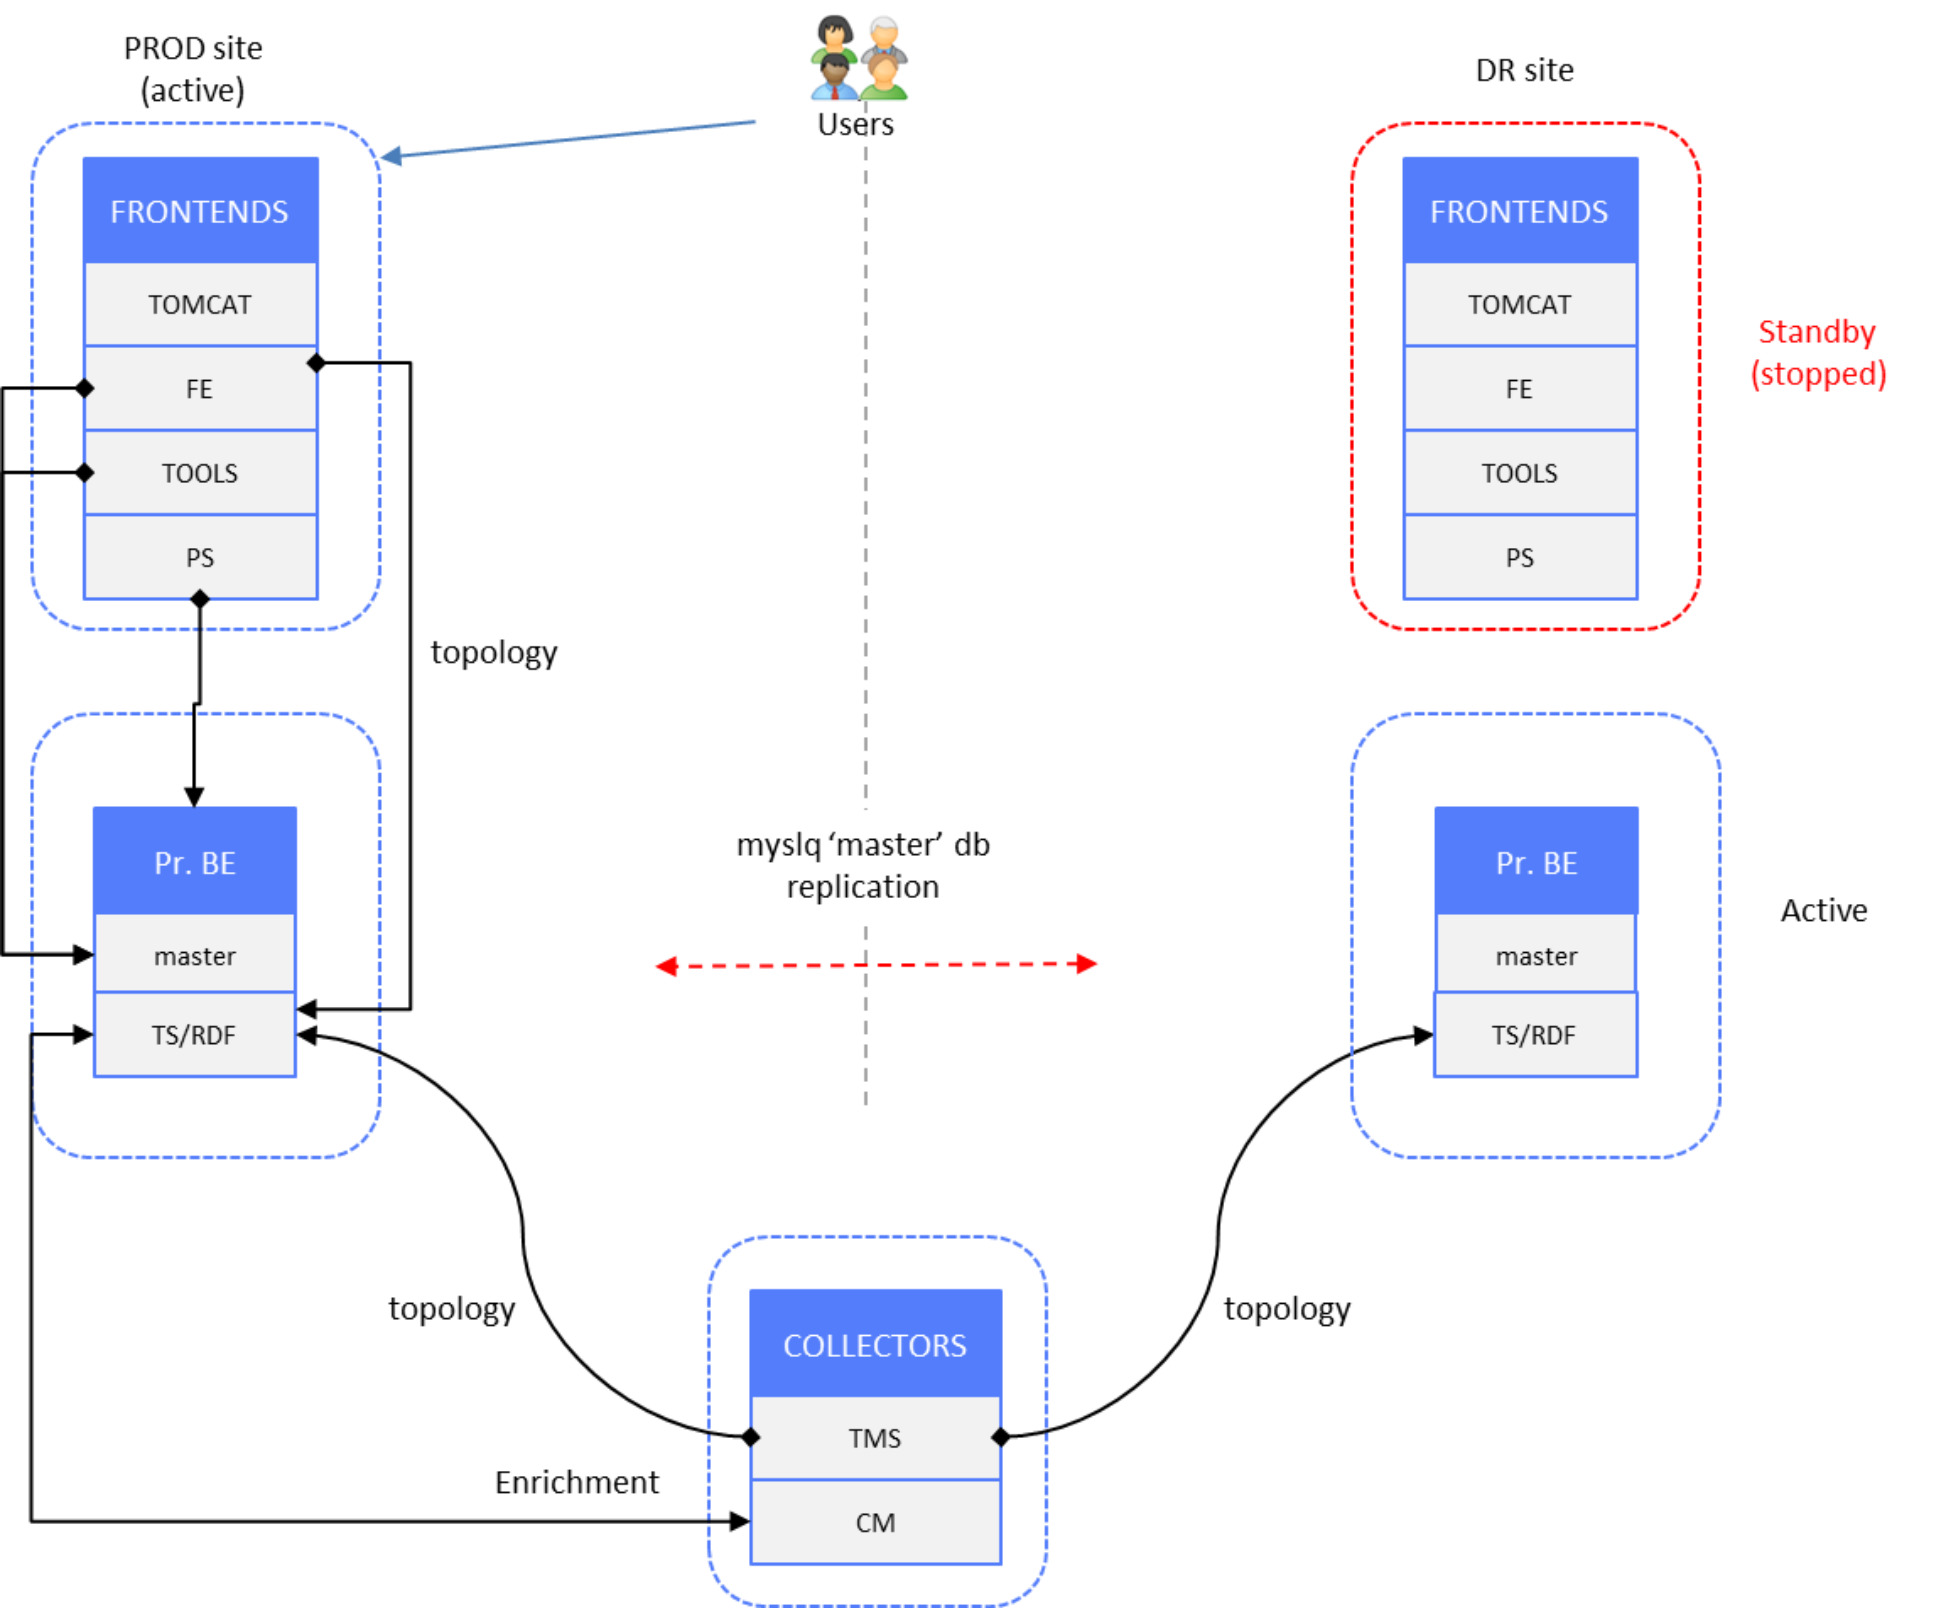
Figure 22. Topology data – PROD site active, DR site Topology Service active
Topology data redundancy is achieved by splitting the topology data stream at the collection layer toward PROD and DR site instances of Topology-Service.
Configuration details
The Topology-Mapping-Service (TMS) component on Collector servers receives a raw values stream from underlying CMs and pushes the topology data stream upward to the Topology-Service instance on the PBE server.
In the following example from the SRM Admin UI Central Configuration Repository, applicable solution pack collection components are listed under the configuration entries for Topology-Service:
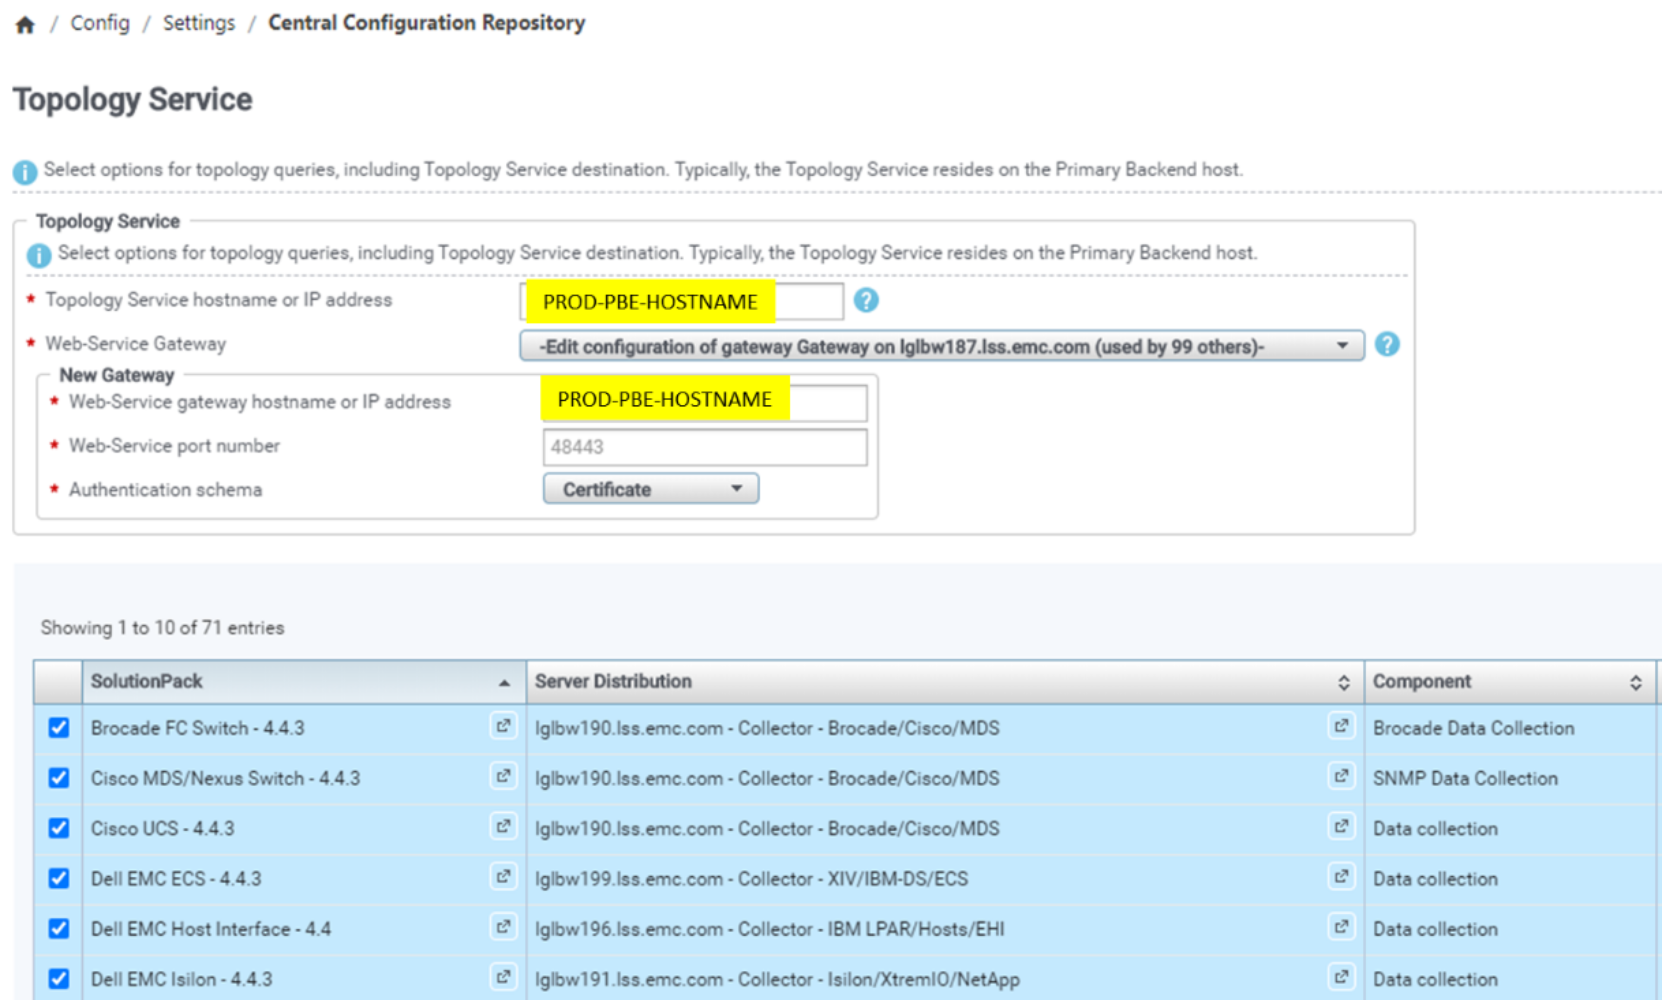
Figure 23. SP data collection block Topology-Service configuration PROD
This information is present by default in the following configuration file on each of the Collector servers:
/opt/APG/Backends/Topology-Mapping-Service/Default/conf/tmsconfig.xml
<?xml version="1.0" encoding="UTF-8"?>
<config>
<host>PROD-PBE-HOSTNAME</host>
<port>48443</port>
<username>value</username>
<password>value</password>
</config>
To enable a second topology data stream push from collectors’ TMS instances toward the DR site TS, one more configuration file must be created under the same instance of TMS on each of the Collector servers, with the hostname or IP address of the DR site PBE server:
/opt/APG/Backends/Topology-Mapping-Service/Default/conf/tmsconfig-DR.xml
<?xml version="1.0" encoding="UTF-8"?>
<config>
<host>DR-PBE-HOSTNAME</host>
<port>48443</port>
<username>value</username>
<password>value</password>
</config>
Upon setup of this configuration file, restart TMS service on each of the Collector servers.
The preceding configurations ensure that topology RDF stores are synchronized between the PROD and DR sites.
Configuration for the PROD site frontend webapp related to access to Topology-Service is as follows:
APG.xml (PROD site frontend servers)
<!--
The Topology-Service cluster resources. Define one entry per node of the cluster.
-->
<Resource cluster="Default" name="topo-svc/default"
type="com.watch4net.apg.v2.gui.report.topomap.configuration.data.TopoServiceResource" factory="org.apache.naming.factory.BeanFactory"
url="https://PROD-PBE-HOSTNAME:48443/Backends/Topology Service/Default/"
sslValidation="false"/>
Failure scenarios
There are two failure scenarios that affect topology data reception and processing on the PROD site’s PBE server, with end users switching to the DR site:
- PROD site disaster (frontend and backend servers affected)
- Failure of frontend or PBE server or both on PROD site
Note: In both cases, there is either observation of the failure by administrators or end users, or there is third-party application that monitors availability/reachability of relevant servers.
In either of these failure scenarios, users must switch to DR site frontends, which means that frontends will access the DR site’s Topology-Service on the PBE server. The Topology RDF store on the DR site was synchronized with the RDF store on the PROD site up to the moment of failure.
Configuration for the DR site frontend webapp for access to Topology-Service is as follows:
APG.xml (DR site frontend servers)
<!--
The Topology-Service cluster resources. Define one entry per node of the cluster.
-->
<Resource cluster="Default" name="topo-svc/default"
type="com.watch4net.apg.v2.gui.report.topomap.configuration.data.TopoServiceResource"
factory="org.apache.naming.factory.BeanFactory"
url="https://DR-PBE-HOSTNAME:48443/Backends/Topology-Service/Default/"
sslValidation="false"/>
Upon a failure, services on the DR frontend servers must be started.
The following figure shows the SRM components activated on the DR site, with the PROD site components all in standby mode (failure).
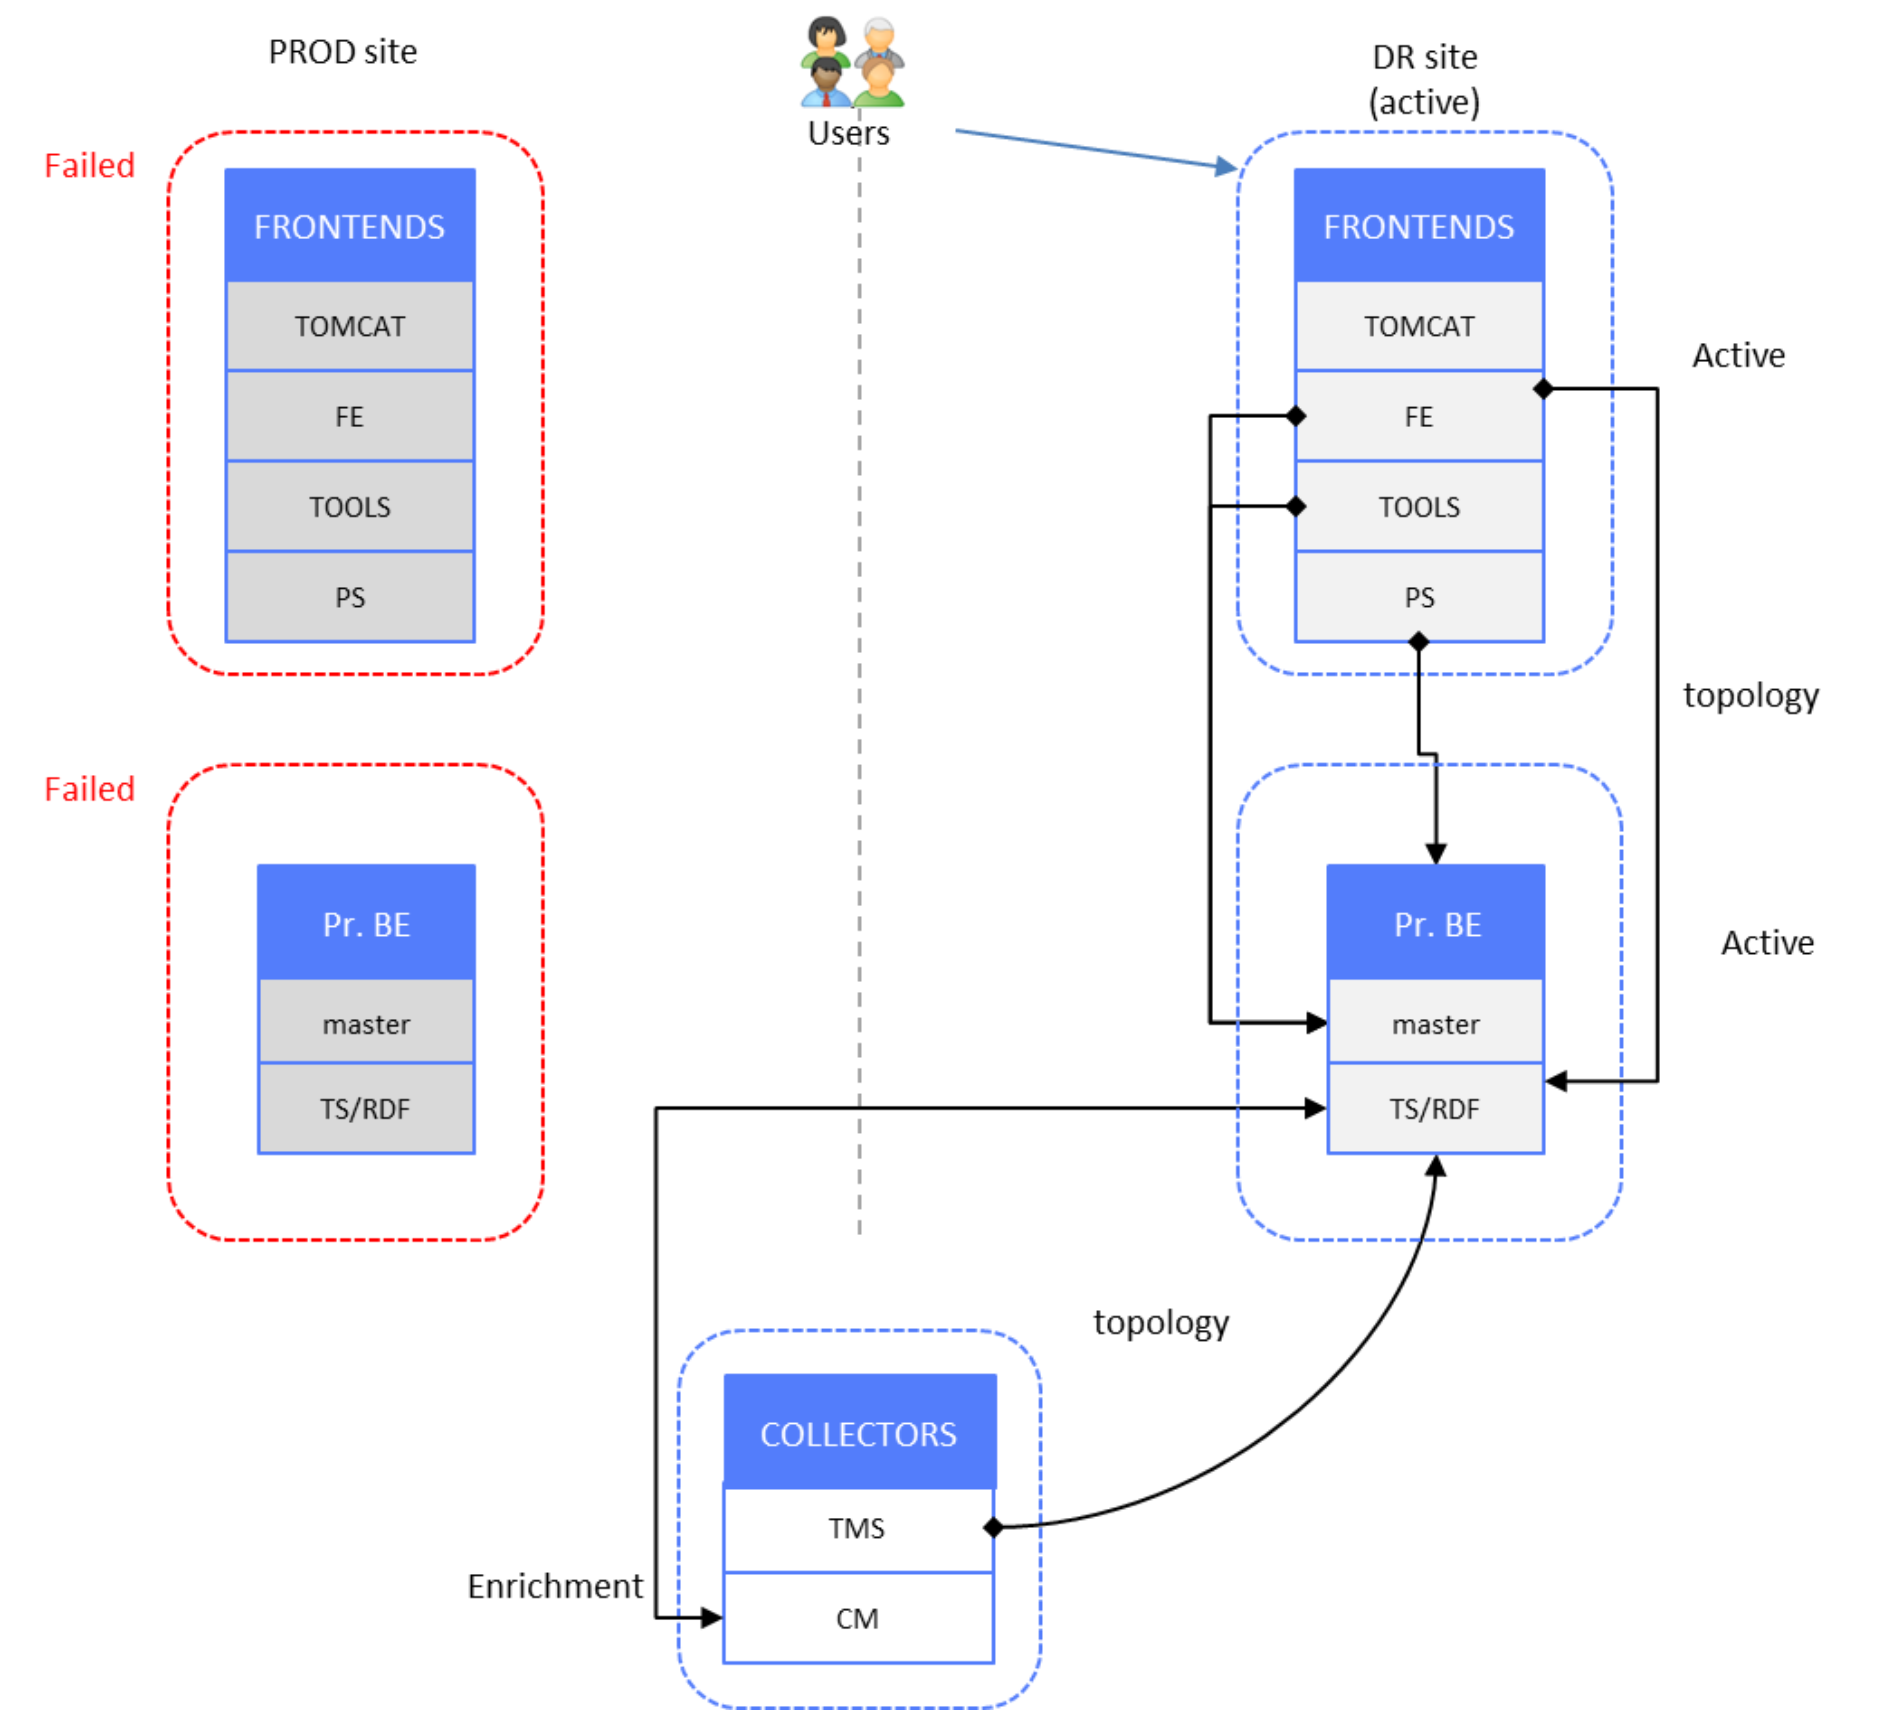
Figure 24. Topology data - DR site active, PROD site failed
If any of collectors’ TMSs detect that the DR site TS is not synchronized, it sends its full absolute dataset to TS. After initial resynchronization between TMS and TS, TMS continues sending topology data changesets to TS.
Data restore
Following a failure scenario affecting topology data reception and processing, when PROD site components are restored (that is, servers are up and running), the Topology RDF store must be restored on the PROD site.
All services on PROD site servers are still stopped.
Restore data as follows:
- Start services on the PROD site PBE server.
- Start all services on PROD site frontend servers.
- Stop all services on DR site frontend servers.
- Check for errors in log files and resolve any issues.
Collectors’ TMSs will detect that the PROD site TS is not synchronized, so each TMS will send its full absolute dataset to TS. After initial resynchronization between each TMS and TS, TMS will continue sending topology data changesets to TS. In this way, the Topology RDF store on the PROD site has the latest collected data, so PROD site frontends can access and use the data in reports.