
Observability
Observability
-
When configuring hosts and volumes in PowerStore Manager, performance metrics for these are intuitive and easy to find. These individual metrics are a component of PowerStore appliance metrics. Overall appliance performance can also be viewed to determine overall system utilization and observe possible limits. Overall appliance and individual node performance can be viewed in the Hardware section on the Performance tab. Scrolling down in the view will reveal performance by node.
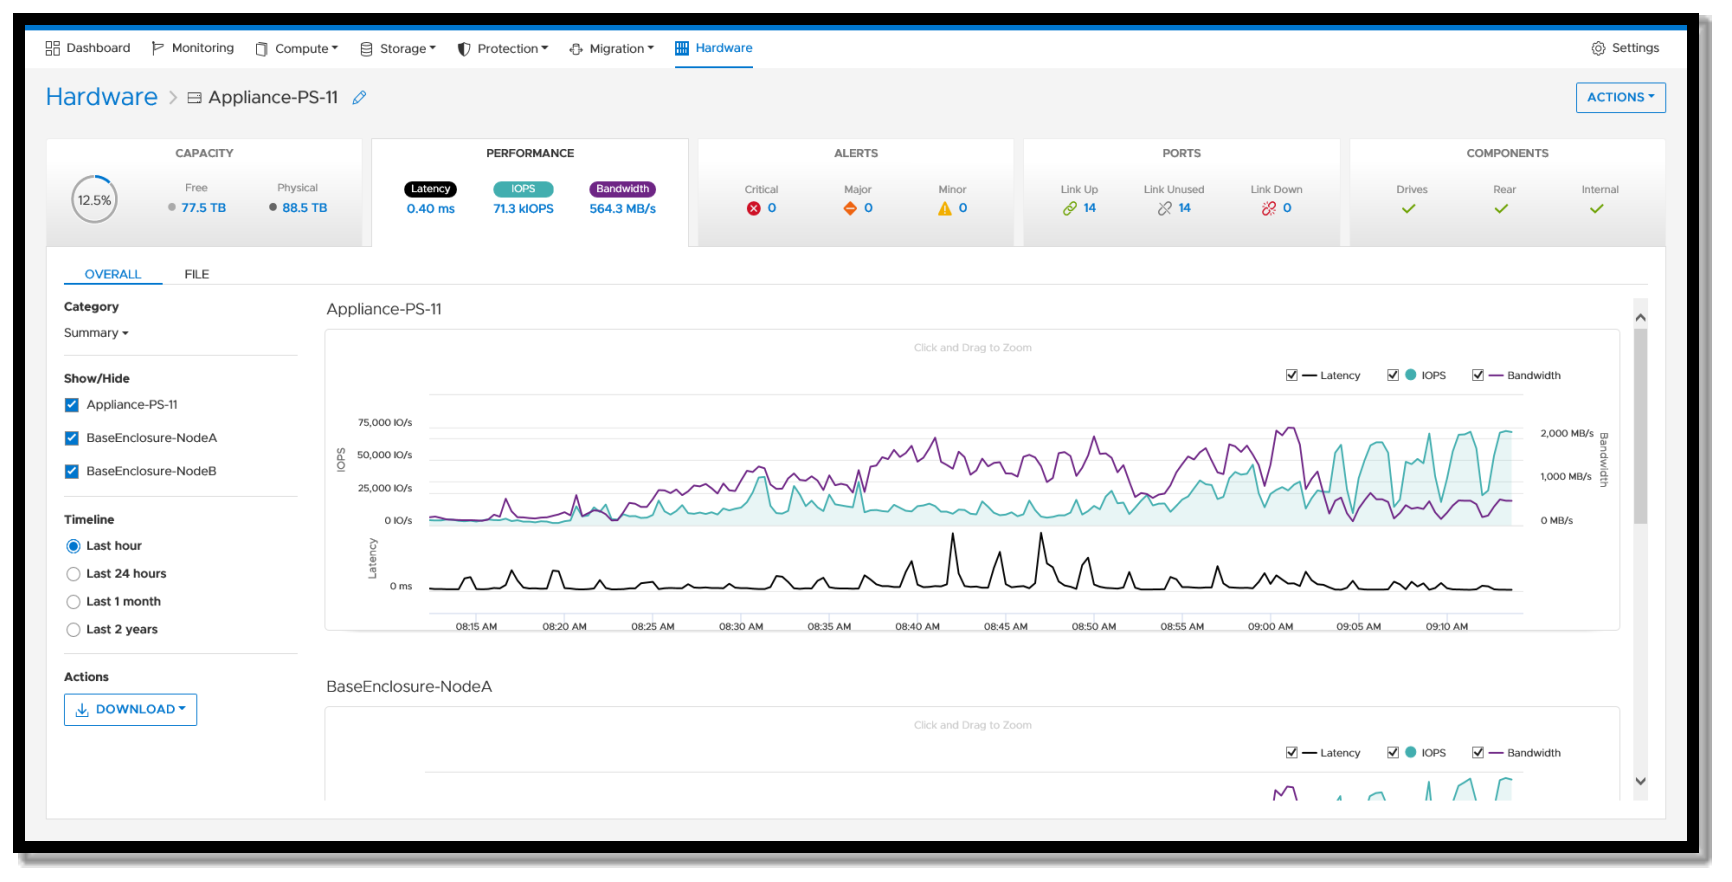
Figure 5. PowerStore hardware performance
The Ports tab in the Hardware section will list all network ports for the system. In addition to the port properties, there is a link to network performance on the port properties page. The port properties will indicate the current port speed. This can be compared with the port performance to determine available bandwidth on the port.
Watch list
High-priority SQL Server workloads can be added to the PowerStore Manager dashboard watchlist. This allows IOPS, bandwidth, and latency to be displayed when PowerStore Manager is started. Additionally, these statistics can be viewed at the host group, host, volume group, or volume level making it convenient to quickly see important metrics in one view.
Performance of critical volumes can be added to a Watchlist for enhanced visibility. To do this, select the volumes and under the More Actions menu, select Add to Watchlist.
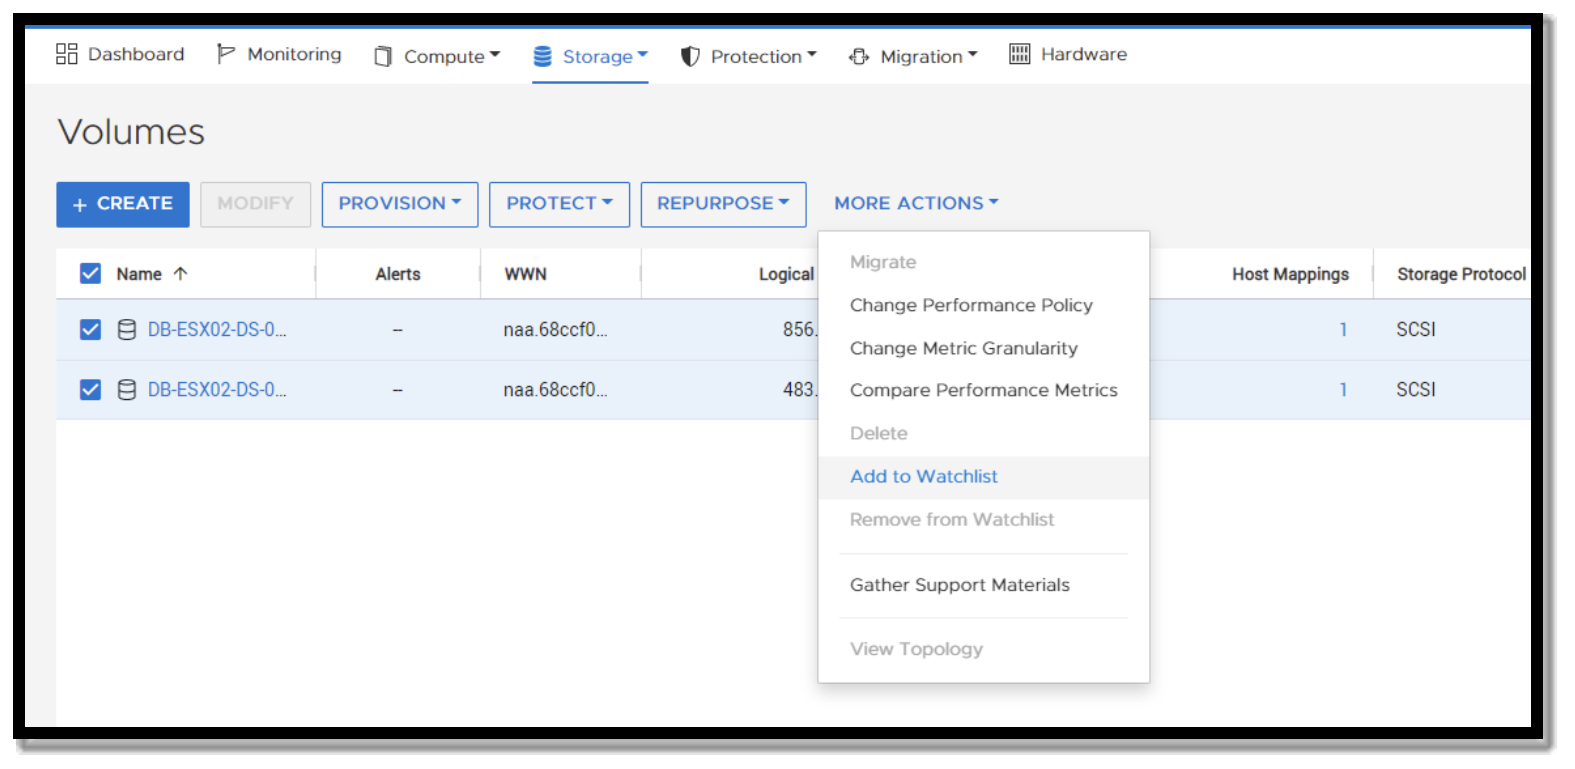
Figure 6. Adding volumes to the Watchlist
Once the volumes are added to the Watchlist, they will appear on the main PowerStore Dashboard. This provides some basic performance data as well as the ability to navigate directly to them by clicking the volume name.
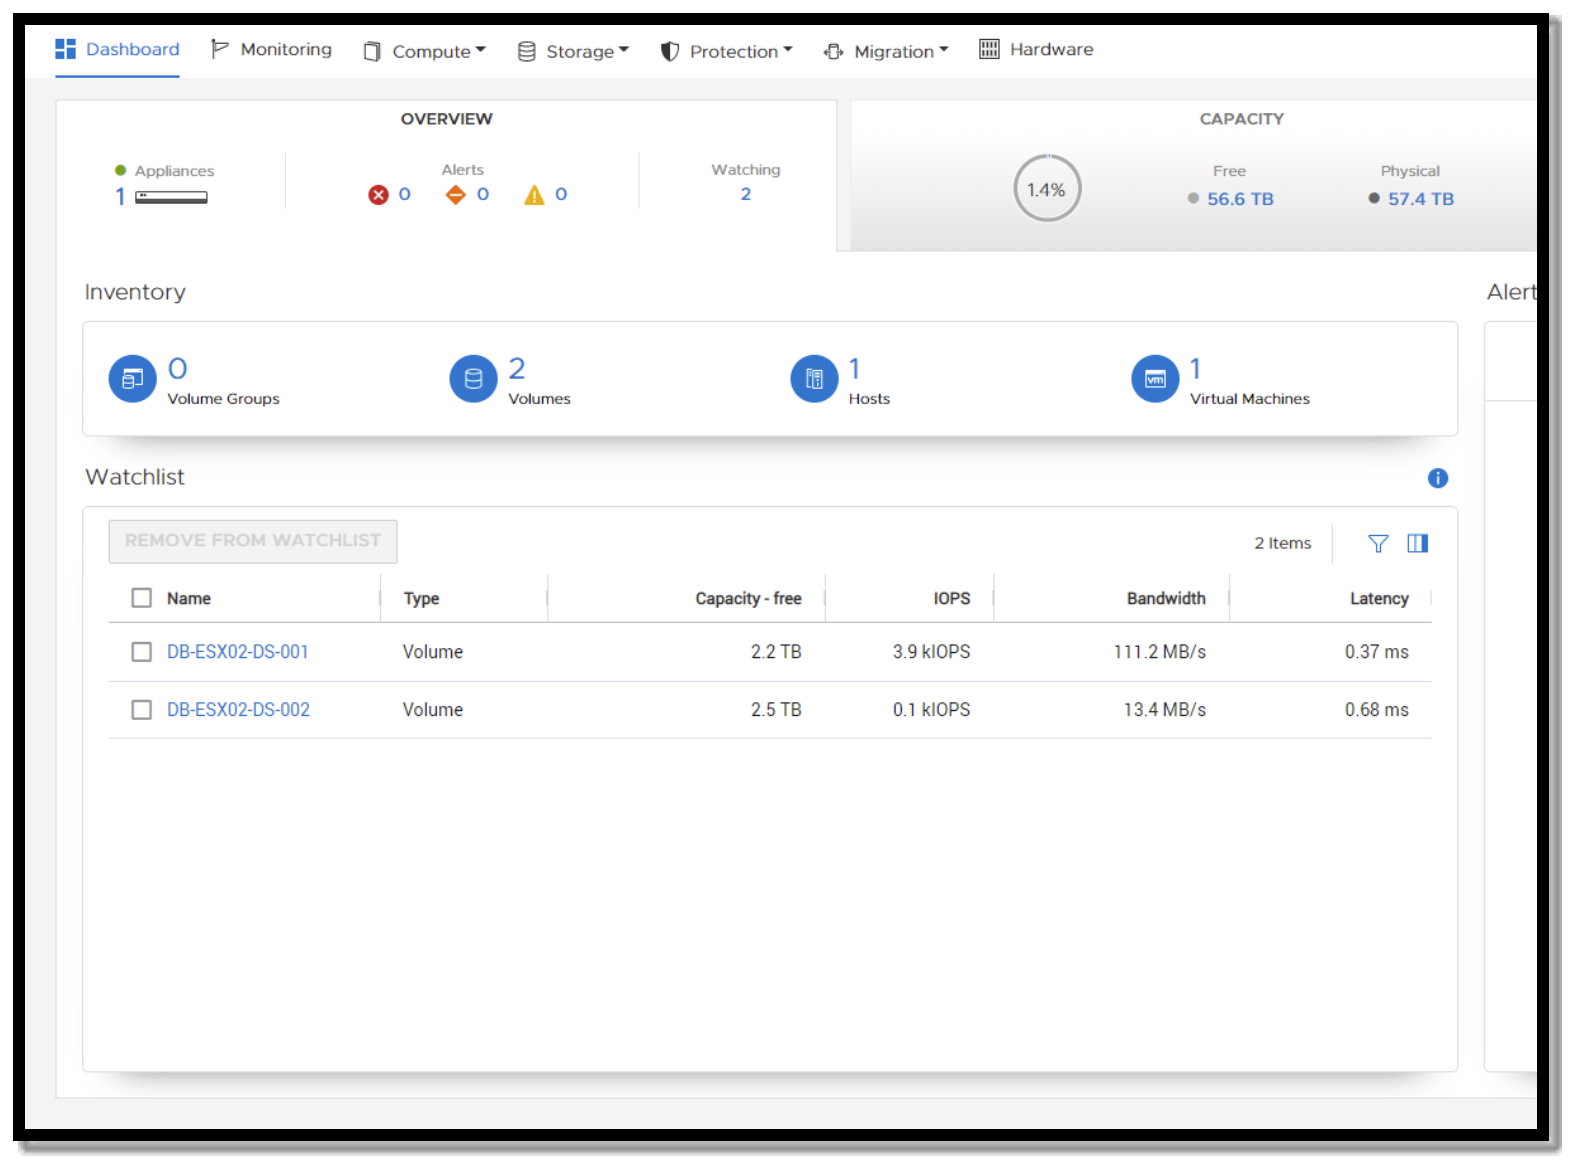
Figure 7. Adding volumes to watchlist
You can also add hosts to the Watchlist in the same manner. If you add a host that already has volumes on the list, those volumes will be combined under the host.
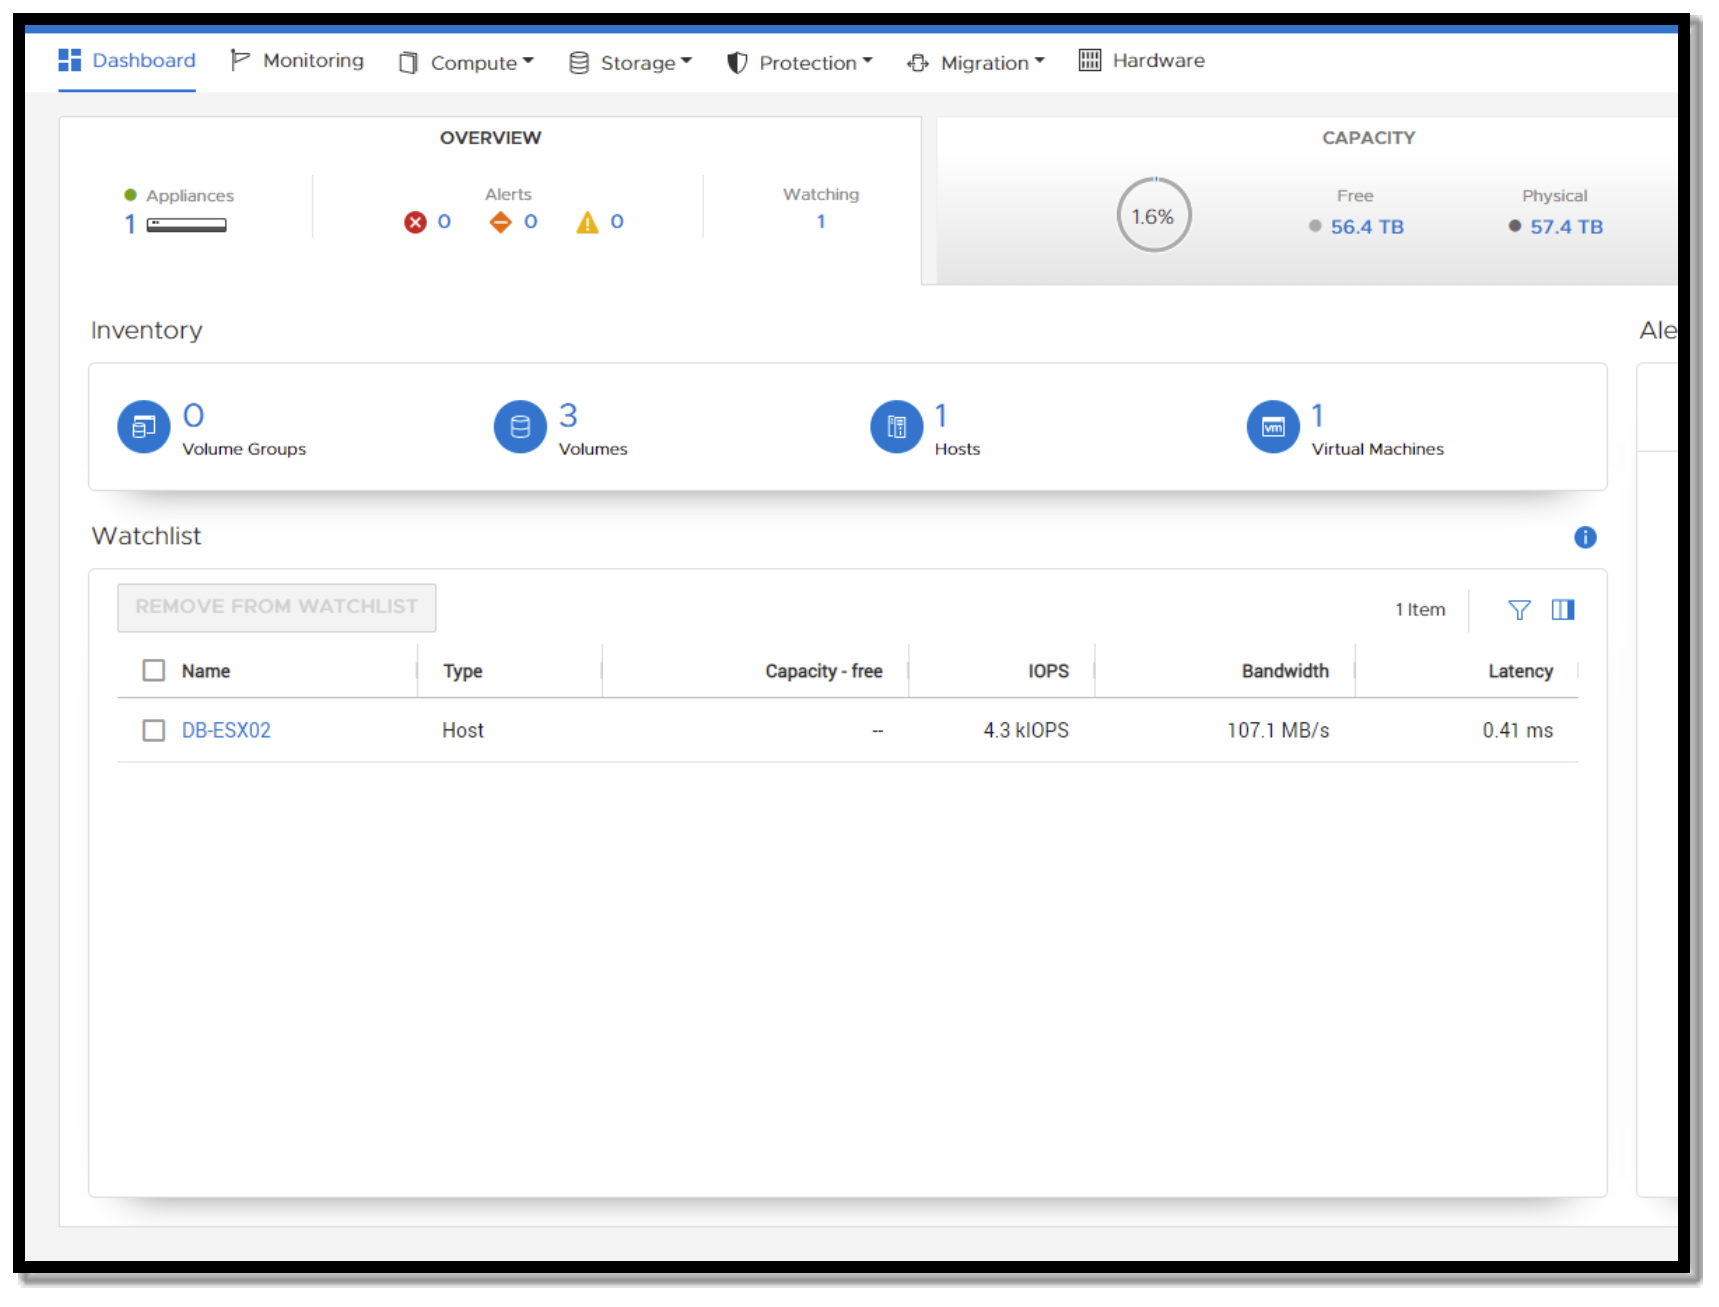
Figure 8. Adding hosts to watchlist
Compare IO performance
Compare IO performance is extremely useful when evaluating SQL Server databases that span multiple volumes. For example, all data volumes for a SQL Server database can be selected in the comparison view to quickly evaluate whether IO is balanced across the volumes.
The Compare IO Performance feature can be found in the Volumes section of PowerStore Manager. Select multiple volumes and click on “More Actions” to display the Compare IO Performance option.
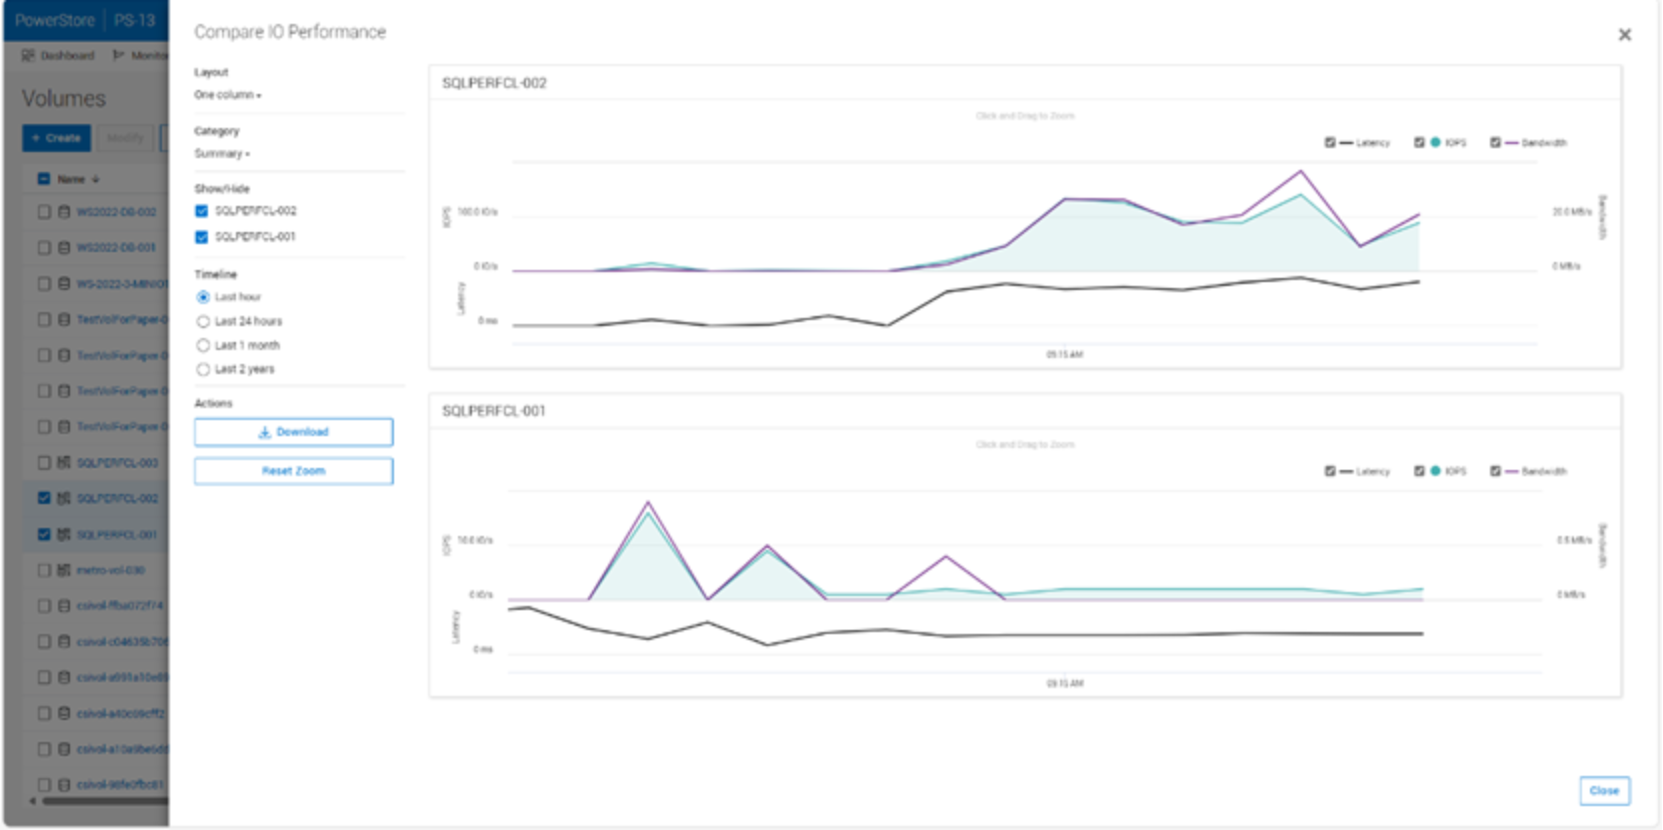
Figure 9. Comparing IO performance
In this example there are two data volumes for a single SQL Server database. The database should be designed to distribute IO evenly, however, differences in the charts quickly indicate that there is an issue.
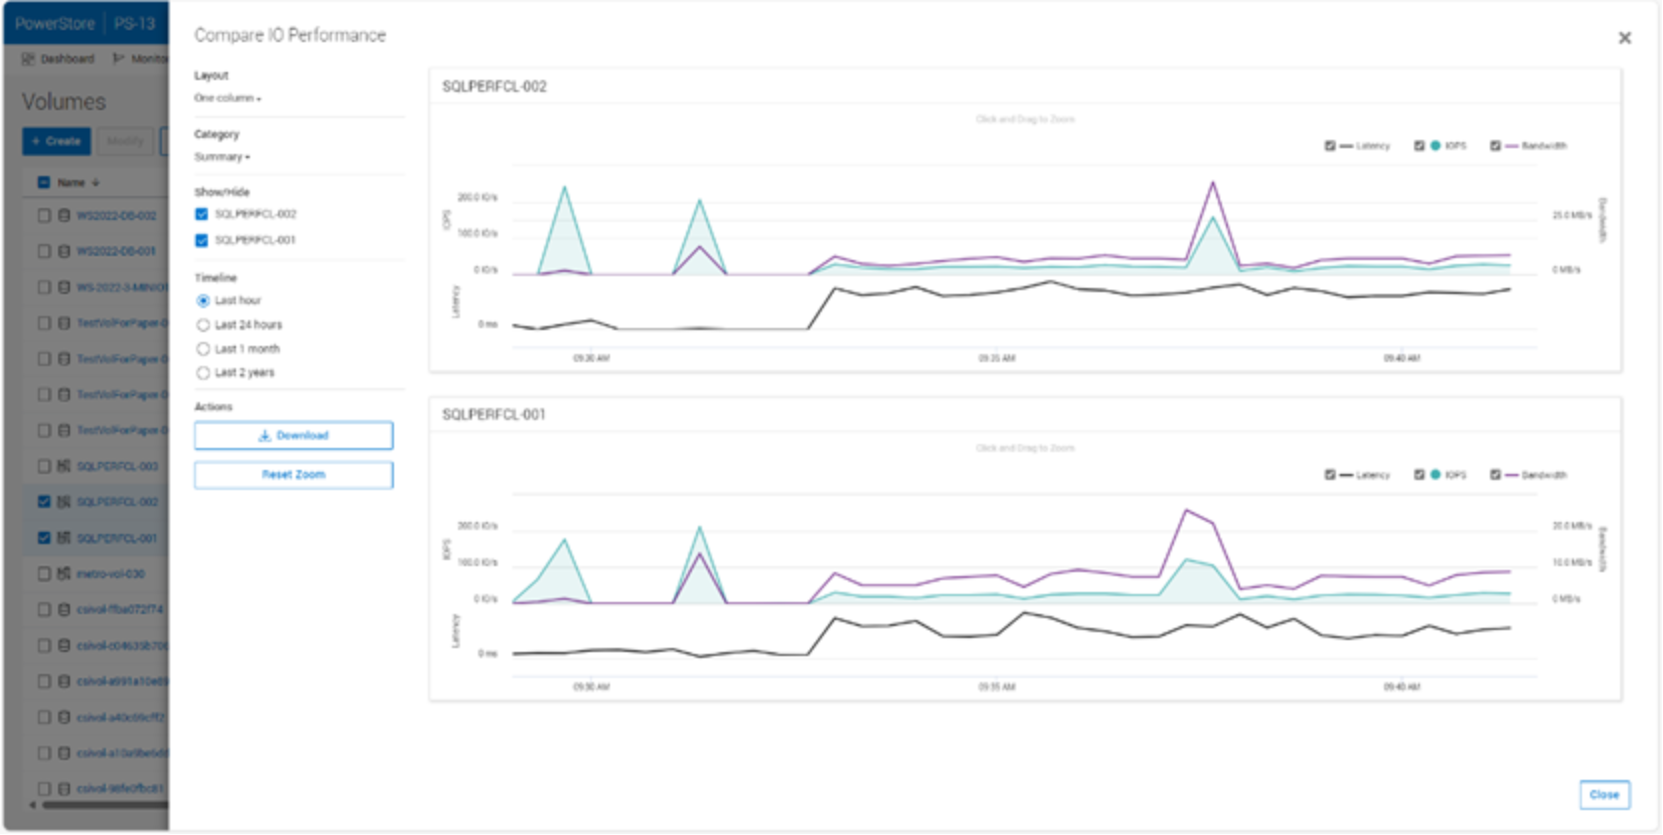
Figure 10. Comparing IO performance
After addressing the design issue in the SQL Server database, the IO workload is evenly balanced.