
Overview
Overview
-
By using multiple space-savings techniques, PowerStore attempts to use the least amount of disk space to store user data. For reporting purposes, space-savings information is available at the cluster, appliance, and resource level, and includes multiple space-saving metrics. Depending on the object being viewed, these metrics may include an overall efficiency value, and thin, snapshot, and data reduction savings values. At the cluster level, space savings information is aggregated from each of the appliances within the cluster. Likewise, at the appliance level, savings information is aggregated for any resources on the appliance.
The overall efficiency value is a computed ratio of the total provisioned space to the physical used space. The total provisioned space not only includes the provisioned size for each of the resources within the system or cluster, such as the size of the volumes, file systems, and all thin clones, but also any snapshots. The physical used space is the total used space on the drives to store the data after thin, deduplication, and compression savings are achieved. The used space is not the total amount of space that is consumed from a host or client perspective before space savings is applied. The overall efficiency value is available for the entire cluster and each appliance within the cluster.
All resources within PowerStore are thinly provisioned, which means the system does not reserve the total provisioned size of a resource from the storage, but rather allocates space as needed. The thin savings achieved for a cluster, appliance, or resource is the ratio of the total provisioned size to the logical space used. The logical space that is used in this instance is the total space that is consumed from a host or client perspective without the effects of deduplication or compression. As shown in Figure 7, if a 100 GB volume has 25 GB of written data, the savings due to the resource being thin is 4:1.
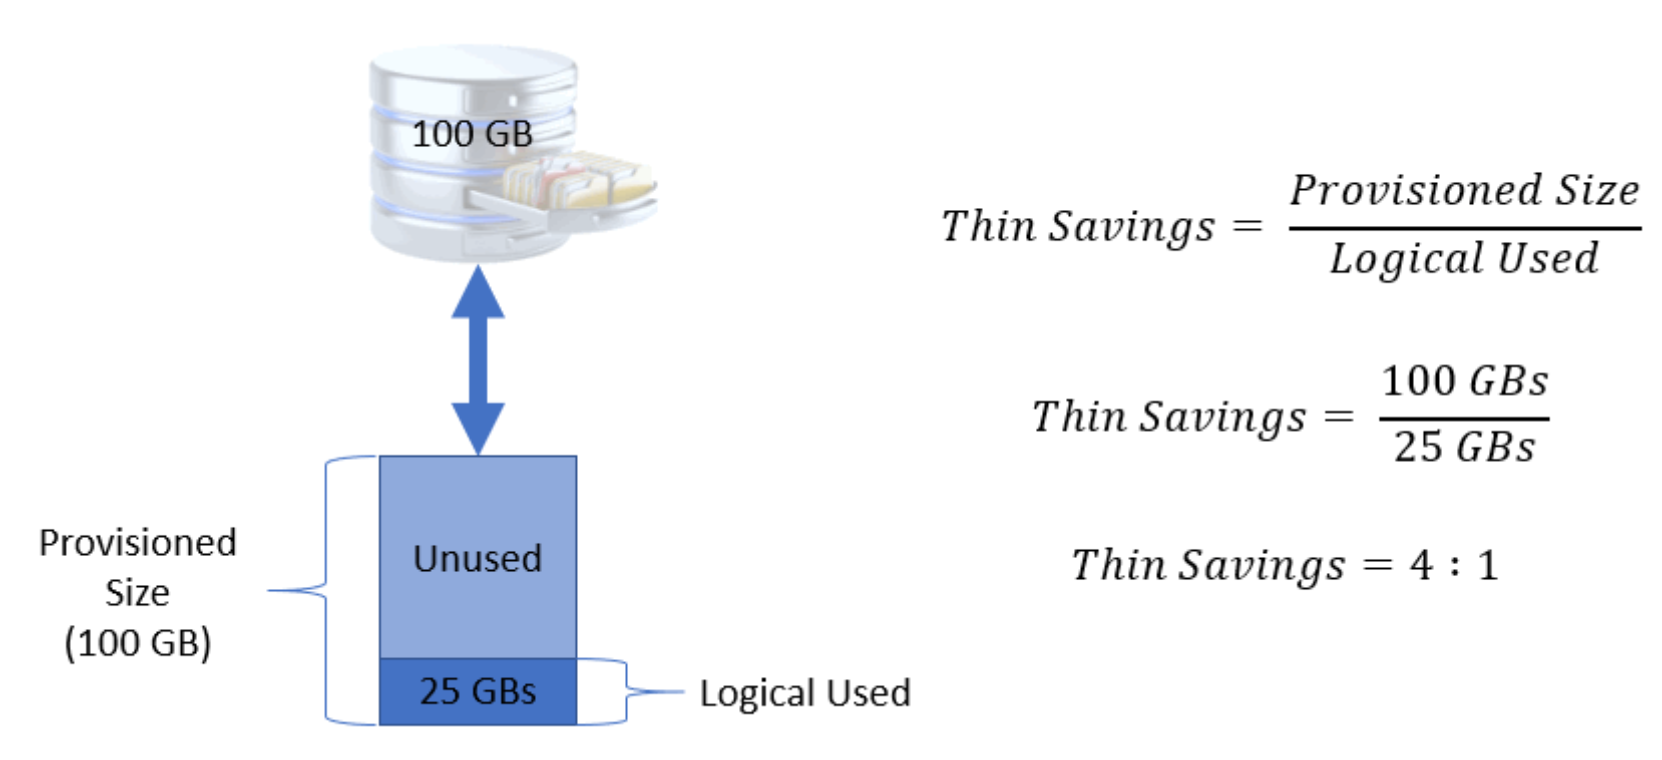
Figure 7. Thin savings example
Snapshot savings, which are displayed as snap savings within PowerStore Manager, is the ratio of logical used space for the snapshots to data that is uniquely owned by the snapshots. The logical used space is the amount of space consumed by data which is in common between the snapshot and the parent resource when the snapshot was created. For example, a volume has 5 GB of data consumed and a snapshot is then taken. The logical used space by the snapshot in this instance is 5 GB, which is shared with the parent resource. If 1 GB of data is overwritten in the volume, the amount of data that is uniquely owned by the snapshot is now 1 GB. In this example, also shown in Figure 8, the snap savings is 5 GB/1 GB or 5:1.
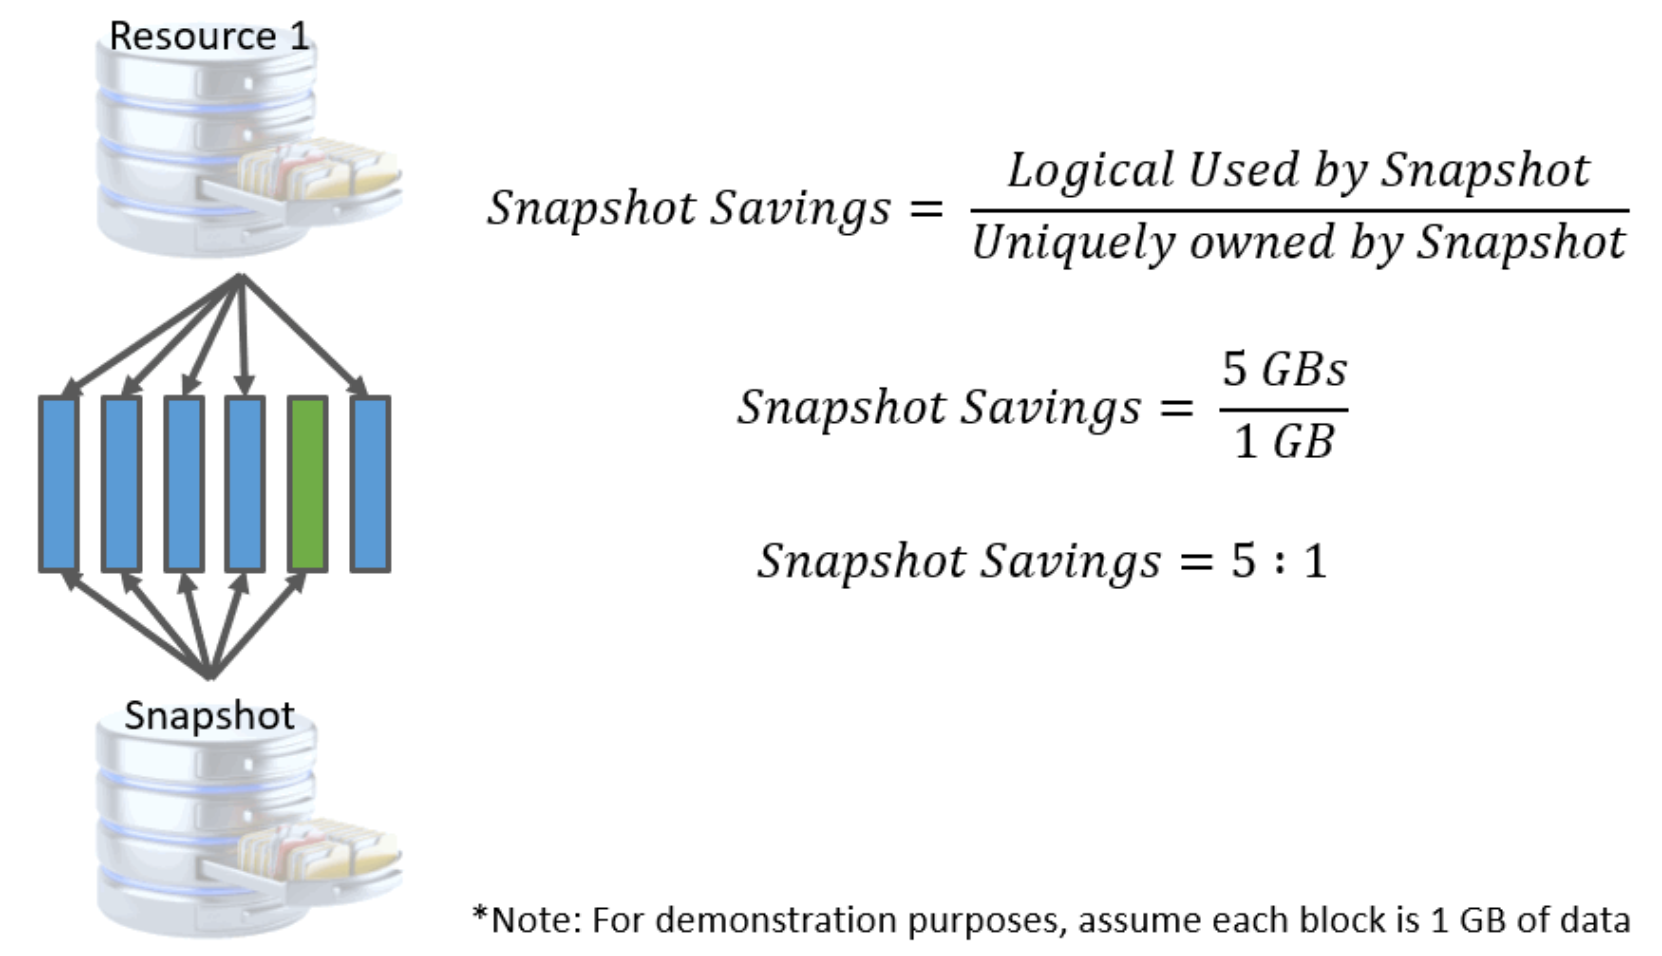
Figure 8. Snapshot savings example
Another space efficiency metric is the Data Reduction Ratio (DRR). This ratio is a comparison between the amount of space a dataset would have consumed if no space savings were achieved (logical used), compared to the amount of physical space occupied after passing the data through deduplication and compression (physical used). If 100 GB of data only needs 25 GB of physical storage after deduplication and compression, then the data reduction savings is 4:1. This example is shown in Figure 9. In PowerStoreOS releases prior to version 4.0, the data reduction ratio is only displayed for the cluster and appliance levels.
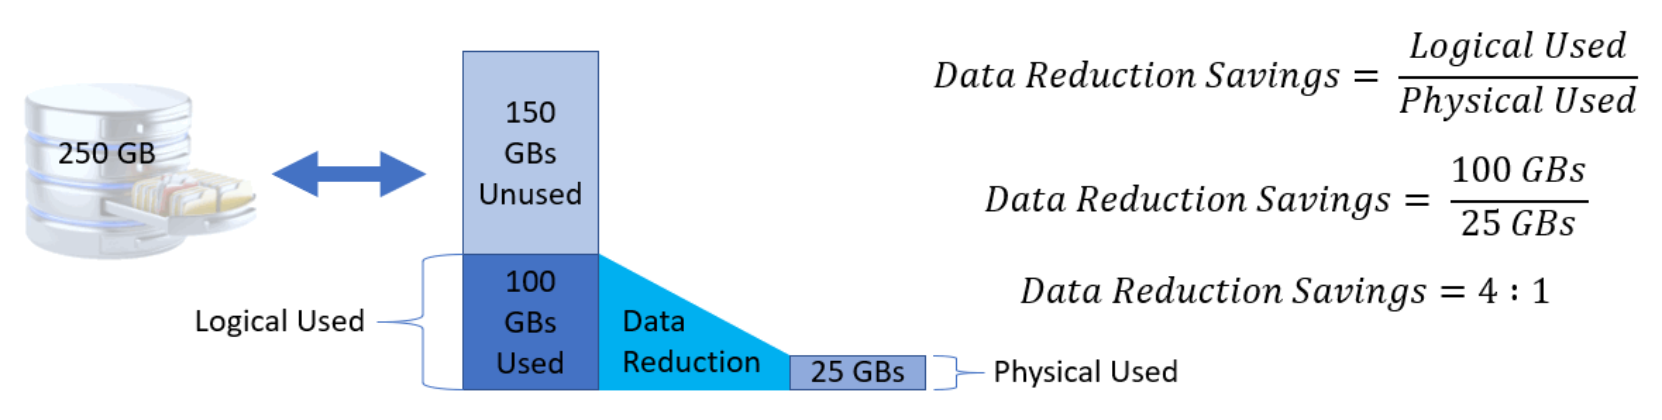
Figure 9. Data reduction savings example
In PowerStoreOS 4.0 and later, additional space savings metrics are available. Users can view the Overall Data Reduction Ratio (Overall DRR), Reducible Data Reduction Ratio (Reducible DRR), and the amount of Unreducible Data. These new metrics are available for the cluster and each individual appliance within a cluster, along with volumes, volume groups, storage containers, and virtual machines. For volumes and volume groups, these metrics are reported for the family, such as Family Overall DRR or Family Reducible DRR. Here are the definitions for these metrics:
Overall DRR – Ratio of space which would have been taken if deduplication and compression are not applied to the physical space occupied after deduplication and compression. The Overall DRR value is the same value as the Data Reduction Ratio from releases prior to version 4.0.
Reducible DRR – The Data Reduction Ratio for the reducible data within the cluster, appliance, or resource. This metric ignores any Unreducible Data in the calculation.
Unreducible Data – The amount of data written within the cluster, appliance, or resource that could not be reduced by PowerStore’s deduplication and compression logic.
In PowerStore, you can view the Physical Capacity, Historical Usage, and Data Savings metrics for the cluster, and the cluster top resource consumers from the Dashboard > Capacity tab. The cluster metrics are aggregated from the metrics of its appliances and resources, such as volume groups, volumes, file systems, and virtual machines. An example of the Capacity tab for the cluster is shown in Figure 10. Under the Data Savings title, the Overall Efficiency, Snap Savings, and Thin Savings for the cluster can be viewed. A graphic exists showing the relationship between the Logical Used and Physical Used space, along with the Data Reduction savings that were achieved. In PowerStoreOS 4.0, hovering over the Data Reduction graphic allows the user to see the Overall DRR, Reducible DRR, and Unreducible Data values for the cluster.
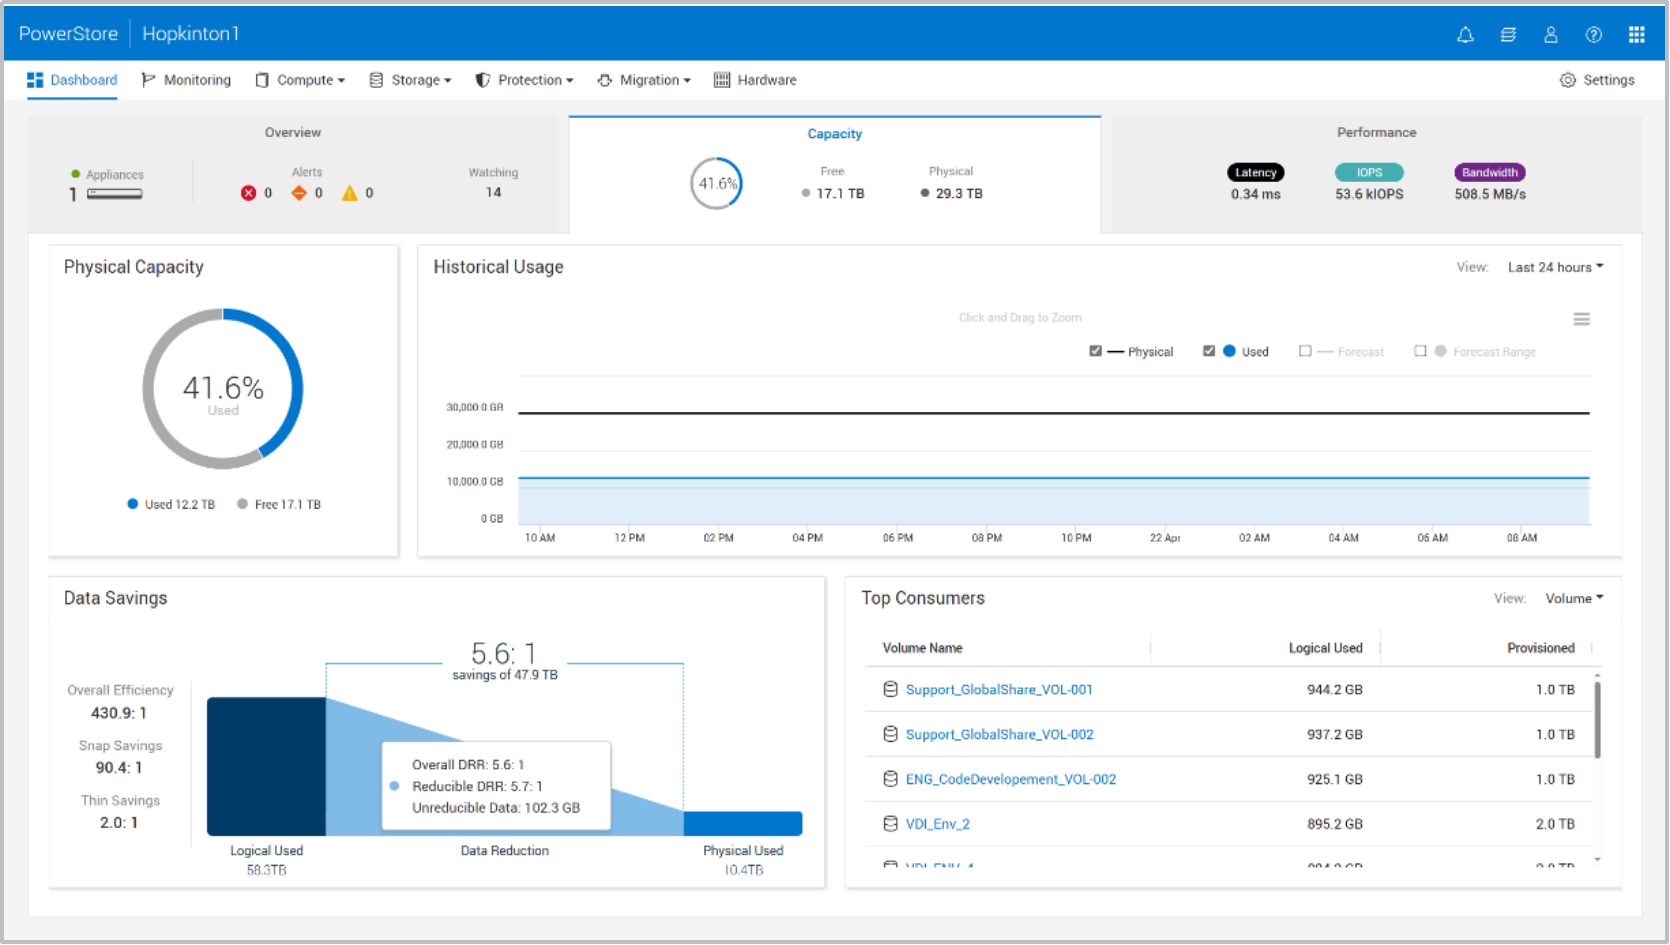
Figure 10. PowerStore Manager: Dashboard > Capacity tab
When hovering over the Physical Capacity chart, the user is provided with more information about the Used and Free capacity within the system. For each metric, User and System space is also reported. For Used, the User and System space metrics state how much capacity is currently in use for User data and by the System. The System value includes the amount of space used by system metadata. For Free, the User and System values report how much free space exists.
When a resource is deleted, capacity that was used by user data is freed back to user space and any metadata space is freed to system space. When additional capacity is required for new user data or metadata, the system uses the free capacity within the system. If there is no free system space to create additional metadata, user space will be reduced to satisfy the need. This information is available within the Physical Capacity chart for the cluster and each individual appliance. An example is shown in Figure 11.
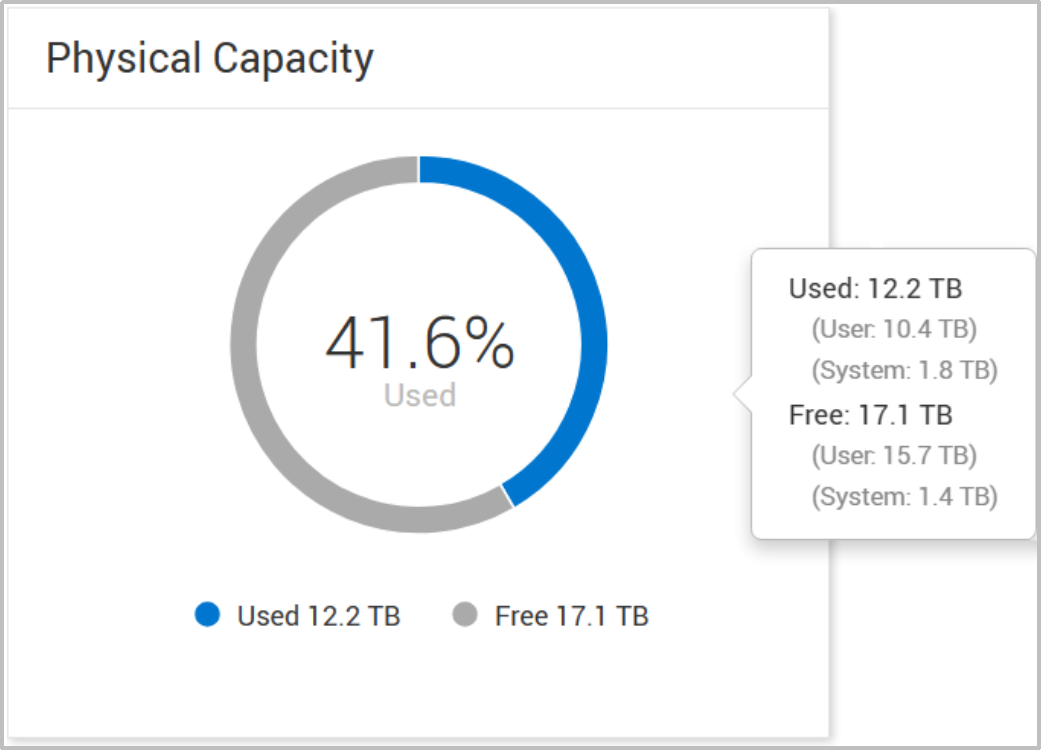
Figure 11. PowerStore Manager: Dashboard > Capacity tab > Physical Capacity
You can view the capacity metrics for an appliance from the Hardware > Appliances > [appliance] > Capacity tab. On this screen, as shown in Figure 12, you can view the Physical Capacity, Historical Usage, and Data Savings information for the appliance. Within the Data Savings block, you can view the Overall Efficiency, Snap Savings, and Thin Savings for the appliance. As mentioned previously, this information is aggregated, along with information for other appliances within the same cluster, to create the cluster metrics. Lastly, the Data Reduction savings ratio is presented within the graphic displaying the comparison between Logical Used and Physical Used space for the appliance. In PowerStoreOS 4.0, hovering over the Data Reduction graphic allows the user to see the Overall DRR, Reducible DRR, and Unreducible Data values for the appliance. If the cluster contains a single appliance, the capacity information on this page matches what is displayed on the Dashboard > Capacity tab.
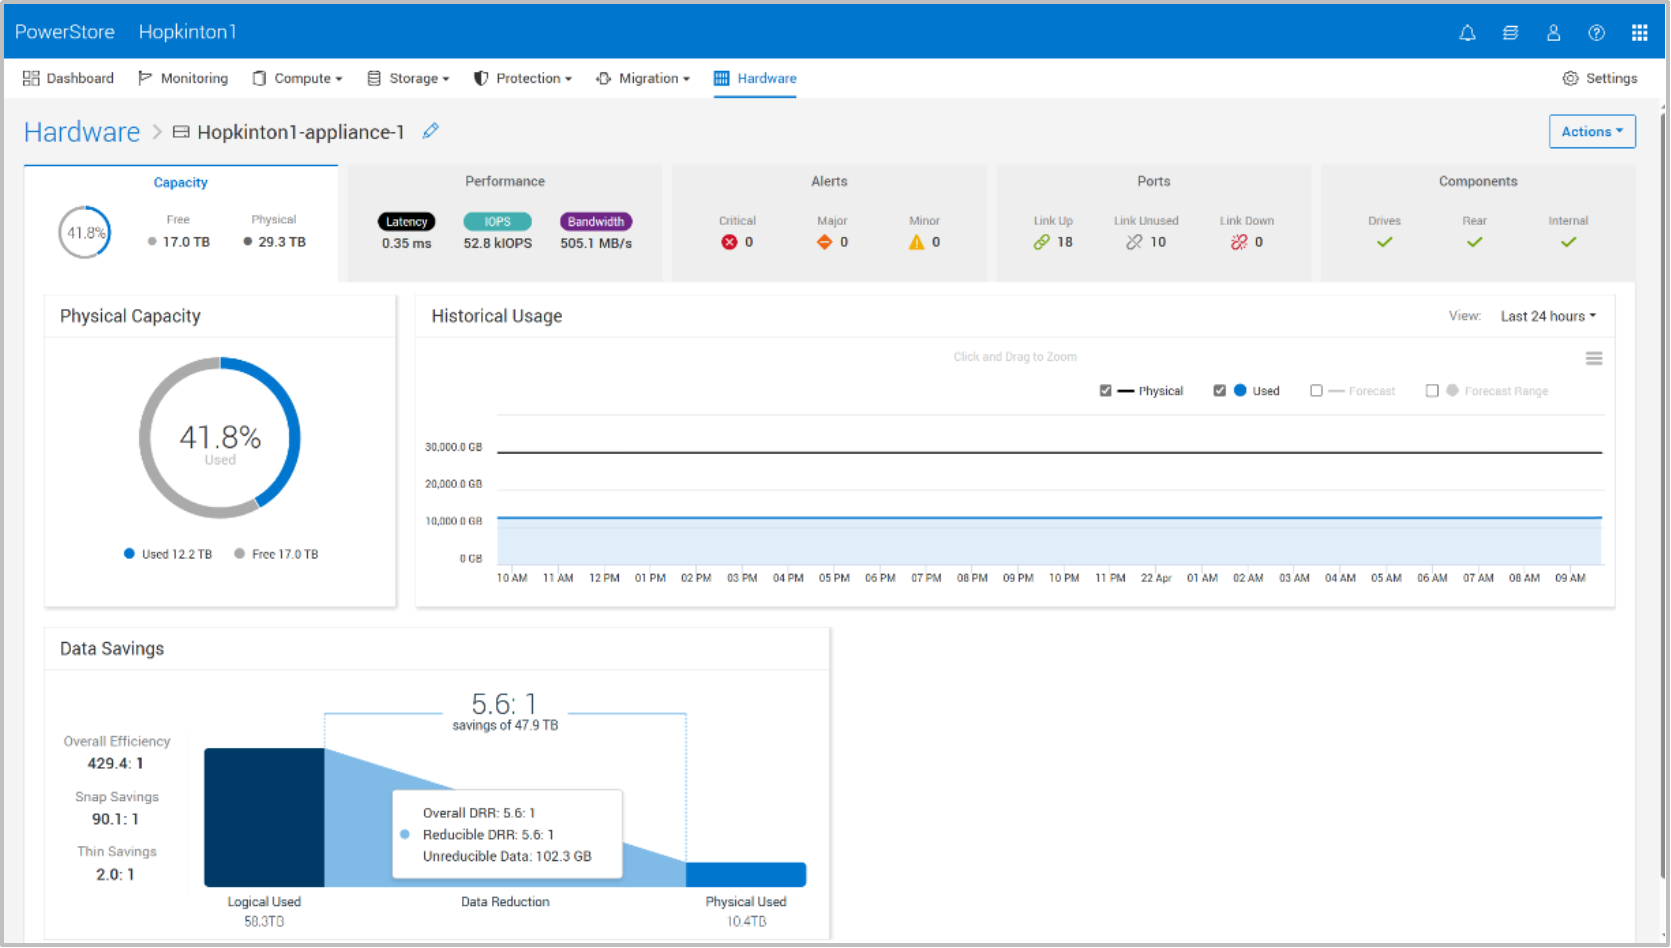
Figure 12. PowerStore Manager: Hardware > Appliances > [appliance] > Capacity tab
Thin Savings and Snap Savings can be viewed for volumes within a PowerStore system. This information can be found on the Capacity tab within the properties of the resource. Within the Usage box, the volume Used and Free space are displayed, along with the Thin Savings and Snap Savings. The amount of Snapshot/Thin Clone Space being consumed, and the amount of Volume Family Unique Data can be viewed on this page. The Historical Usage of the volume is also displayed on the Capacity tab, which shows the Provisioned size and Used space for the resource. An example of this page for a volume is found in Figure 13. In PowerStoreOS 3.0, more usage information for file systems was added to the Capacity tab. The information includes Thin Savings, Snap Savings, Snapshot/Thin Clone space, and Filesystem Family Unique Data. The Historical Usage chart was also added for file systems.
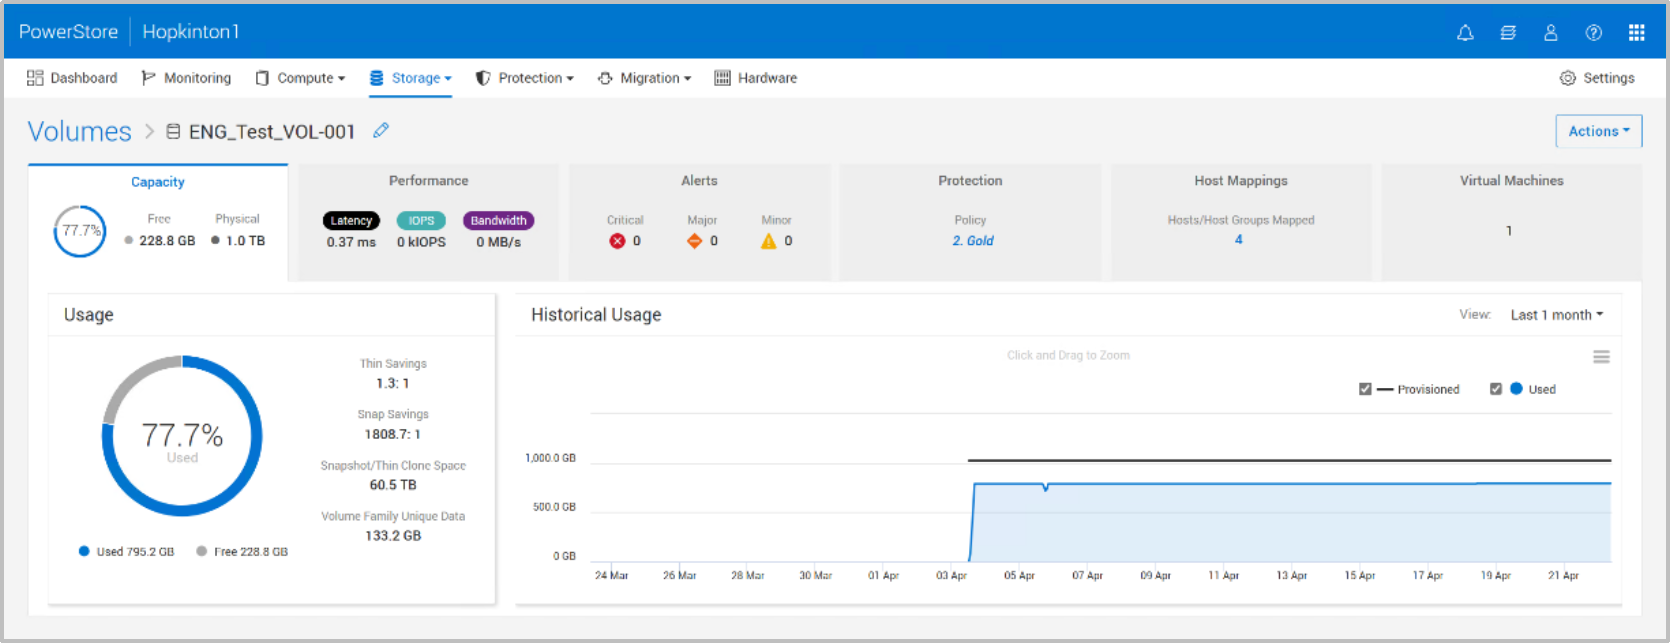
Figure 13. PowerStore Manager: Volume Properties > Capacity tab
The Overall DRR, Reducible DRR, and Unreducible Data metrics can be viewed for volumes, volume groups, storage containers, and virtual machines. PowerStoreOS version 4.0 and later also allows a user to add columns for these metrics to the table view for supported resources. This allows a user to easily compare the data across the resources within the cluster. Figure 14 shows the Overall DRR, Reducible DRR, and Unreducible Data columns on the Volumes page.
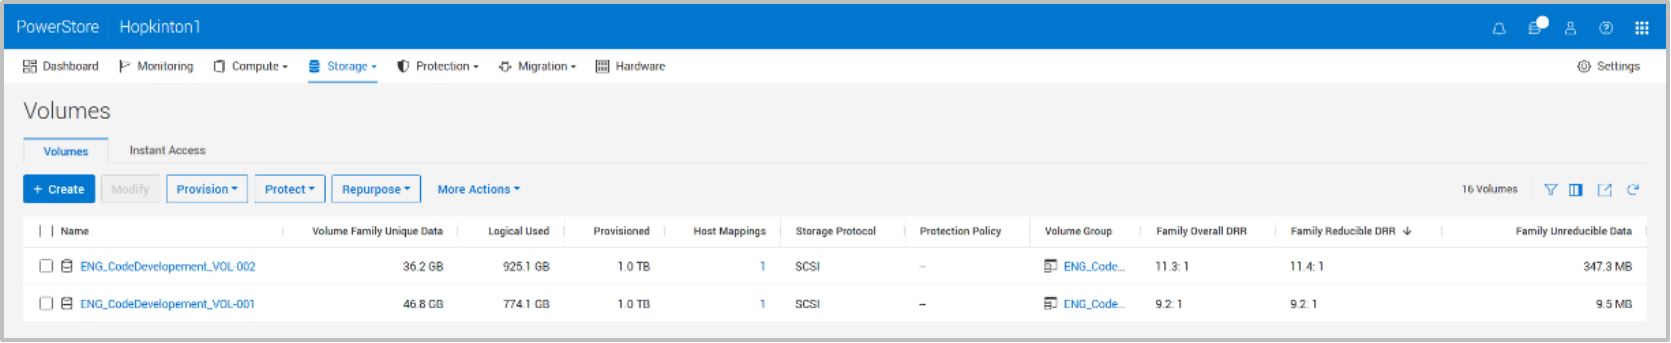
Figure 14. PowerStore Manager: Storage > Storage Containers page
Capacity and data efficiency information can also be viewed within the topology views for volumes and volume groups. To view this page, select the checkbox for a resource then More Actions > View Topology. Figure 15 is an example of this page for a volume with the Capacity tab selected.
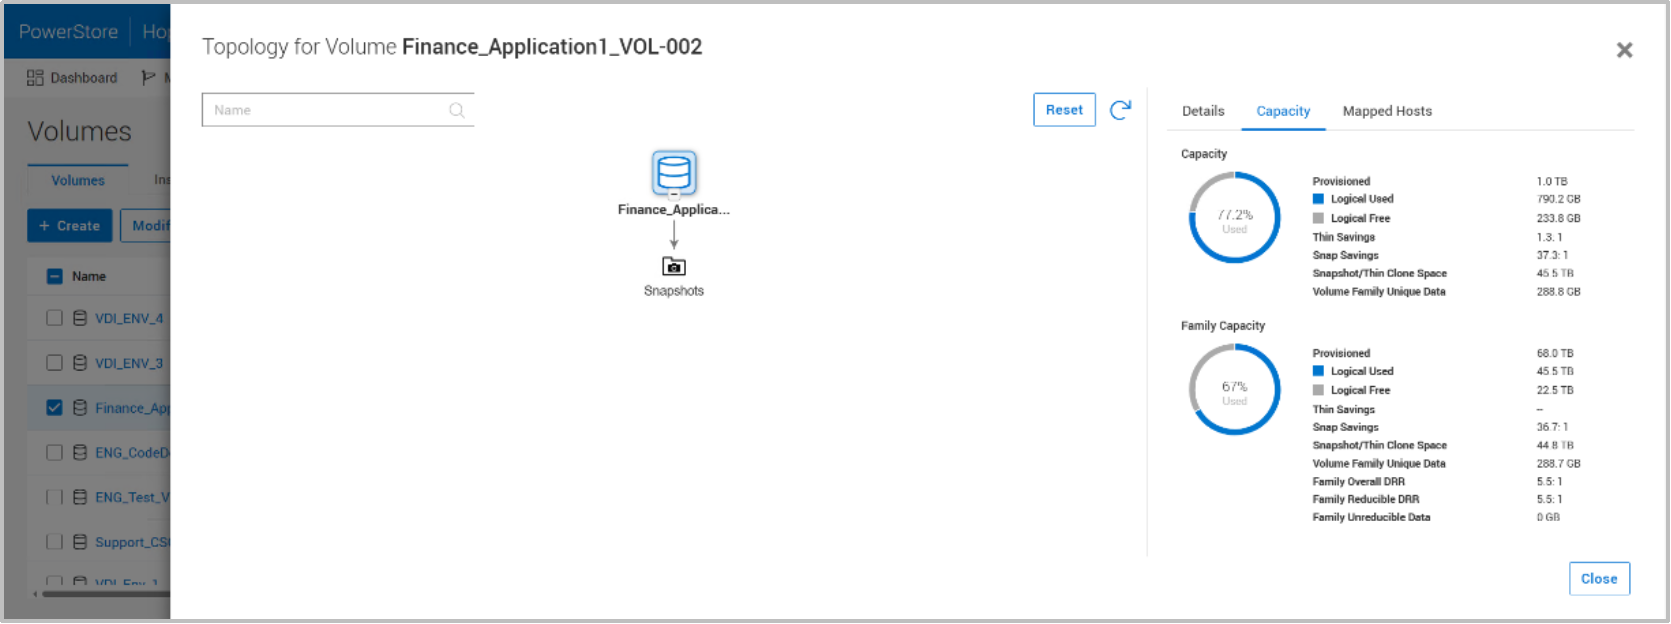
Figure 15. PowerStore Manager: Volume > More Actions > View Topology > Capacity tab