
Benchmark results
Benchmark results
-
Figure 2 shows the results of the GDSIO tool with the following parameters:
- Sequential READs
- 512 KiB IO Size
- 8 threads per GPU
- 256 GB file size
Figure 2 also includes results numbers from previous GDSIO tests using OneFS 9.2 and NVIDIA V100 GPUs.
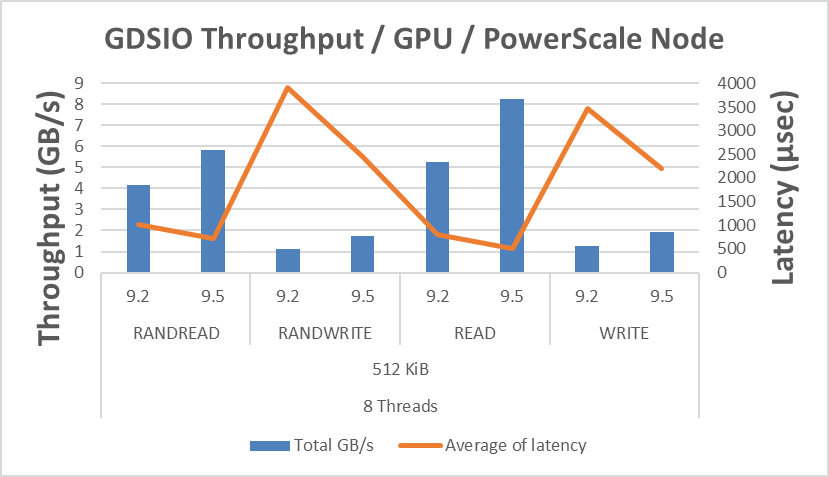
Figure 2. GDSIO performance results comparison between OneFS 9.2 and OneFS 9.5
F600 performance nodes with upgraded Intel Gold 6248R processors, memory, and OneFS 9.5 showed a 36 percent performance improvement over previous GDSIO testing with standard F600 nodes. This significant increase in performance is the result of higher performant components within the F600, such as upgraded Intel processors, as well as performance improvements embedded into OneFS 9.5.
This increase in node performance increases the overall performance density of a PowerScale cluster. A single F600 node is one rack unit or 1RU, and a minimum cluster size is three nodes or 3RU. This equates to over 24 GB/s per minimum cluster throughput, scaling linearly up to 252 nodes in a cluster. A fully populated F600 PowerScale cluster can serve over 2 TB/s of read throughput to a massive GPU farm. For companies looking to build supercomputers or extremely large generative AI models, PowerScale is an excellent platform choice.

Figure 3. Performance benefits with GDSIO and F600 performance nodes