System efficiency overview
System efficiency overview
-
Data reduction savings are presented as ratios and are available in both Unisphere for PowerMax and Solutions Enabler. The capacity report provides a single location to view system efficiency, capacity and system resource usage. The data is displayed in three sections, Array Usage, Efficiency and System Usage. There are two levels of detail available. The default view (see Figure 2) offers a high-level view of efficiency in the form of ratios and capacity usage displayed as bar graphs. The detailed view expands the information provided under array usage revealing a more detail of the capacity usage (see Figure 3). The detailed view also reveals system usage in the form of percentage used categorized as metadata.
As part of the Q1 2021 PowerMaxOS release there is a further breakdown under the efficiency section for the data reduction ratio. A flyover display reveals additional information on the data reduction ratio. The data presented relates specifically to data reduction enabled allocations. This is divided into two sections, unreducible capacity and reducible capacity. This information is available in both the default and detailed views of the capacity report.
- Unreducible Capacity: Represents data reduction enabled allocations the system was not able to reduce. In most cases this is due to data already compressed and/or encrypted at the host or application level. In addition, there are data sets that simply do not reduce well, for example, image files (jpeg, pdf, etc.) or audio files.
- Reducible capacity: This represents data reduction enabled allocations the system has determined are reducible. The values are displayed as capacity representing reducible data that will be reduced. Adding compression and dedupe savings with pattern detection savings may not equal the reducible capacity value due to performance optimization (see Activity Based Compression). The enabled for data reduction percentage will also be a factor when less than 100.
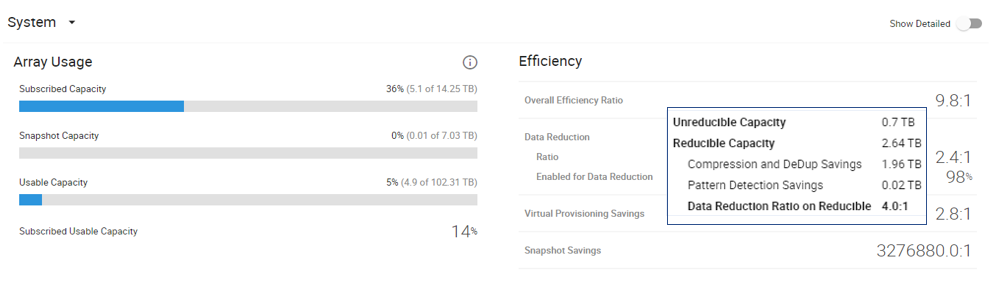
Figure 2. System efficiency report as seen in Unisphere for PowerMax (Default high-level view).
Calculating Efficiency Ratios: This data is revealed in the array usage section when switching the capacity report to the detailed view (see Figure 3). It is needed to calculate the ratios displayed in the efficiency section. The data available from the detailed view can be used in the formulas below to calculate the ratios displayed in the efficiency section.
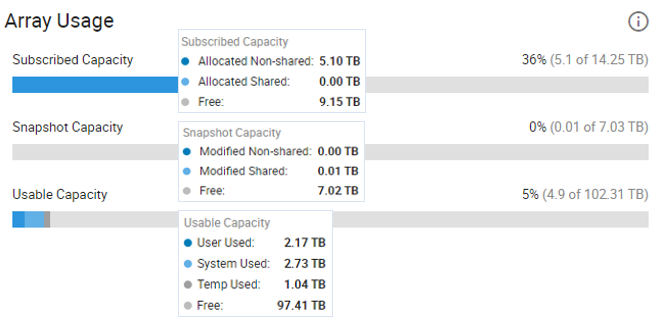
Figure 3. System efficiency report detailed view of Array Usage in Unisphere for PowerMax
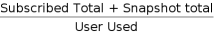
- Overall Efficiency Ratio: The range of values that describe the capacity space savings that a user may experience regarding data reduction or other data services that offer capacity savings, such as Data Reduction, non-zero allocation, over provisioning and SnapVX.
- Data Reduction Ratio: Savings that represents the combination of inline compression and inline deduplication presented as a ratio. To calculate the data reduction ratio the user needs to toggle to the detailed view shown in Figure 3. Additional information needed is revealed by hovering over the Usage bars. When calculating the data reduction ratio using the values presented in the usage portion of the capacity report. The ratio may reflect a different value due to the performance optimization leaving compressible data uncompressed. The enabled percent being less than 100 may also be a factor.

- Data Reduction Ratio on Reducible: Represents the data reduction savings using only data reduction enabled allocations that have been reduced.

- Enabled Percent: The amount of subscribed host allocations that have Data Reduction enabled.
- Virtual Provisioning Savings: Savings achieved relative to provisioned capacity and total usable capacity displayed as a ratio. This may exceed the maximum usable capacity.
- Snapshot Savings: A representation of savings resulting from the use of SnapVX to create local replication data.