
Sizing and scalability
Sizing and scalability
-
It is important to understand the difference between sizing and scaling. Sizing is a resource planning exercise to estimate how much compute, networking, storage, power, and space is required for each application, service, or workload. Sizing must address expected user demand, storage requirements, expected traffic patterns, training time, and miles simulated per day without over or under provisioning resources. Sizing must occur with each purchasing phase of the program. Whereas scalability refers to an architecture that incrementally increases in size, while still being able to maintain or increase its level of performance even as it is stretched by larger and larger operational demands.
DARA is an example of a scalable architecture that allows the execution environment to grow with each purchasing phase without sacrificing performance. An end user can purchase the DARA starter kit and expand the operational environment with incremental purchases of SUs. An SU is user-defined and can be several different racks of resources depending on the workload and user environment. For example, an SU can be a rack of PowerEdge storage that can be added to the starter kit for archivable purposes. Another example of an SU is a rack of simulation servers (server-based HiL Rigs) that can be combined with the starter kit to increase the model verification coverage in a shorter amount of time. In any case, SUs can be added at any time without disrupting the operational environment or server availability.
The basis for estimating the number of resources required for a specific environment is knowing how many simulated miles per day the project requires. Because the ADAS/AD market is nascent, KPIs and standards are still developing. A good starting point is to use the Rand Corporation’s report, Driving to Safety[8]. It provides an overall project guideline for the total number of simulated miles required to be as good as or better than a human driver by using simulated miles per day as a quantitative approximation for resource sizing.
Resource sizing can be determined using the smallest meaningful building block so the results can be extended to estimate resource requirements to meet project performance goals. For this example, the hardware configuration is one AMD two-socket server (PowerEdge R7525) using three rendering GPUs (RTX8000s).
See the Hardware Configuration legend in the following figure. The benchmark image resolution was scaled to 512x512x8bpp so performance results can be easily compared to other benchmarks using the similar image resolutions. This example is used to demonstrate the sizing process and does not represent results from the starter kit. As newer or different hardware becomes available, the sizing process remains the same and the following graphs must be updated to reflect the new results.
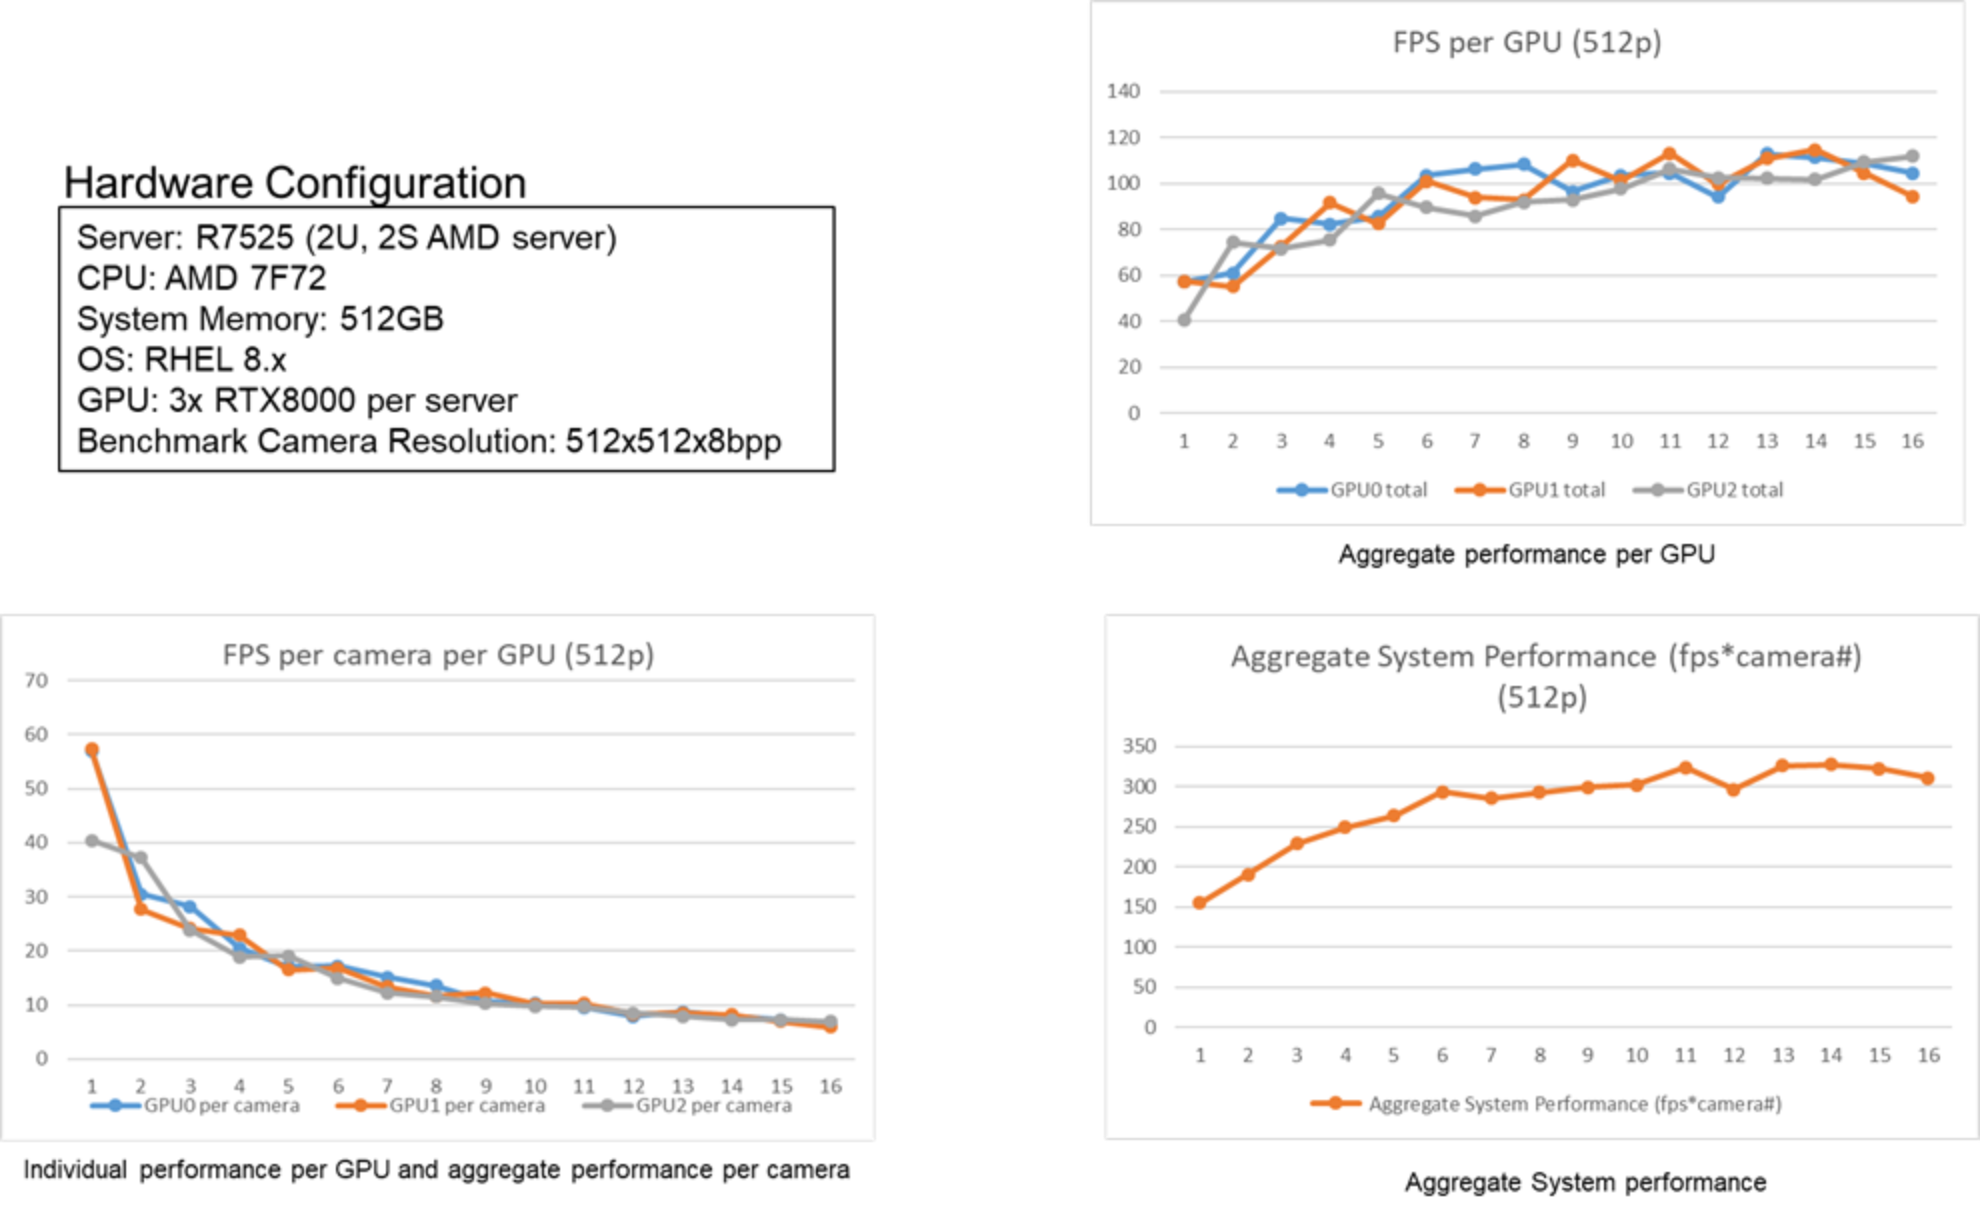
Figure 10. Three graphs show GPU benchmarks from three different perspectivesThe figure shows three graphs each showing frames per second (FPS) from three different perspectives: camera, GPU, and system performance. The most important graph for this exercise is the system or aggregate performance graph that indicates that the FPS begins to dip slightly starting at 14 - 1080p cameras. For our sizing example, we can use eight video cameras per vehicle without negatively impacting system performance. From the aggregate system performance graph, eight video cameras translate to about 300 FPS, which we use in the following sizing example.
The following figure shows the first six steps of the sizing example:
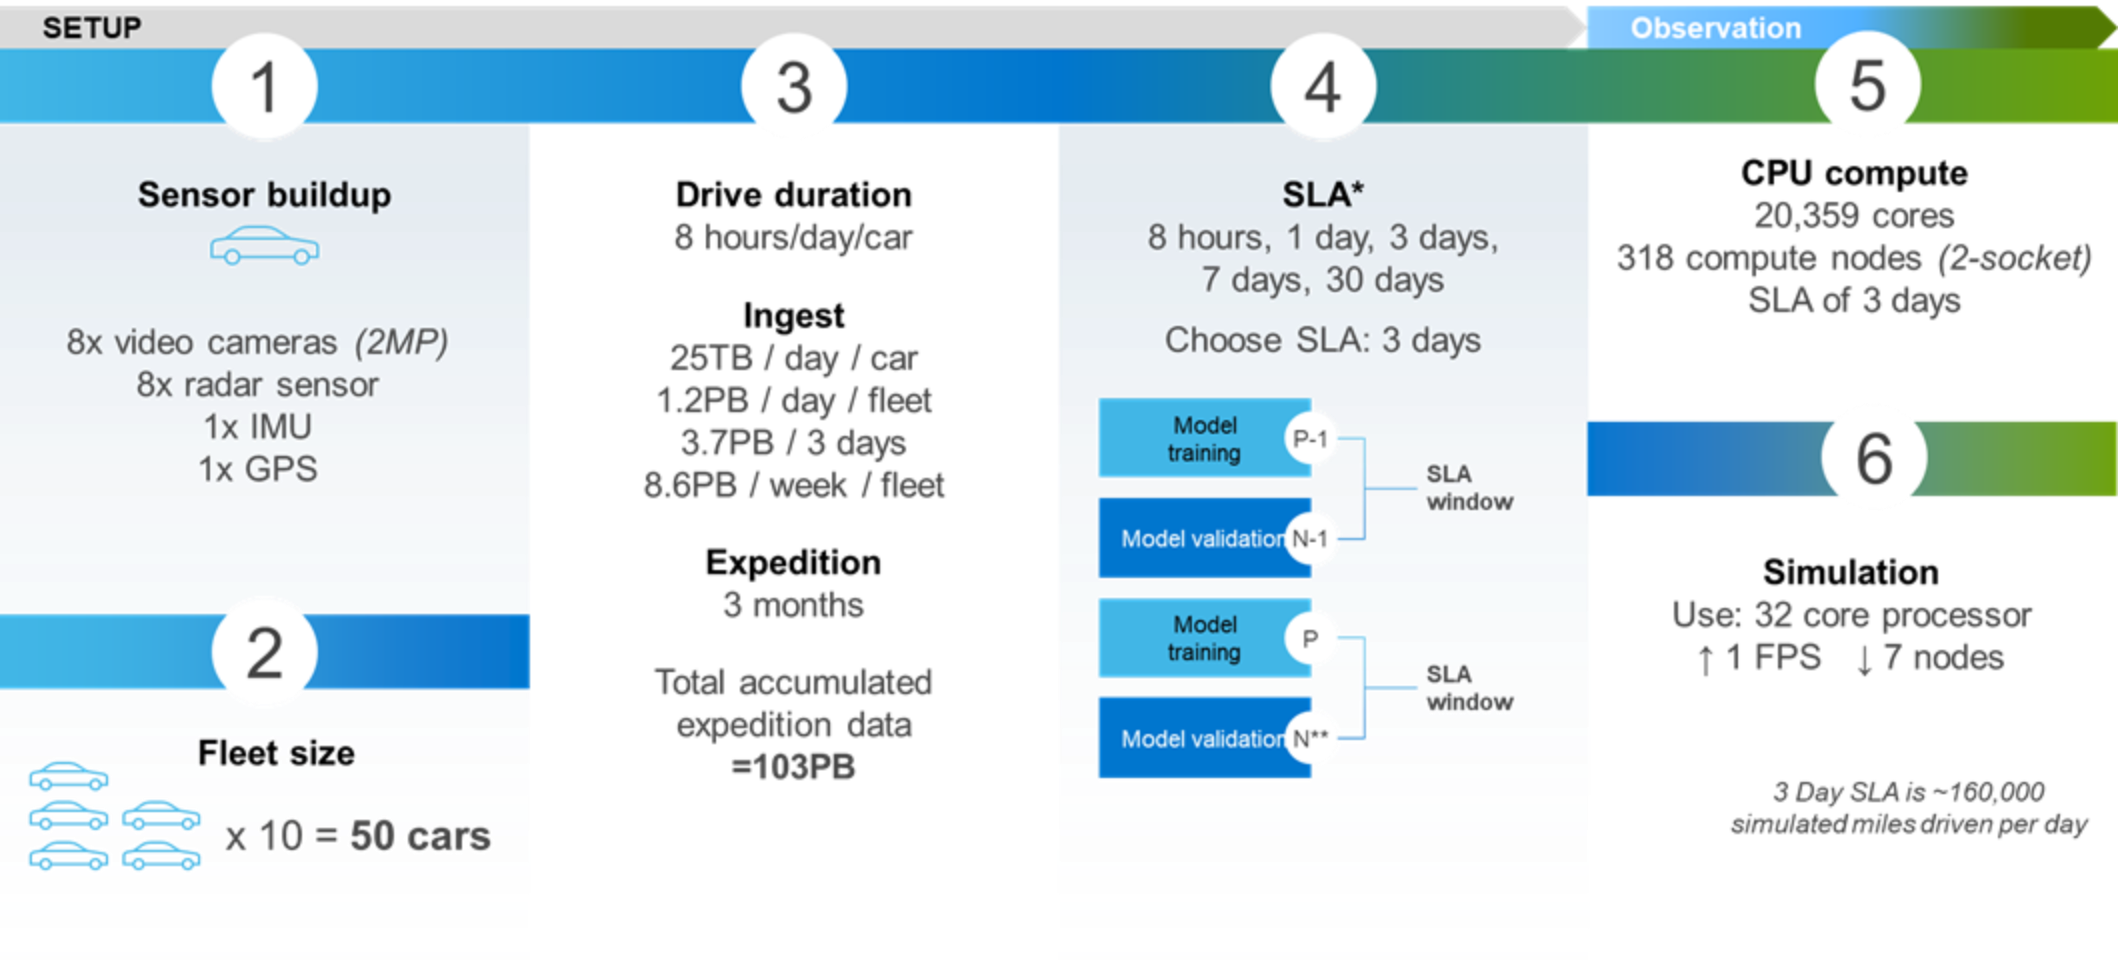
Figure 11. Infrastructure sizing example steps 1 through 6In the figure:
- Steps 1, 2, and 3 calculate the total amount of storage required for a hypothetical three-month expedition.
- Step 4 chooses the Service Level Agreement (SLA). The SLA determines the stated performance metrics required to achieve the project goals. For an SLA of three days, all 103 PB must be processed every three days to achieve 160,000 simulation miles. The graphic indicates that incremental model Training (P) and model V/V (N) are simultaneous activities, and all verification and incremental retraining occurs in a three-day window.
- Step 5, based on the selected SLA, shows that 53,000 simulated miles per day (160,000 miles in three days) require 20,359 cores and 318 (assumes 2-sockets/server, 32 cores/socket) compute nodes. This calculation was performed with aggregate system performance (FPS) from Figure 10 of 300 FPS for eight GPUs and a three-day SLA chosen in Step 4.
- Step 6 shows how sensitive sizing is when compared to node performance (FPS). For every FPS increase, the number of compute nodes can be reduced by seven. This step also indicates the importance of optimizing the single node server configuration before building out a scale-out environment. Overprovisioning and under provisioning can result in cost overruns or unmet SLA deadlines.
The following figure shows the last four steps of the sizing example.
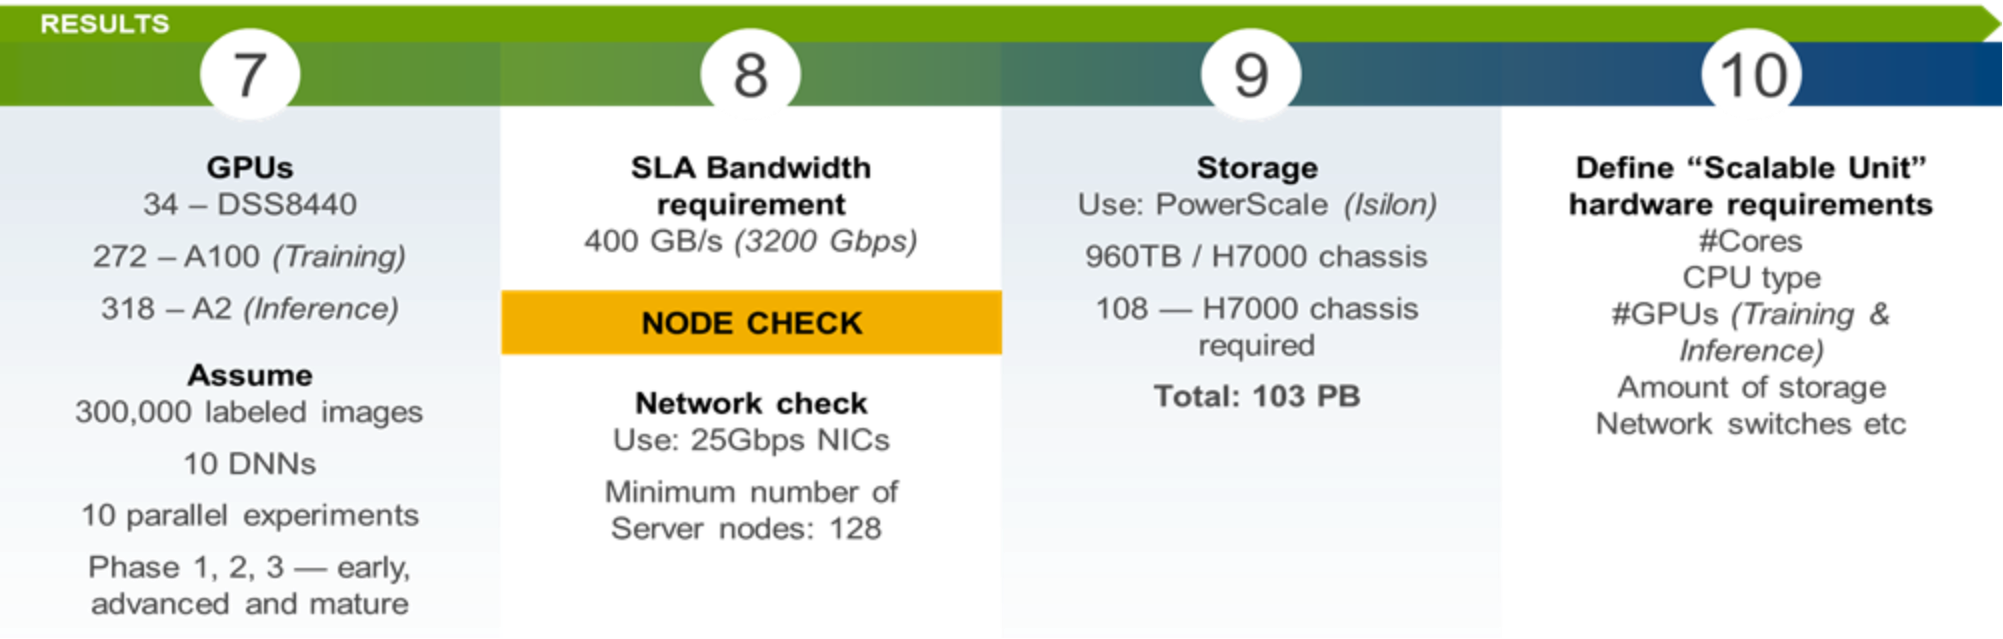
Figure 12. Infrastructure sizing example steps 7 through 10- Step 7 is a GPU sizing section for training and inference and requires a unique sizing procedure that is beyond the scope of this exercise. Contact your GPU provider for GPU sizing guidance. For this example, given the input constraints of Steps 1 through 4, we determined that using 34 (8 x GPU servers), 272 NVIDIA A100 GPUs, and 318 NVIDIA A2 GPUs for inference meets all SLA requirements. An updated sizing exercise would use the most current DVD for AI configurations that include the PowerEdge XE9680 GPU servers (MI300x GPUs for training and inference) and NVIDIA L40S GPUs for rendering (rendering GPUs are integrated into each simulation server).
- Step 8 is called a “Node check” to determine if there is sufficient network bandwidth to process 103 PB during the specified SLA period. The minimum number of nodes to satisfy the SLA requirements is 128 nodes. In Step 5, we required 318 compute nodes, which easily exceed our network bandwidth requirements.
- Step 9 determines which storage platform to use. In this example, we use 108 PowerEdge H7000 nodes to safely store 103 PB.
- Step 10 defines an SU to add additional resources to the existing environment. This addition is customer driven based on workload, project milestones, environmental constraints, and financial resources.