
kdb+ with PowerScale
kdb+ with PowerScale
-
kdb+ databases, which are stored on disk as a series of files and directories, are well suited for a PowerScale high-performance, scale-out NAS solution. The kdb+ design makes handling tick databases easy because database files can be manipulated as regular files across a PowerScale cluster. Therefore, you can back up a kdb+ database by using any standard file system backup utility or by using PowerScale OneFS Snapshot or SyncIQ features. This backup capability is a key difference from traditional databases that use proprietary backup utilities and do not allow direct access to the database files.
kdb+ also uses standard operating system features for accessing data (memory-mapped files), whereas traditional databases use proprietary techniques to accelerate the reading and writing processes. The typical kdb+ database layout for a tick-based system is partitioned by date, although integer partitioning is also possible. The following figure shows the various file system entities that constitute a kdb+ tick database. The Linux program “tree” is issued from a kdb+ database server to show the directory layout. All the directories and files reside on the PowerScale system.
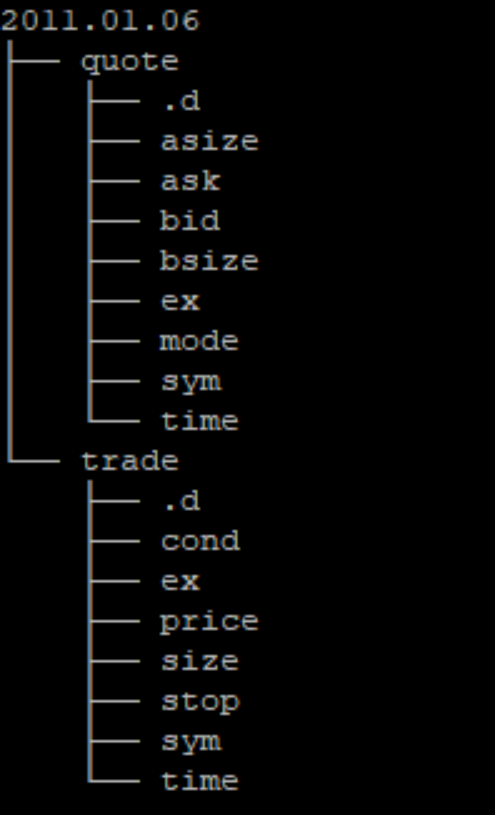
Figure 2. Example of kdb+ tick database on Dell PowerScale
kdb+ partitioning on PowerScale OneFS
kdb+ provides a simple method to allow the partitioning of kdb+ data across an array of OneFS NFS mount points. A single text file (par.txt) is populated with a list of directories, one per line. If the storage to be used is DAS or SAN-attached, each line represents a discrete file system. However, with PowerScale OneFS as the storage platform for tick data, each line can be a separate partition directory within the OneFS file system. The OneFS file system provides a single namespace and simplifies data management, security, and scalability.
kdb+ is intelligent enough to balance new data on ingest to each of the OneFS mount points. Dated directories are effectively round-robin assigned to a given mount point. A single day’s data lives on at most one mount point. When configuring a kdb+ par.txt file with PowerScale OneFS, follow these guidelines:
- Use as many PowerScale nodes as possible to maximize I/O throughput.
- Use each PowerScale node equally. For example, if you have three PowerScale nodes and six kdb+ threads, ensure that each node has two mount points.
- Ensure that each mount point goes to a separate subdirectory.
- If applicable, spread the mount points across more than one client-side network interface.
The following kdb+ par.txt file is an example of a configuration for a three-node Dell PowerScale F900 all-flash NAS system:
/mnt/f900_1/p1
/mnt/f900_2/p2
/mnt/f900_3/p3
/mnt/f900_1/p4
/mnt/f900_2/p5
/mnt/f900_3/p6
/mnt/f900_1/p7
/mnt/f900_2/p8
/mnt/f900_3/p9
To promote even performance across all threads, ensure that each partition contains an equal portion of the dataset. For example, the following figures show listings of the tick data contents of PowerScale partitions 2 and 3:

Figure 3. Partition 2 listing

Figure 4. Partition 3 listing
Both partitions have 32 entries—an even tick data distribution. With nine mount points defined in the preceding par.txt example, configure kdb+ with nine or fewer threads. When a kdb+ q1 process is started with worker threads (as is typical), each of the partitions in par.txt is handed out to worker threads in a round-robin fashion. If there are more par.txt lines than workers, each worker will get assigned some number of par.txt entries, resulting in an uneven distribution of work across the worker threads. If possible, ensure that the number of entries in par.txt is divisible by the number of worker threads.
For example, if you have a par.txt file with eighteen mount points, and you have six worker threads, each worker thread will get three mount points, resulting in even performance across all threads. If the balance of mount points among worker threads is not even (for example, if we had fourteen mount points in the previous three-thread example), performance between threads would be uneven.
The runtime of a database query is gated by the speed of the slowest thread. If some threads are responsible for a larger set of data than others, they will slow the entire query down because idle threads cannot be dynamically reassigned to share work with other threads. The goal of many kdb+ queries (such as find all trades for all symbols where bidPrice was greater than 50) is to scan through a date-range worth of ticker history (for example, the last 21 days), and return a result. This query results in a full table scan of all data in this date range.
Each kdb+ q process performs scans of data under its jurisdiction. When each worker thread is finished reading data, it reports the result to the parent thread, which then collates the data and presents it back to the user or application that initiated the query. However, the parent thread cannot tabulate the results until all worker threads have reported back. Thus, the overall runtime can be negatively affected when a single thread underperforms its peers, which is the primary reason for balancing load as evenly as possible among threads. If the data is not evenly distributed across all the partitions, run the mv command to move specific tick data from one PowerScale partition to another until you achieve an even tick data distribution. kdb+ will automatically find the data throughout all PowerScale partitions during data scans.
1 q is an integrated programing language within kdb+.