


VMware Visibility in CloudIQ

Introduction
In the last several years, there has been an increased desire for deeper visibility and insights into what is going on within customers’ data centers. Especially with wider adoption of AI/ML, demand for insight-driven outcomes has increased. Customers are looking to have a single pane of glass that has visibility into their infrastructure.
Benefits
One of the major benefits I see for customers who invested with Dell across our broad portfolio is that CloudIQ truly becomes that single pane of glass. It enables customers to integrate toCloudIQ using WebHooks and REST API with external tools and create actionable processes. One example would be integration with ServiceNow. The other benefit is the breadth of the insights based on AI/ML algorithms and our capability to not only be descriptive in our recommendations, but also become more prescriptive.
I can go on and on describing the benefits of CloudIQ, but in this blog, I would like to focus on the CloudIQ Collector. Although customers are accustomed to using VMware vCenter to look up configuration and performance details specific to Virtual Machines and vVols, with AIOps-based tools like CloudIQ, the goal is to bring this information together in a single management pane of glass. Customers using Dell primary storage solutions can leverage the CloudIQ Collector to bring visibility at the VMware Virtual Machine level inside the CloudIQ portal. I can see this capability enabling customers to use CloudIQ for the following use cases:
- See the end-to-end map making up the virtual infrastructure. This information includes the ESXi cluster, the ESXi host, the switch, the storage array, the datastore, and the virtual machine.
- Simplify troubleshooting. You will see later in this blog that having visibility at the entire end-to-end map allows customers to view performance impacts (IOPs, Bandwidth, Latency) as well as ESXi host-specific performance metrics.
- Leverage CloudIQ integration through WebHooks and REST API with external tools for notifications, alerting, reporting, and so on.
CloudIQ Collector
The Dell CloudIQ Collector is a VMware Open Virtual Appliance (OVA) using Open Virtualization Format (OVF) and is installed as a virtual machine that collects data from VMware environments, Dell Connectrix switches, and Dell PowerSwitch devices. The Collector retrieves information from the target objects (vCenter or switches) and sends the collected data back to CloudIQ using a Secure Connect Gateway. For VMware, the Collector communicates to vCenter by using the VMware API and requires a user with read-only privileges. For Connectrix and PowerSwitch devices, the Collector communicates to the individual switches using REST API and uses a nonprivileged user. A single collector can be used for VMware, Connectrix, and PowerSwitch.
The theme again is to provide overall visibility across different pieces of infrastructure to our customers. The CloudIQ Collector Overview white paper does a nice job on how to implement the Collector, but here I will go more into the functionality and what data we present to our customers.
Once the CloudIQ Collector is installed and fully configured, VMware data will appear in CloudIQ within 24 hours and will be accessible within the following views in the CloudIQ portal.
- On the Virtualization page:
- Monitor > Virtualization
- On a system inventory page:
- Monitor > Systems (click an array, click the inventory tab, click the virtual machines tab)
- On a hosting storage object (Pool, LUN/Volume, or Storage Group) inventory page:
- Monitor > Systems (click an array, click the inventory tab, click the pools tab, click a pool, click the virtual machines tab)
- Monitor > Systems (click an array, click the inventory tab, click the storage groups tab, click a storage group, click the virtual machines tab)
- Monitor > Systems (click an array, click the inventory tab, click the storage tab, click a storage object (LUN/volume/file system), click the virtual machines tab)
- On a host or server properties page:
- Monitor > Systems (click an array, click the inventory tab, click the hosts or servers tab, click a host, click the virtual machines tab)
- Through global search
VMware visibility in management tools
Traditionally customers with Dell’s primary storage have had a certain level of visibility into their VMware environment. It typically was accomplished by linking VMware vCenter with our management tools for products like PowerMax, PowerStore, and Unity XT. For reasons of keeping this blog concise, I will focus on PowerStore, but as mentioned above, other Dell primary storage products have visibility into the VMware environment from their respective element managers.
The Dell PowerStore management UI is called PowerStore Manager. Integrating PowerStore Manager with VMware vCenter is straightforward. If integration is successful, you will see the status turn to green and show OK.
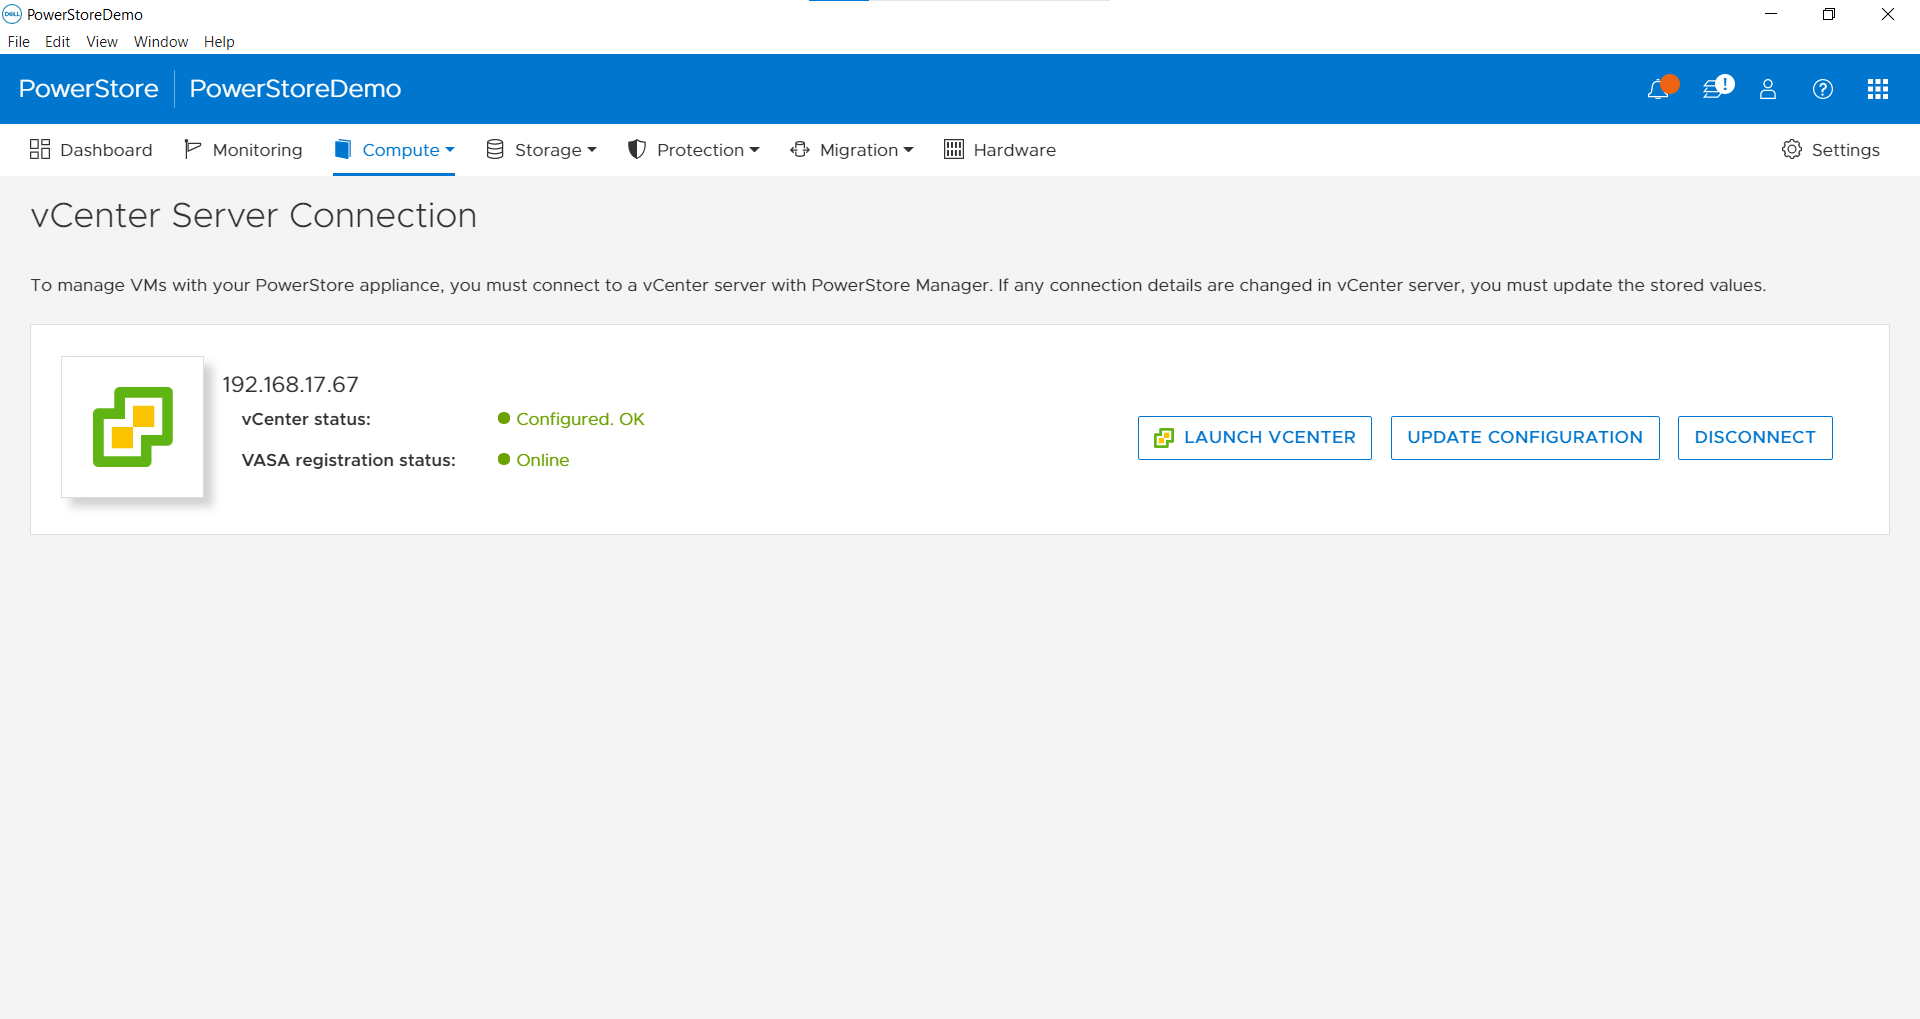
Figure 1. Registered vCenter in PowerStore Manager
This integration with vCenter will populate the Virtual Machine tab in PowerStore Manager.
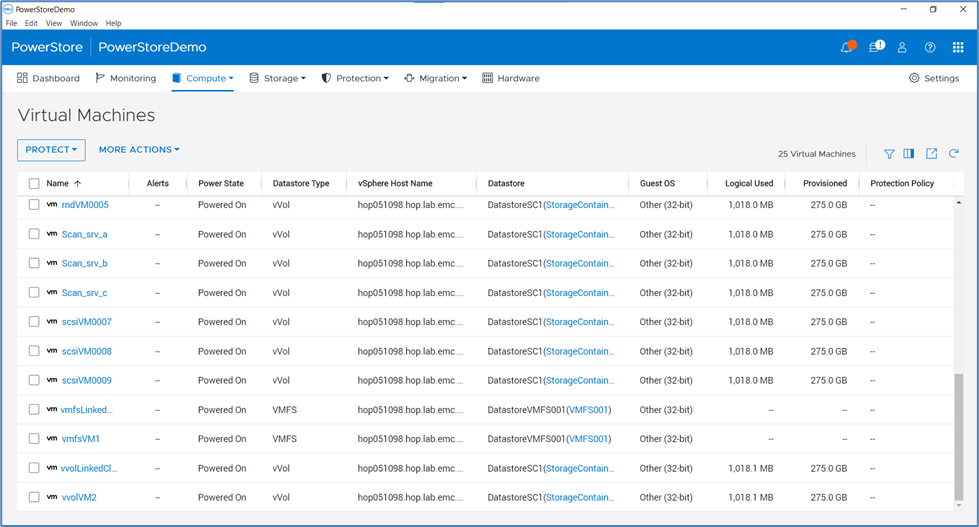
Figure 2. Virtual Machines page in PowerStore Manager
As you can see, we support vVol, VMFS, and NFS based virtual machines. You can also expand the view by adding additional columns by clicking “Show/Hide Table Columns” on the right side of the screen.
The virtual machine names column allows users to click each virtual machine and see additional details.
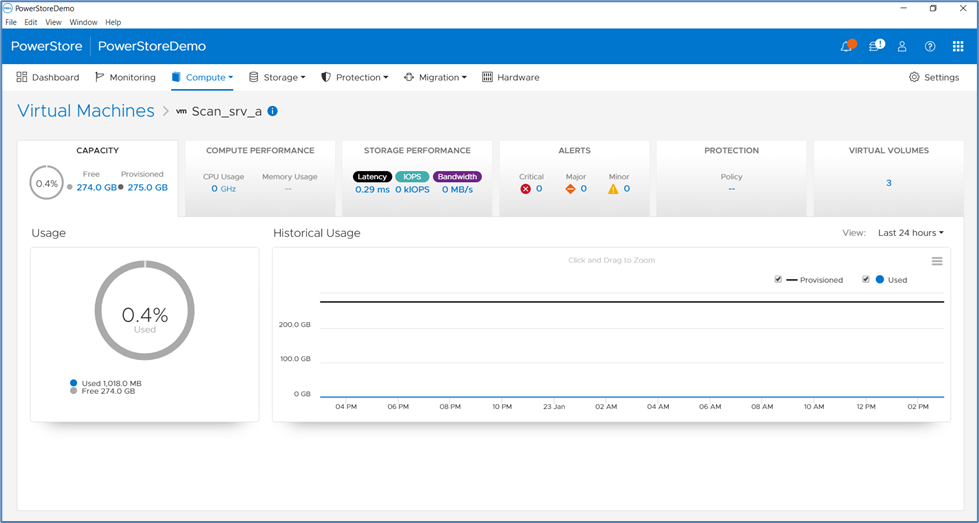
Figure 3. Virtual machine details
The above image demonstrates a detailed view of a vVol virtual machine. You can navigate through multiple tabs that show additional and deeper details, such as performance and storage-related metrics, data protection policies applied, and so on.
The other integration point you can explore is the datastore a virtual machine resides in. This comes in handy when customers need to troubleshoot a specific issue, or simply map out the components. A PowerStore administrator can trace the virtual machine directly to either Storage Container, VMFS block LUN, or an NFS-based datastore, without leaving the virtual machines view of the PowerStore Manager.
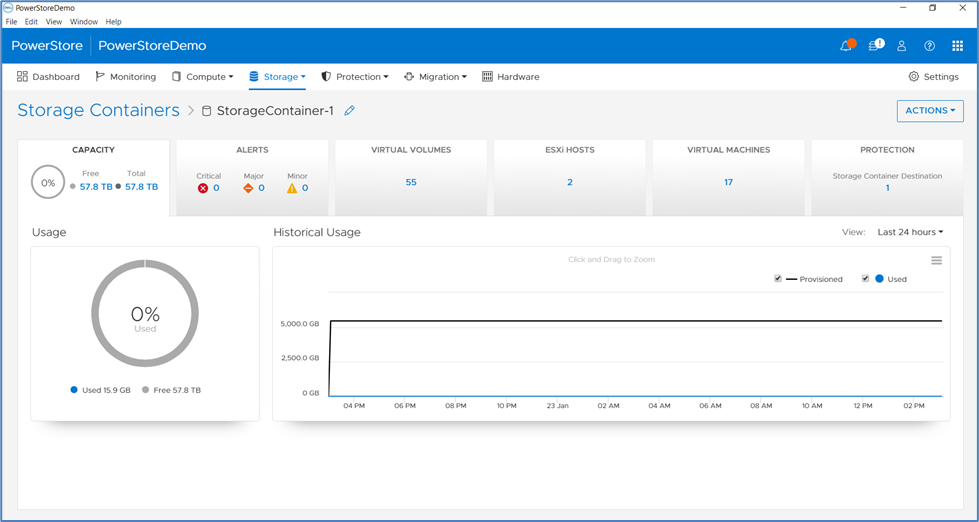
Figure 4. Storage container details
In the above image, I selected a Storage Container that holds one of the vVols. Once again, you see a consistent view, with multiple tabs allowing you to easily navigate and look up additional details.
VMFS or NFS based virtual machines follow the same logic. We collect and present slightly fewer details than vVol based virtual machines, but this is where CloudIQ Collector supplements this view.
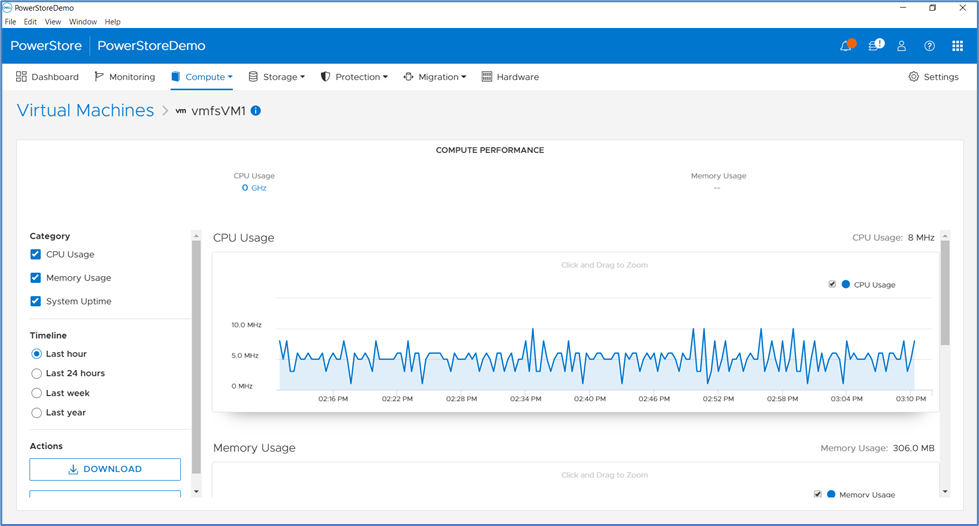
Figure 5. VMFS virtual machine performance chart
VMware visibility in CloudIQ
I have been guiding all my customers to embrace CloudIQ over the past several years. And although CloudIQ is provided to customers as a Software-as-a-Service application, the CloudIQ Collector is one of the elements that will need to be installed inside the customers’ data center to monitor VMware, Connectrix switches, and PowerSwitch devices.
Logging in to CloudIQ is based on the customers’ accounts registered with a Dell support contract. In addition to this, customers can leverage Role-Based Access Control (RBAC) implemented within the CloudIQ portal.
Once logged in, customers can explore the categories shown on the left side of the CloudIQ portal. The categories that we will be focusing on in this blog are under the ‘Monitor’ category.
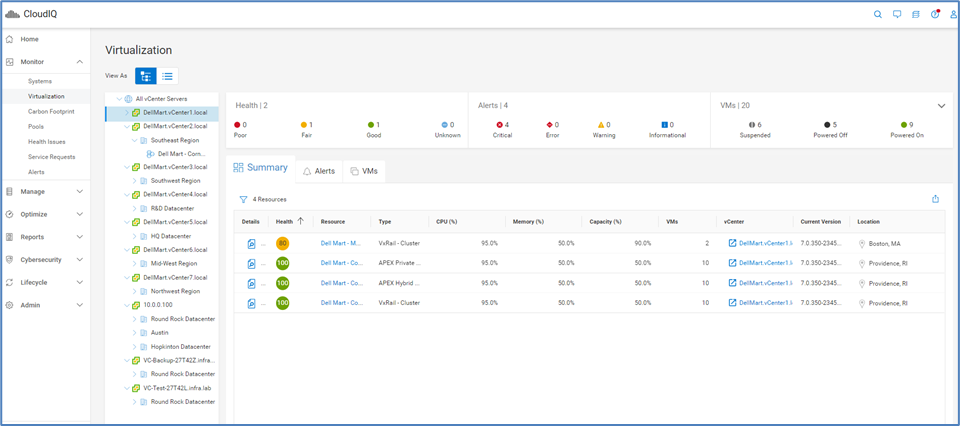
Figure 6. Virtualization View in CloudIQ
The Virtualization view enables you to view and manage components such as the vCenter, data center, and clusters using the tree view and the table view. It also displays information about each VMware vCenter server in the system. For those customers who use Dell HCI solutions like VxRail, and Dell primary storage products, like PowerStore, or simply a VMware ESXi environment managed by a vCenter, this view will have a consolidated view of all these environments.
Across the top, customers can see a quick snapshot of the overall status of the environment.
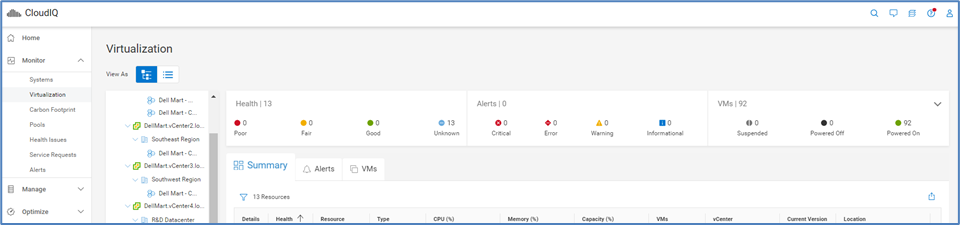
Figure 7. Summary banner
The navigation panel on the left shows you all vCenters with their respective clusters and data centers. Customers can browse through the list and select a particular cluster. As the image below shows, you can start zooming in on each virtual machine listed under the VMs tab. The areas I highlighted below are hyperlinks and allow customers to get additional details for each virtual machine.
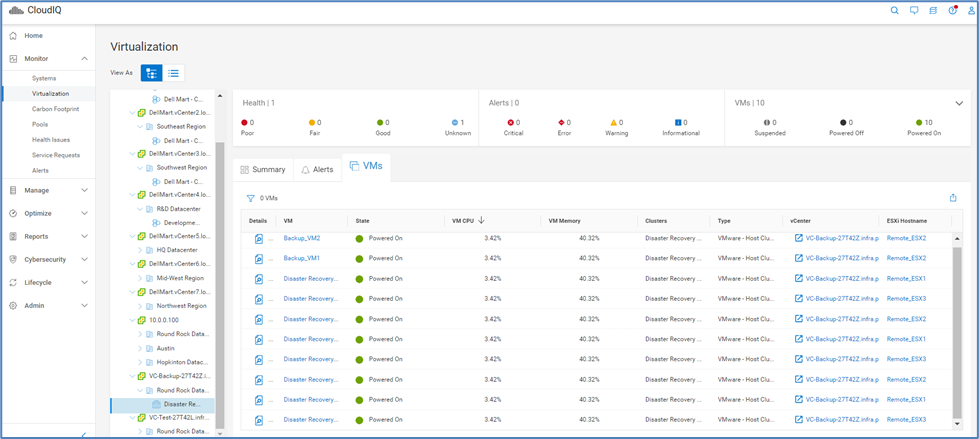
Figure 8. Virtual Machines tab
Clicking the Backup_VM1 virtual machine leads me to the VM details page.
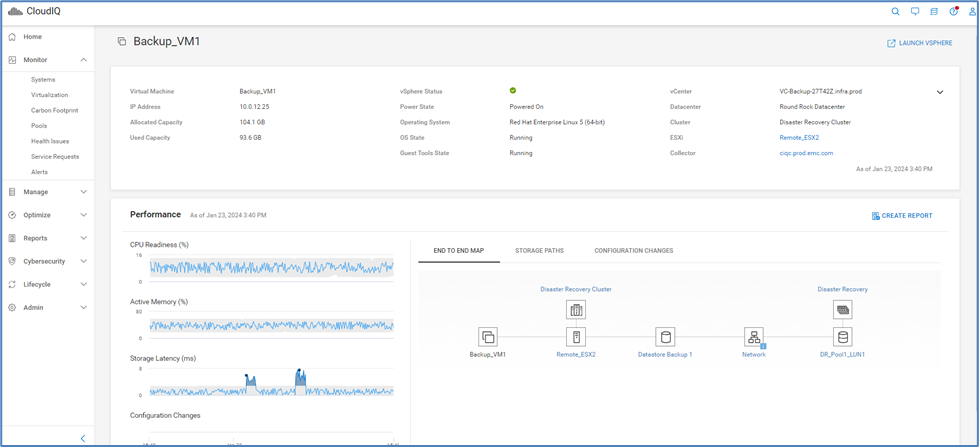
Figure 9. Virtual machine details page
This is where it starts to get interesting. For example, customers can see our AI/ML algorithms in action in the form of anomaly detection. CloudIQ collects telemetry data and compares metrics against historical seasonality. We can identify issues, like increased latency, as we compare data against what we saw in the past for the same period.
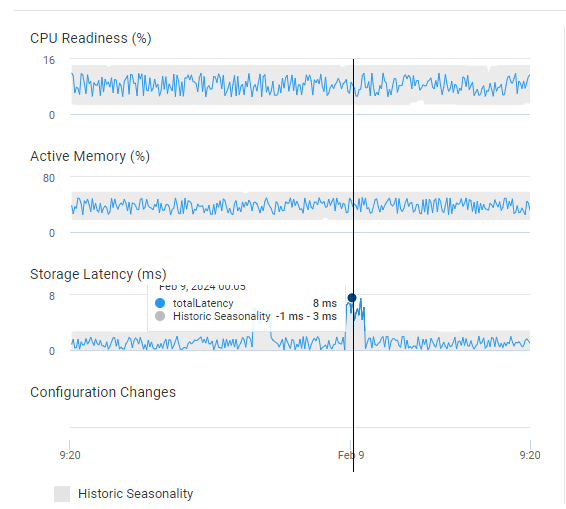
Figure 10. Performance anomaly detection
Toward the bottom of the view, you can see a section called “Configuration Changes.” We display hourly aggregated configuration changes that have been made to this Virtual Machine and by charting them along the time access, you can potentially correlate a configuration change with a change in performance profile.
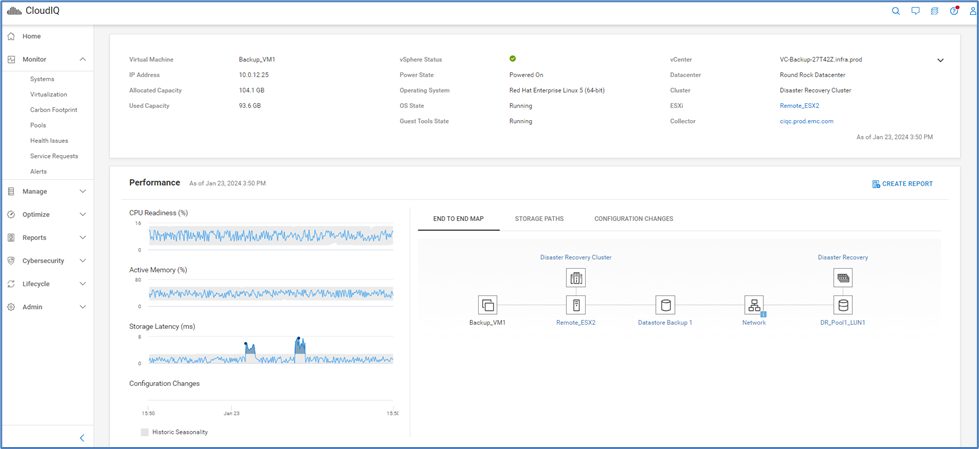
Figure 11. Configuration change tracking
The right side of this view is showing three tabs:
- End to end map
- Storage paths
- Configuration changes
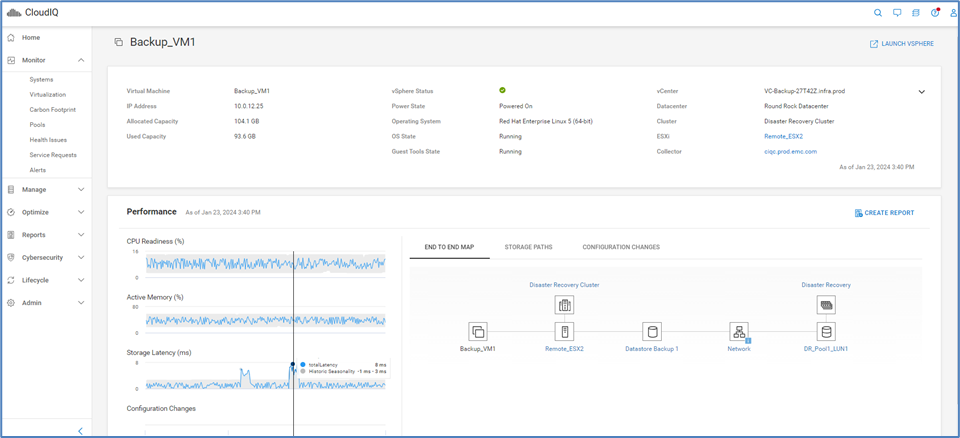
Figure 12. End to end map
End to End Map displays an interactive topology map showing the components including inventory and basic performance. Selecting the cluster, host, datastore, network, storage entity, or array displays more object details underneath the topology map.
Storage Paths provides information for the datastore storage paths including the associated host adapter worldwide name (WWN), fabric, and array adapter.
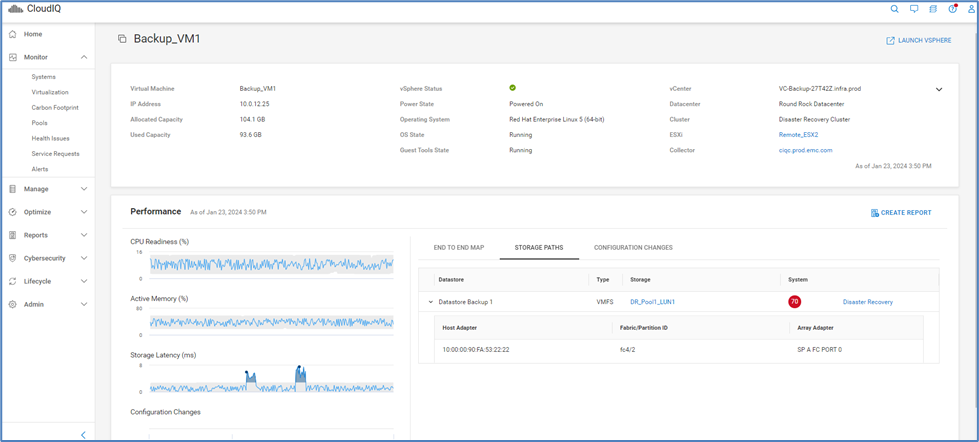
Figure 13. Storage paths
Configuration Changes displays configuration changes for the last 24 hours for the virtual machine.
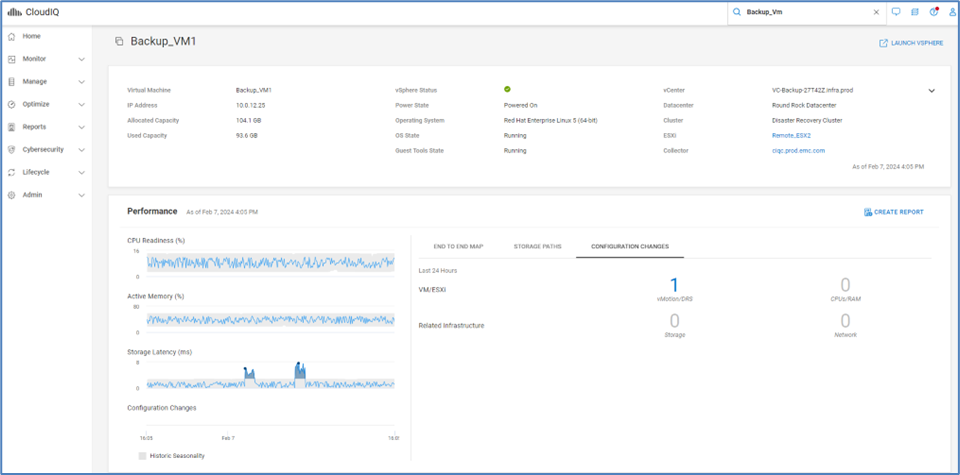
Figure 14. Configuration changes
If you use other solutions from the Dell Technologies portfolio, such as PowerEdge servers for your VMware ESXi clusters, there is yet another option/view you can explore. You can navigate between the VM details page and the PowerEdge details page to quickly see related information.

Figure 15. PowerEdge system details page
Custom Reports
To round off our discussion, customers also have reporting capabilities that can be leveraged.
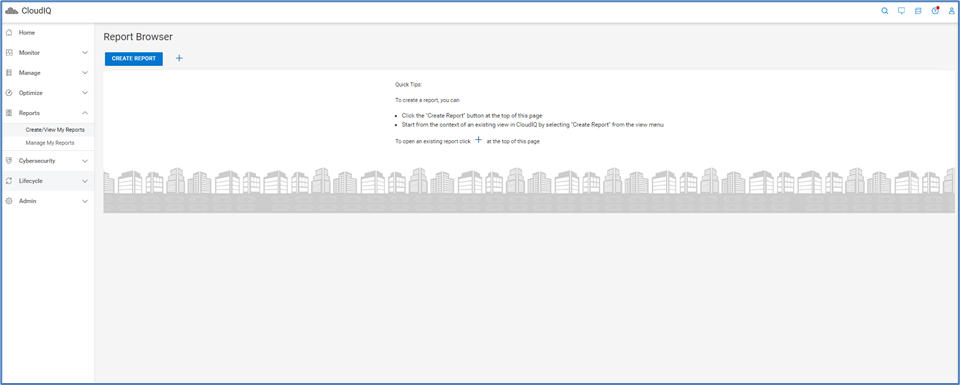
Figure 16. Report browser
Customers can generate several types of reports:
- Anomaly Chart
- Line Chart
- Table
If you would like to report on the inventory of Virtual Machines, a table would be sufficient.
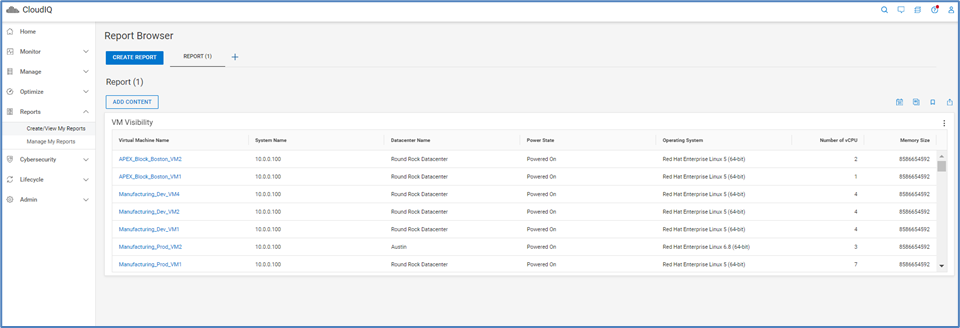
Figure 17. Example of a custom table
When creating a table, there is a set of default columns preselected. You can choose to include additional columns from the available columns list or remove some of the preselected ones.
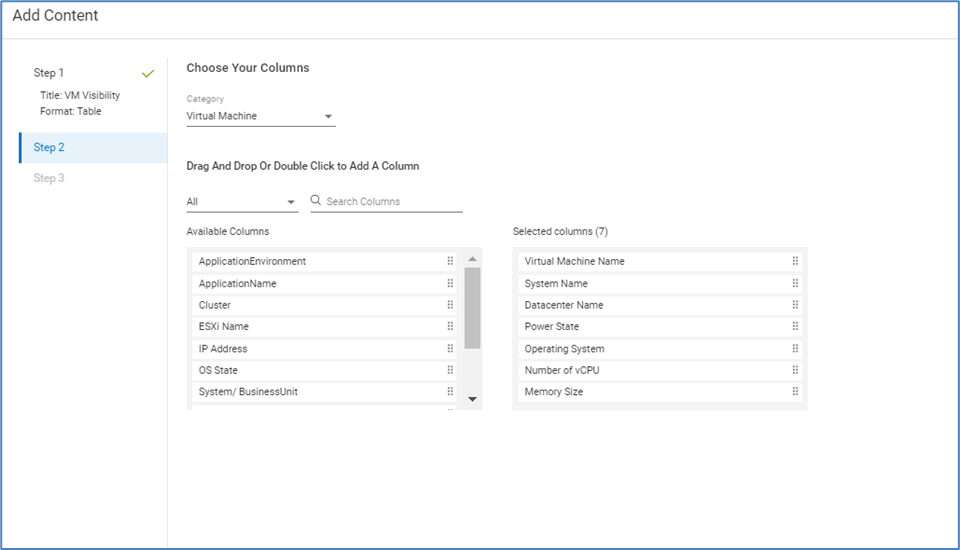
Figure 18. Customizing columns in a table
The second option is to generate a line chart which shows historical performance data. As I am demonstrating below, you can select ‘VMware’ as the product category and ‘Virtual Machine’ as the subcategory. This selection will show you all the virtual machines available in the inventory. Feel free to select one or more virtual machines and go to the next screen. Filtering capabilities are available to display and select specific VMs.
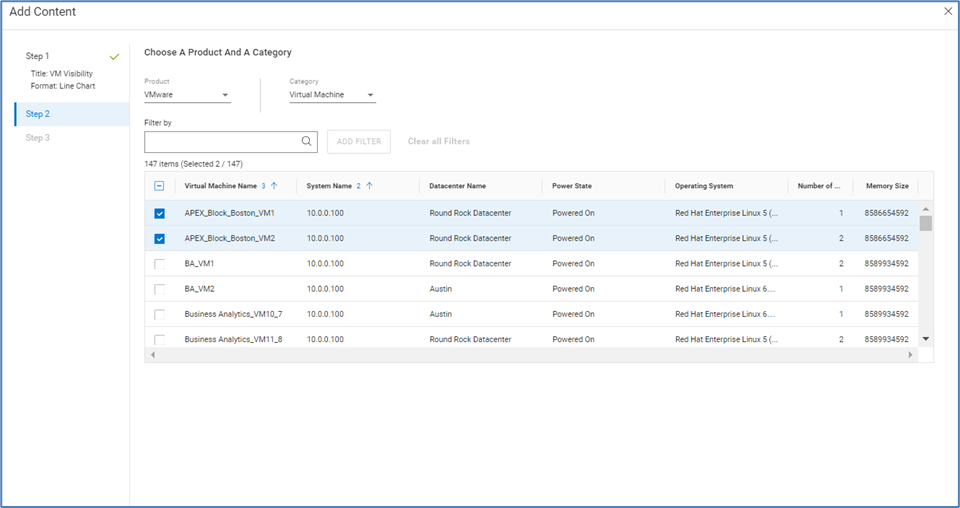
Figure 19. Configuring a line chart
The next screen is where you select the metrics you want to include in your report.
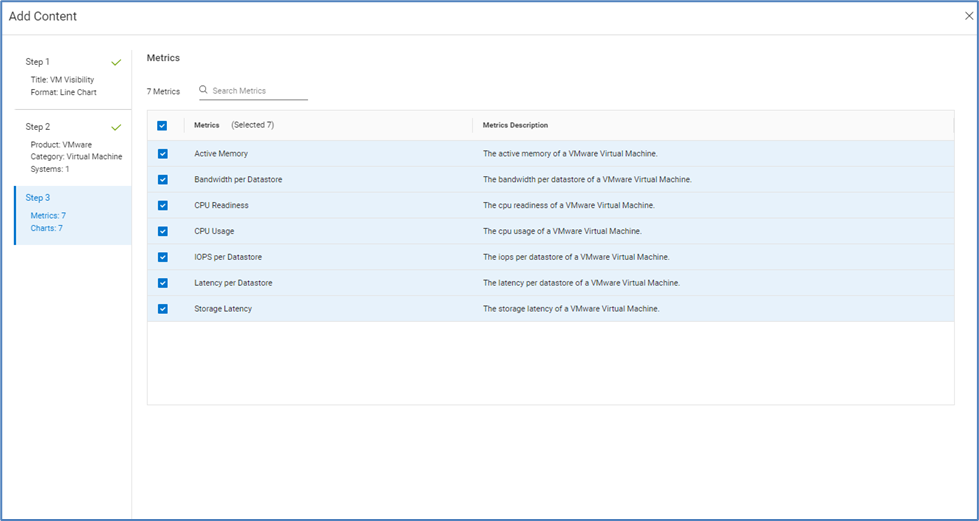
Figure 20. Metric selection
By default, the resulting report shows you data for the last 24 hours. Since CloudIQ keeps 2 years of historical data, you can define a larger window by clicking the drop-down menu.
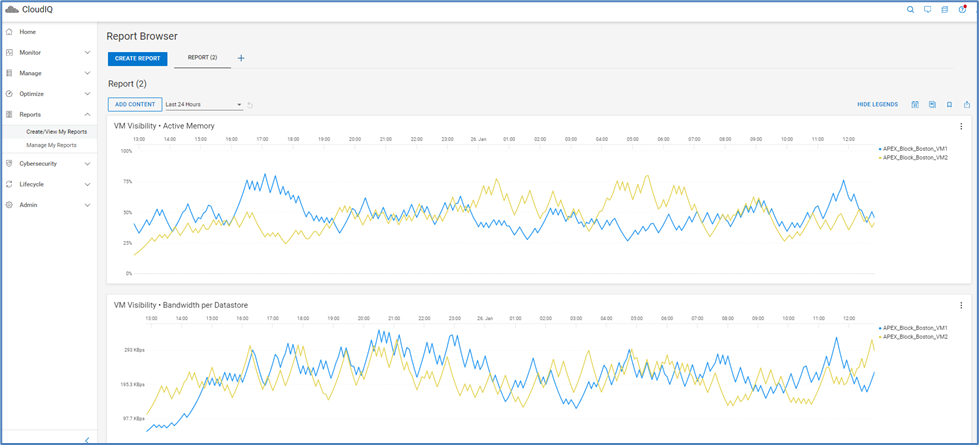
Figure 21. Line chart example
As you can see above, you can correlate performance for virtual machines that might have dependencies, but you can also click either virtual machine on the right side and dim down the graph, so it doesn’t interfere or crowd the screen.
Once you are happy with the data on the screen, you can schedule the report and save it in a PDF format.
Conclusion
As you can see, there is a plethora of information available to customers across Dell management software. In CloudIQ, there are many other views that can show additional details about virtual machines and volumes, for example when browsing a server or a datastore. I encourage you to connect with a Dell representative and schedule a full demo of this product.
Resources
Important Links:
https://www.dell.com/en-us/dt/solutions/cloudiq.htm
https://infohub.delltechnologies.com/t/cloudiq-a-detailed-review/
https://infohub.delltechnologies.com/t/dell-cloudiq-collector-an-overview/
https://developer.dell.com/apis
Authors:
Michael Aharon, Advisory Solutions Consultant;
Derek Barboza, Senior Principal Engineering Technologist
Related Blog Posts

CloudIQ - Carbon Footprint Analysis
Wed, 04 Oct 2023 16:03:26 -0000
|Read Time: 0 minutes
In this blog post, we’ll cover a topic that is top of mind for all organizations, small and large--Energy Efficiency. I’ll also highlight how Dell Technologies helps customers increase energy efficiency using our vast portfolio. First, let’s define what Energy Efficiency is.
“Simply put, energy efficiency means using less energy to get the same job done
– and in the process, cutting energy bills and reducing pollution.”
Reference: Energy Efficiency | ENERGY STAR
As organizations undergo digital transformation and modernization, there is a massive explosion in the amount of data that needs to be stored. This data expansion is driven by technologies like Cloud Computing, Artificial Intelligence, and streaming services, just to name a few. This in turn impacts how much power organizations are now consuming in their data centers, which forces IT vendors to make their solutions more efficient and reduce emission and carbon footprint.
Dell Technologies has been helping customers harness the power of technology to drive human progress for several decades. Our latest Environmental, Social and Governance report focuses on the investments Dell has made to support these initiatives.
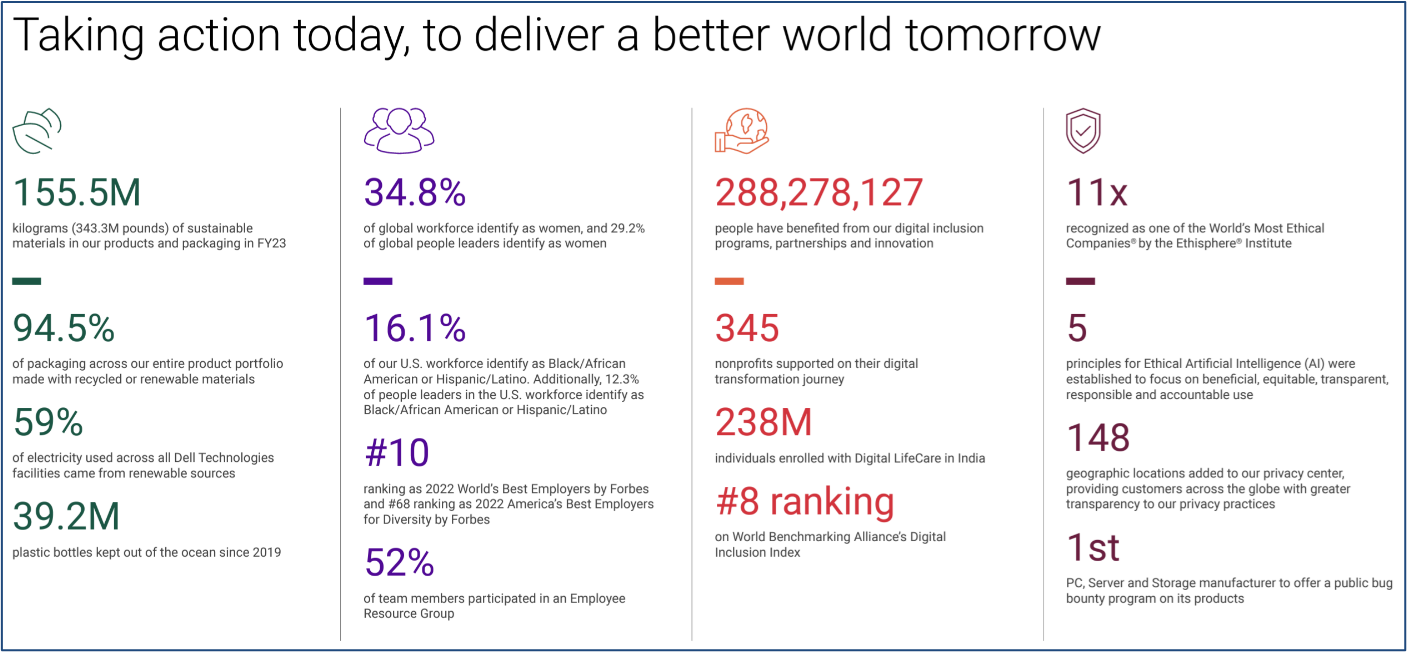
If you’re interested in delving deeper, check out Dell's FY23 Environmental, Social and Governance.
Energy concerns were of paramount importance for our customers in 2022, not only in response to rising energy costs but also as they worked toward reducing emissions. As a leader in sustainable technology, Dell partnered with customers to make the transition to more energy efficient data centers with advanced cooling and thermals, power management tools, and as-a-Service (aaS) solutions to “right size” data storage. With the cost of energy commodities expected to be on average 46% higher in 2023, we will continue to set the standard on data center infrastructure solutions to drive efficient operational and environmental outcomes for our customers.
Dell reinvests over $4B in R&D on an annual basis, continuing to lead the market with our innovation in storage and data reduction efficiencies to save energy and reduce our carbon and hardware footprint.
Dell’s commitment to reducing carbon footprint is exemplified by the introduction of innovative ideas to optimize our portfolio. Recognized as one of the winners of Fast Company’s 2023 World Changing Ideas Awards, Dell’s Concept Luna was designed to showcase how the future of electronic devices can be one where they’re repaired instead of thrown out. Feel free review the full article, How Dell is infusing sustainability across its businesses, to learn more
Based on what we covered so far, we truly believe that informing our customers of critical data points that contribute to overall awareness of power, energy consumption, and carbon footprint is essential.
CloudIQ Carbon Footprint: integrating energy efficiency across systems
Several years ago, Dell Technologies developed a product called CloudIQ, the cloud-based AIOps proactive monitoring and predictive analytics application for Dell systems. CloudIQ leverages machine learning and other algorithms, notifications, and recommendations to help customers optimize compute, storage, data protection, and network health, performance, and capacity. CloudIQ supports a broad range of Dell Technologies products, including:
- Servers -- PowerEdge
- Storage -- PowerStore, PowerMax, PowerScale, PowerVault, Unity, Unity XT, XtremIO, and SC Series
- Data protection -- PowerProtect DD and PowerProtect Data Manager
- Converged and hyperconverged infrastructure -- VxBlock, VxRail, and PowerFlex
- Networking -- PowerSwitch and Connectrix, plus Dell Technologies APEX Data Storage Services
Over 90% of our customers actively use CloudIQ as their centralized dashboard to inform them proactively about KPIs across their Dell Technologies estate.
Introducing Carbon Footprint, an additional capability within CloudIQ designed to provide insights for power, energy consumption, and carbon footprint forecasting across all systems. At the time of the initial release, we are supporting the following products from our portfolio:
- PowerEdge
- VxRail
- Unity
- PowerScale
- Connectrix Systems
and focusing on the following KPIs:
- Total carbon emissions for this year (YTD)
- Energy consumption trends (monthly and YTD)
- 24H power consumption, 24H load on average
- Historical and forecast data for energy and carbon footprint
Later in 2023, we will also add support for PowerSwitch.
Having Carbon Footprint enabled and KPIs exposed within CloudIQ is beneficial to internal stakeholders within an organization and allows you to make confident decisions when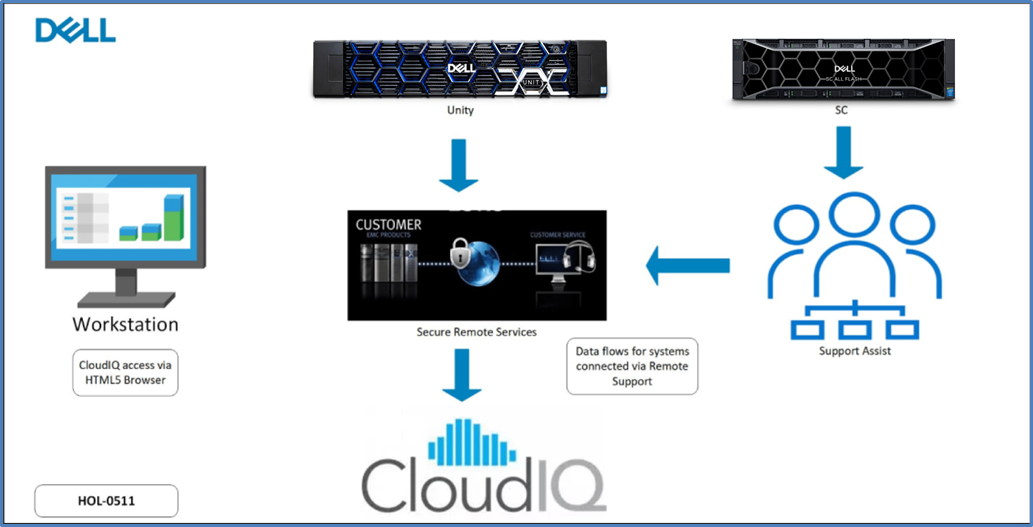 optimizing your environment.
Based on the Software-as-a-Service (SaaS) model and agile development methodology employed by CloudIQ, you’ll benefit from having access to new features as soon as they become available.
Most Dell Technologies products supported by CloudIQ leverage our call home functionality called SupportAssist / Secure Connect Gateway. Depending on the product, you will need to enable the CloudIQ feature, after which the CloudIQ dashboard will populate with data.
For the full overview of the CloudIQ product, please see the detailed review whitepaper here.
Accessing and using Carbon Footprint
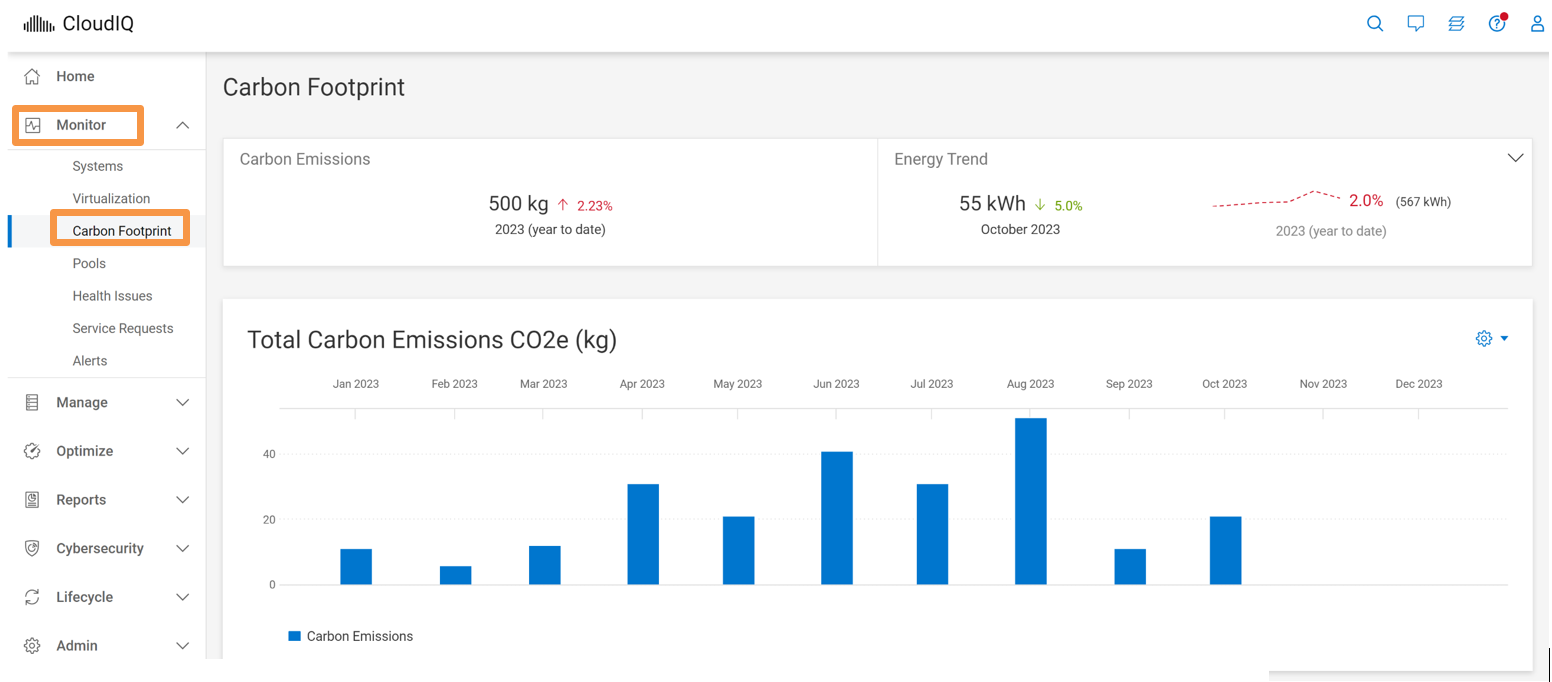
To access the Carbon Footprint feature in the CloudIQ dashboard, select Monitor > Carbon Footprint on the left-hand side of the CloudIQ console, as shown in the following figure.
On this screen, CloudIQ users with the CloudIQ Admin role will be able to adjust and personalize their geographical location metrics, such as CO2E and PUE, as illustrated in the following figure. The location labels reflect the specific locations where the physical assets are installed.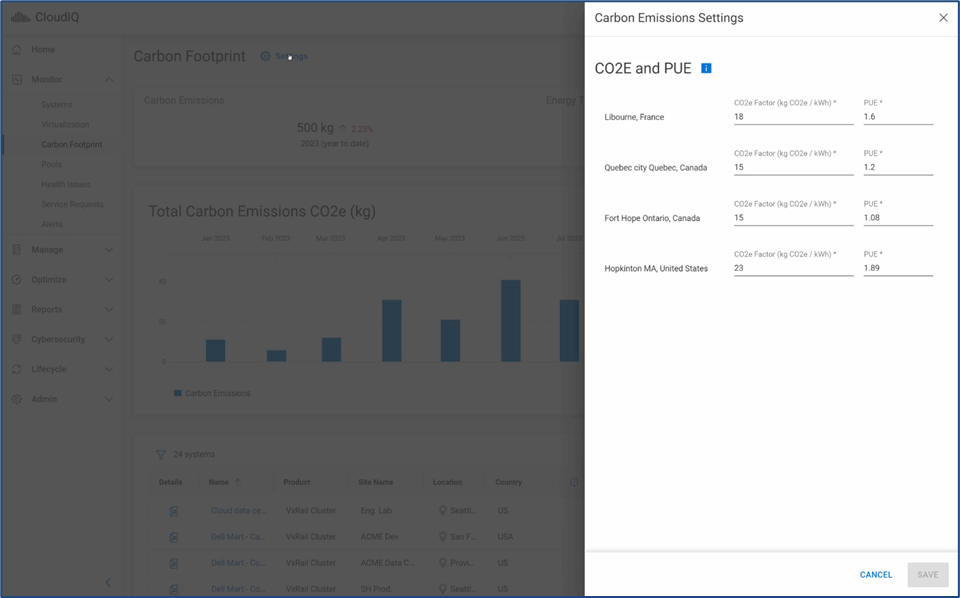
Side note: What do these metrics mean?
- Carbon dioxide equivalent (CO2e) refers to the number of metric tons of CO2 emissions with the same global warming potential as one metric ton of another greenhouse gas. Other greenhouse gases, like methane, have different global warming potentials--a measurement of the potential impact a greenhouse gas has on global warming over a given period--compared to carbon dioxide. By converting all greenhouse gas emissions into CO2e units, it becomes easier to compare the impact of different types of emissions and to create strategies for reducing GHG emissions.
- Power usage effectiveness (PUE) is used to determine the energy efficiency of a data center. The best PUE ratio is 1.0, indicating a perfectly efficient data center in which 100% of the facility's power is delivered to IT equipment. This means that no power is used for any other purpose in the facility such as cooling, lighting, or any other overhead that supports the equipment.
The Total Carbon Emissions CO2e section can be displayed using either a Bar Chart or a Line Chart. Simply select the gear wheel on the right-hand side and pick your preferred view.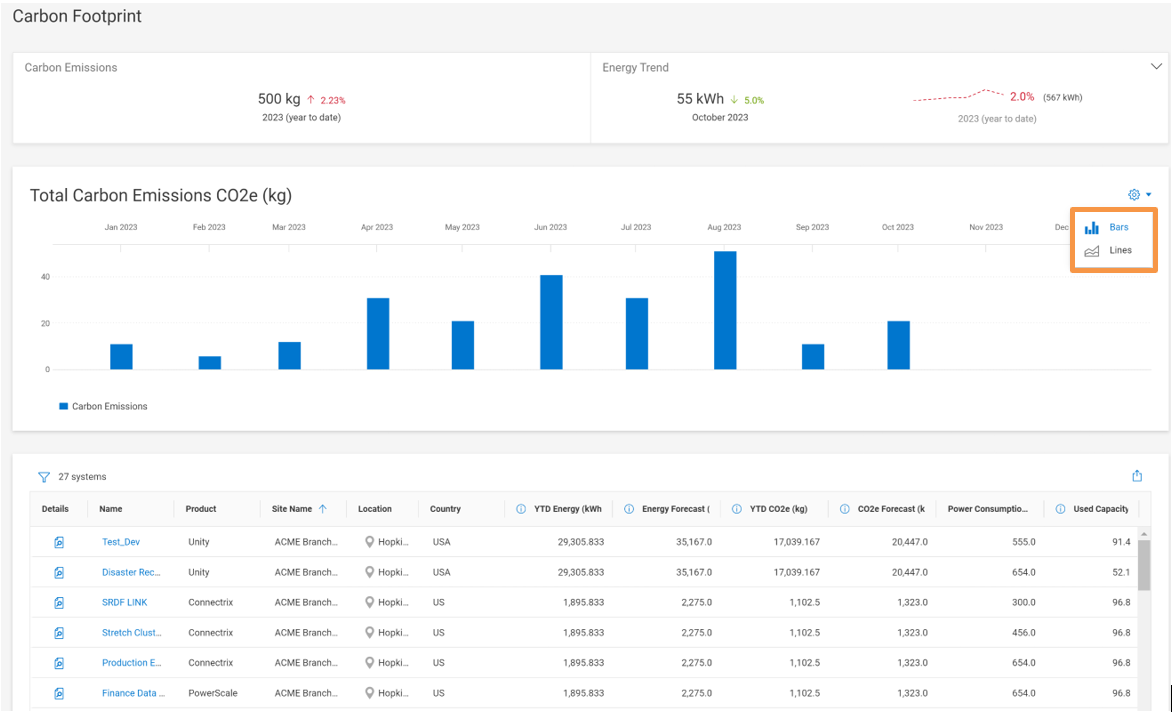
The Total Carbon Emissions CO2e chart can increase or decrease based on how the system’s energy / emission factor / PUE changes over time. If new systems are added, the total will increase. Similarly, the total can decrease if power is capped (as is available for PowerEdge), workloads are reconciled, and/or some systems are shut down.
For larger environments with multiple assets, applying filters is a breeze. The following example shows the system filtered based on Unity arrays only.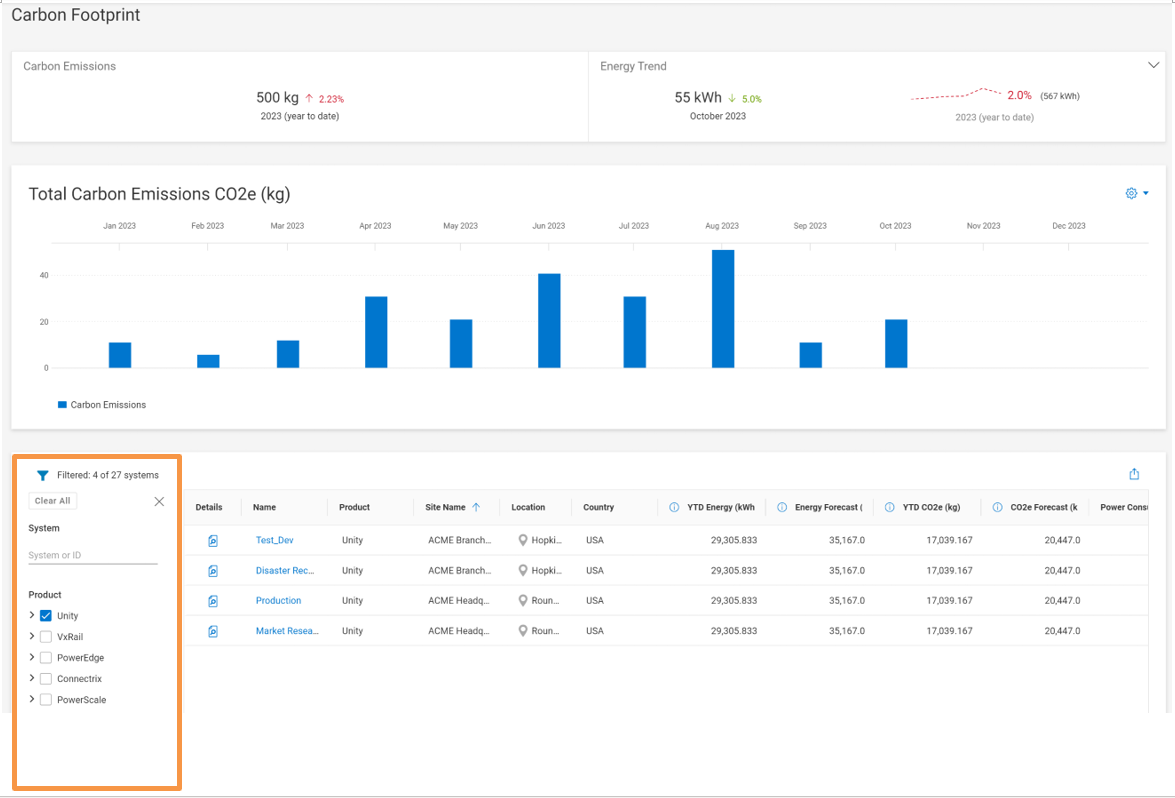
This table displays several columns that represent the asset itself, its location, site name, etc. In addition, we show the following data points:
- YTD Energy (kWh) - YTD value is from when power consumption data collection started, which may not have been the start of the calendar year
- Energy Forecast (kWh) - Forecasted energy consumption at the end of the year (December 31st) in Kilowatts (kWh)
- YTD CO2e (kg) - YTD value of carbon emissions measured when data collection started, which may not have been the start of the calendar year.
- CO2e Forecast (kg) - Forecasted CO2 (carbon dioxide) equivalent produced at the end of the year (December 31st) in Kilograms (kg)
The entire table with all assets or a subset thereof can be exported into a CSV file.
To see more details for each of the assets and how they perform in comparison to historical data, select the details icon next to the asset itself. As displayed in the following figure, the two graphs will display data points over the last seven (7) days and forecasted data points for the next thirty (30) days. By toggling the radio button, you can switch from one view to another. The grey area shows a range based on historical data collected for the previous seven (7) days, and the blue line is charted based on the last seven (7) days. If the blue line is within the boundaries of the grey area, this means there have been no unforeseen changes in Energy Consumption or the CO2e in the past seven (7) days.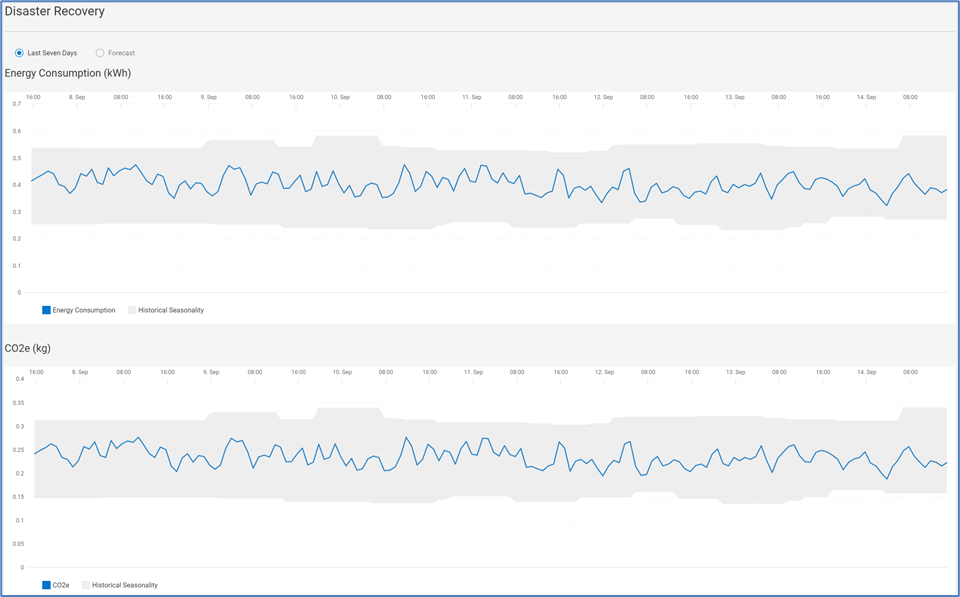
What we’ve shown here is just the beginning. We will continue improving and enhancing CloudIQ capabilities to ensure you enjoy the most relevant and accurate KPIs and can act upon them expeditiously.
Where do we go from here?
Dell has several other tools and assessments that you can benefit from. For example, we can run a tool called Live Optics that collects configuration and performance data from your Dell and third-party products and produces a report that can be analyzed to propose options like optimization, consolidation, or a refresh with a new technology. The other option is to request a #GetEfficient report, which will be directly focused on reduction in physical footprint and power consumption.
Resources
- Dell CloudIQ: A Detailed Review
- How Dell is infusing sustainability across its businesses
- Dell FY23 Environmental, Social and Governance - Executive Summary
Author: Michael Aharon & Derek Barboza

Talking CloudIQ: PowerEdge
Wed, 08 Nov 2023 16:32:28 -0000
|Read Time: 0 minutes
Introduction
In my previous blogs, I have focused on a specific feature in CloudIQ. This blog talks about various CloudIQ features for Dell’s PowerEdge servers. Dell CloudIQ continues to expand its feature set for PowerEdge assets. CloudIQ integrates with Dell’s OpenManage Enterprise at each of your sites, to efficiently collect and aggregate telemetry data to give you a multisite, enterprise-wide view of all your PowerEdge servers and chassis. And with OpenManage Enterprise 4.0, onboarding your PowerEdge servers to CloudIQ is easier than ever!
Health, inventory, and performance
Since the introduction of PowerEdge support in CloudIQ, health, inventory, and performance monitoring for PowerEdge servers have all been available. CloudIQ provides an overall health score for each PowerEdge server and recommended remediation when an issue is identified. Inventory reporting provides numerous properties about each server, including contract status, component firmware versions, licensing information, and hardware listings to name a few. CloudIQ displays key performance metrics and not only shows historical trends but identifies performance anomalies and provides performance forecasting. This information allows you to see unexpected performance patterns, and plan future resource needs based on trending workloads.
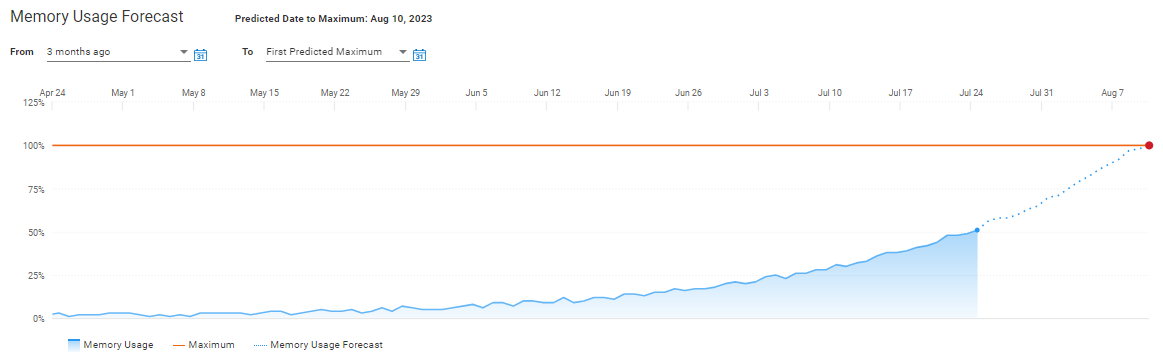
Figure 1. Example of a performance forecasting chart for PowerEdge
Cybersecurity
Cybersecurity is a feature in CloudIQ that allows you to compare your existing security configuration settings to a predefined set of desired security configuration settings. The configuration is continuously monitored, notifying you when a configuration does not meet its desired setting. Cybersecurity monitors up to 31 server configuration settings and 18 chassis configuration settings tied to NIST security standards. Without automated continuous checking, it's impractical to manually check all settings on all servers every day. Lab tests show that it takes six minutes on average to manually check just 15 settings on a single server.
Users can also see a list of applicable Dell Security Advisories (DSAs) for their PowerEdge systems. By intelligently matching attributes like models and code versions, users can quickly see which DSAs are applicable to their systems, allowing them to take immediate action to remediate these security vulnerabilities.
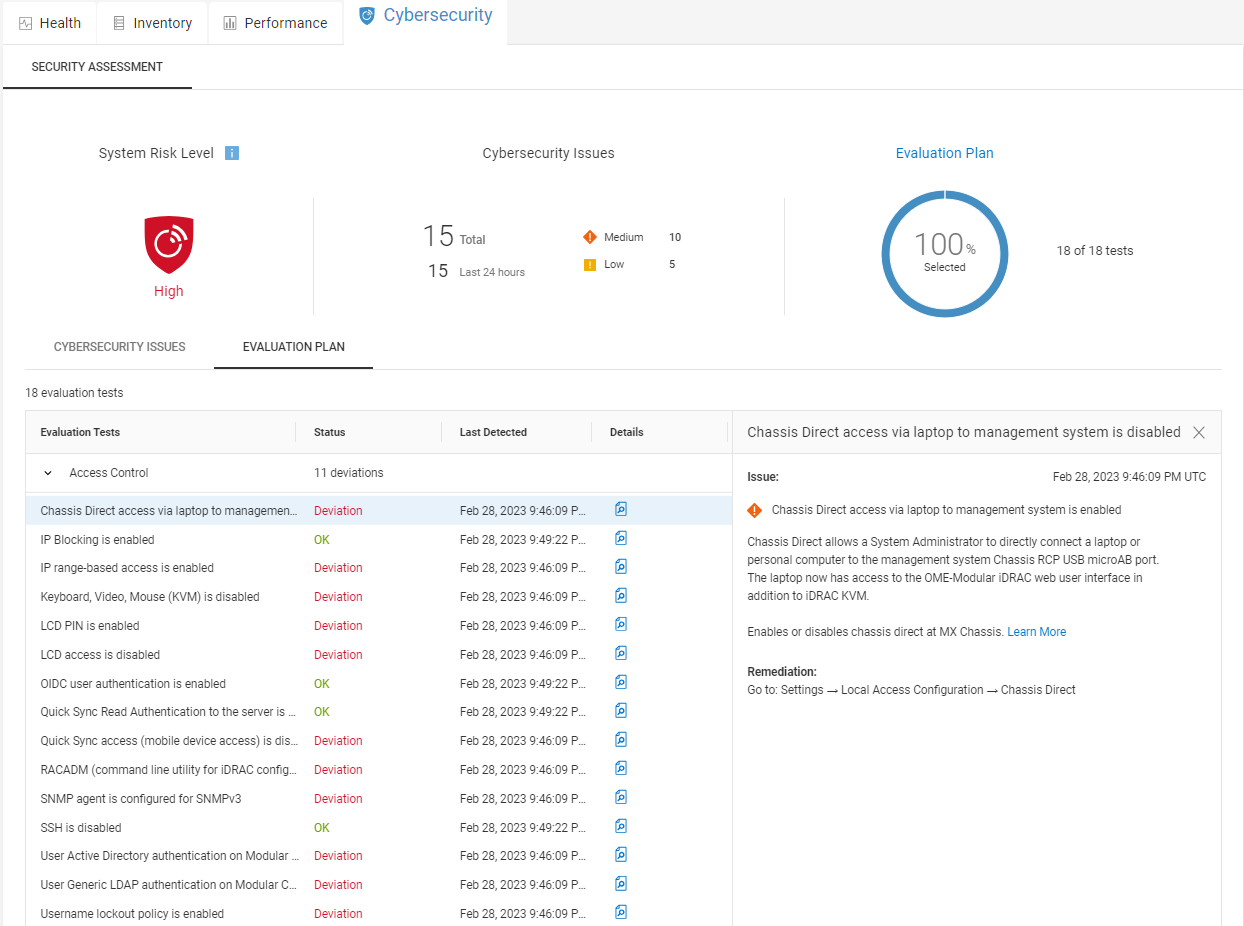
Figure 2. The Security Assessment page for a PowerEdge chassis
System Management
You can now initiate BIOS and firmware updates for PowerEdge servers and chassis from CloudIQ. Users with a Server Admin role in CloudIQ can initiate these upgrades across multiple systems with just a few clicks. This feature simplifies the process of keeping your fleet of servers consistent and secure.
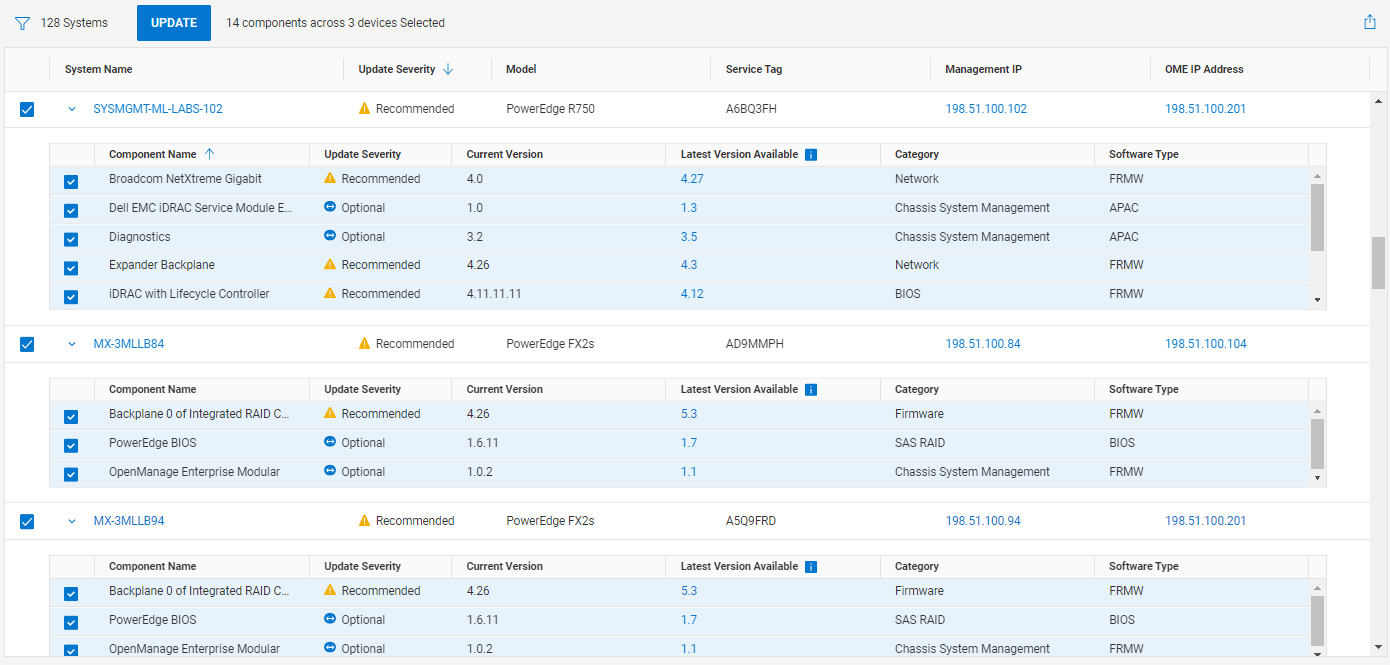
Figure 3. Multisystem update for PowerEdge servers and chassis
Virtualization View
The integration of PowerEdge into the Virtualization View consolidates and simplifies resource information about PowerEdge servers running ESXi. Available details include the OS version, model, resource consumption per virtual machine, and health issues with recommendations for remediation. A hyperlink lets you quickly navigate to the system details page for the PowerEdge server for more troubleshooting. Another hyperlink directs you to vCenter to perform virtualized resource administration.
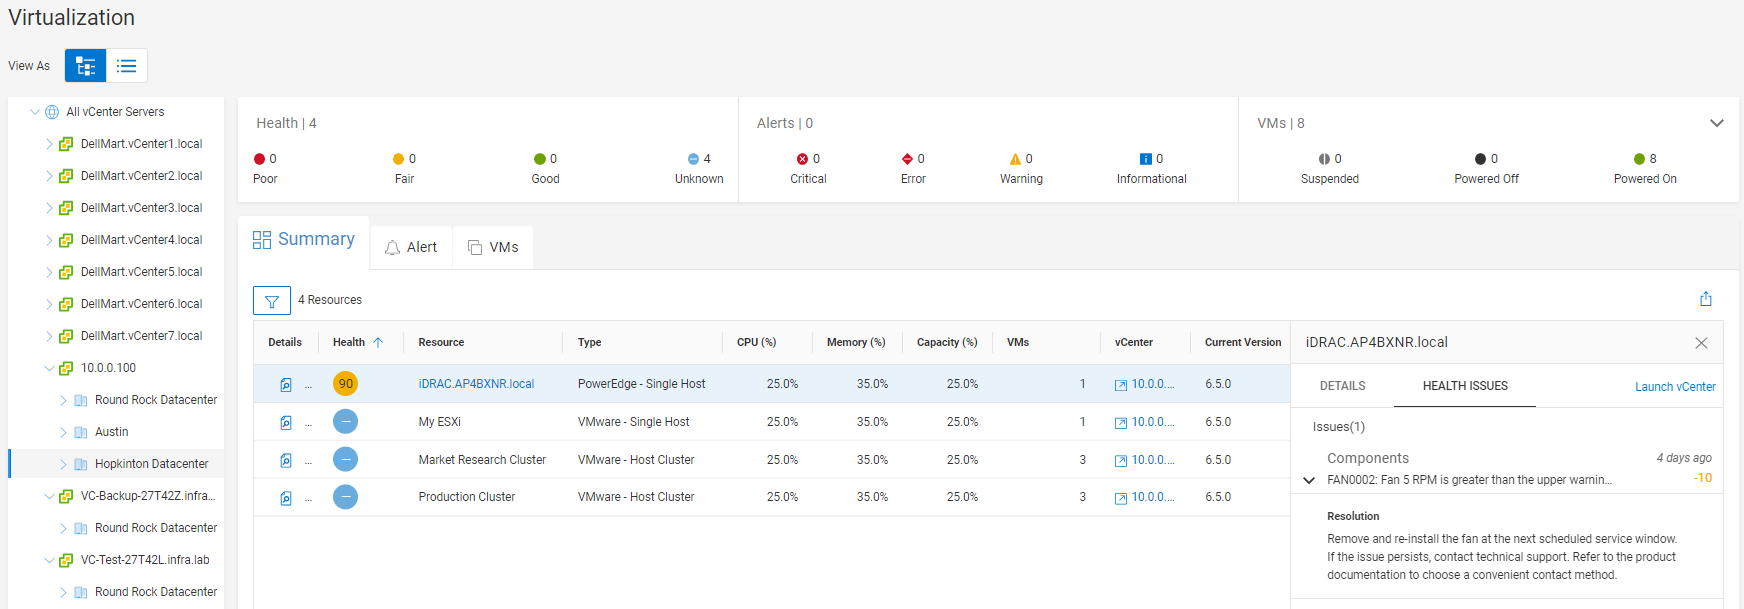
Figure 4. PowerEdge support in the Virtualization View
Carbon footprint monitoring
CloudIQ has introduced carbon footprint analysis support for PowerEdge servers and chassis. CloudIQ takes power and energy metrics and calculates carbon emissions based on international standards and conversion factors for location. CloudIQ Administrators can override and customize these values with their own unique location emission factors.
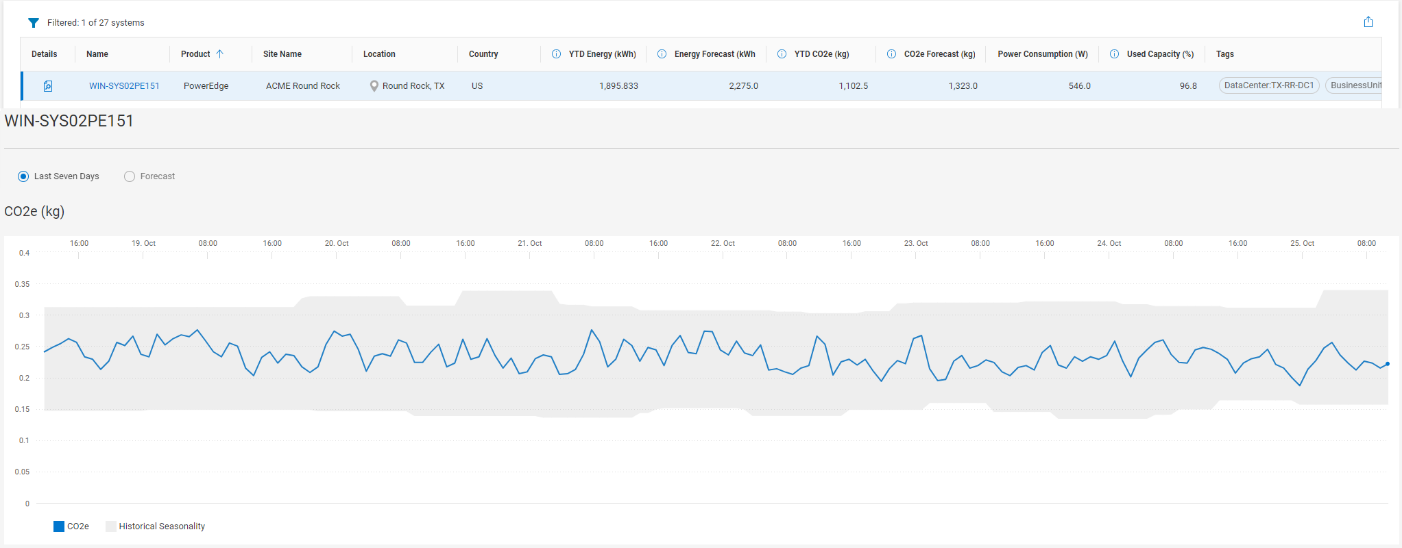
Figure 5. Energy, power, and carbon emissions for a PowerEdge server
Custom reports and IT integrations
You can generate custom reports using both tables and charts for PowerEdge servers:
- Tables are available to provide lists of assets, code versions, contract information, capacity metrics, and average performance metrics.
- Charts can be used to see historical performance trends and performance anomalies.
You can also take advantage of custom tags in your reports. For example, you can create a list of PowerEdge servers in a certain business unit with their BIOS and firmware versions, contract expiration dates, average power consumption, and service tags. And with Webhooks and REST API access, you can integrate data and events from CloudIQ with ServiceNow, Slack, and other IT tools to help you monitor your entire Dell IT infrastructure.
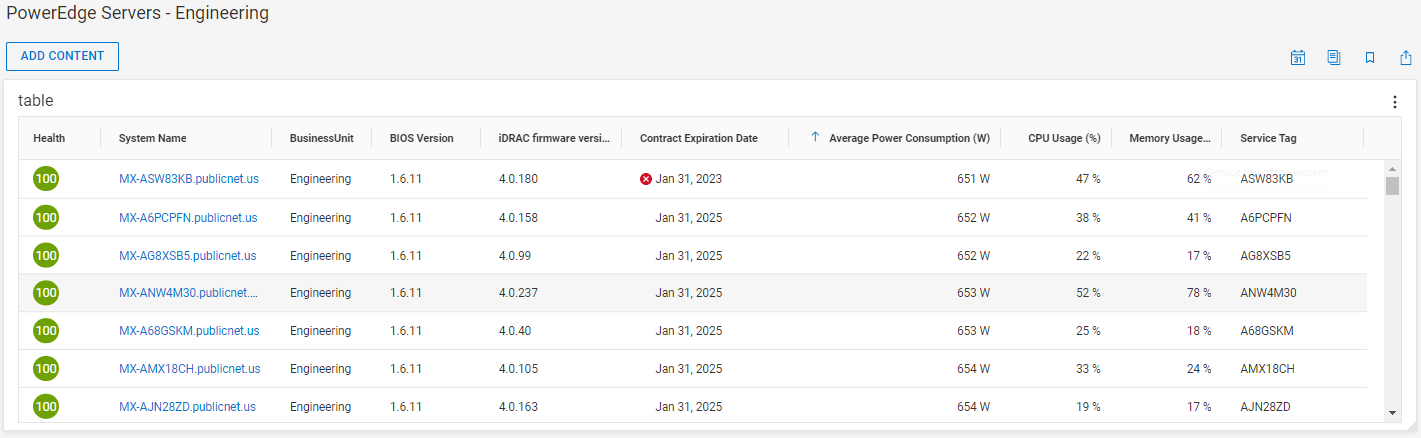
Figure 6. Custom reporting table for PowerEdge with custom tags
Conclusion
As IT resources become more remote and isolated, it has become increasingly time consuming to maintain, manage, and secure resources in the data center and at the edge. CloudIQ simplifies monitoring and management by providing a single portal to view all your PowerEdge servers across your entire environment. With cybersecurity monitoring of PowerEdge servers and chassis, you can quickly see where security configuration settings may be incorrectly set or accidentally changed, opening those systems to cyberattacks, and receive instructions to remediate. With the new maintenance and management features, CloudIQ simplifies the process of keeping your entire fleet at consistent, secure, and desired BIOS and firmware versions. The carbon footprint page in CloudIQ helps you meet sustainability goals. And with Webhook and REST API support, CloudIQ can be integrated with other IT tools to help you monitor not only your PowerEdge servers, but your entire Dell IT portfolio.
Resources
This Knowledge Base Article discusses how to onboard PowerEdge devices to CloudIQ.
For a quick demo about CloudIQ PowerEdge support, see the CloudIQ videos section on the Info Hub.
Direct from Development Tech Note: Dell CloudIQ Cybersecurity for PowerEdge: The Benefits of Automation
See other informative blogs: Overview of CloudIQ, Proactive Health Scores, Capacity Monitoring and Planning, Cybersecurity, and Custom Reports and Tags.
How do you become more familiar with Dell Technologies and CloudIQ? The Dell Technologies Info Hub site provides expertise that helps to ensure customer success with Dell Technologies platforms. We have CloudIQ demos, white papers, and videos available at the Dell Technologies CloudIQ page. Also, feel free to reference the white paper CloudIQ: A Detailed Overview which provides an in-depth summary of CloudIQ.
Author: Derek Barboza, Senior Principal Engineering Technologist