
Dell Validated Design for Manufacturing Edge with PTC - Design Guide
Leveraging analytics for smart manufacturing operations
Leveraging analytics for smart manufacturing operations
-
Analytics and tools to incorporate
Several tools can be utilized at various hierarchical levels to track and analyze system needs and performance.
At the cluster level, performance parameters are leveraged to track compute, latency, and more, down to the physical disk.
The vSphere client portal is part of the VMware suite. It provides out-of-the-box charts to view real-time and historical VM performance of:
- CPU
- Memory
- Memory rate
- Disk and network traffic
There are several ways to collect analytics for overall equipment efficiency, predictive maintenance, and identifying faults. ThingWorx provides graphical Mashups and DPM-based dashboards to define the desired analytics for factory performance evaluation.
Using a rich set of REST API, Python, and Java Scripting capability, and database-level analytics tools like PowerBI, Tableau, and others, more complex analytics can be developed.
The following sections cover the Mashups capability of ThingWorx and show the DPM dashboard. Other options listed here are out of scope for this guide, but mentioned here for general guidance.
Considerations for Mashups
In ThingWorx, a Mashup is a web page to visualize data and to interact with a Thing model through a graphical interface. Mashup Builder is the tool to create visualization web pages in ThingWorx. It is a 100% configuration, zero-code content development environment.
Visualization of IoT data can be created quickly and easily with Mashup Builder. The tool allows users to combine the data services available within ThingWorx with a set of widgets to create unique web pages.
The Mashup Builder workspace consists of the following default sections when in design time:
- Left dock—contains two sections with panels for Widgets, Layout, Mashups, Explorer, Properties, and Style Properties.
- Right dock—contains two sections with panels for Data, Session, User, Data Properties, and Functions.
- Canvas and toolbar—the workspace area where design of the mashup takes place.
- Bottom dock—contains two panels for Bindings and Reminders.
Figure 28. Mashup Builder workspace 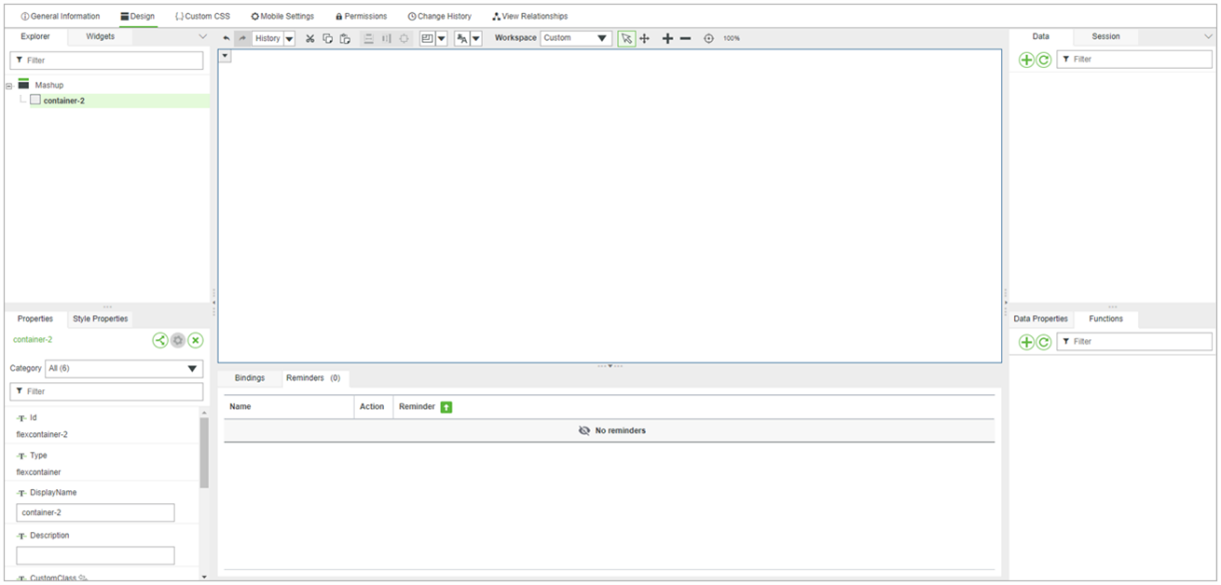
To view the Mashup, click View Mashup. When you view a Mashup, a new tab opens, and the Mashup is rendered in a runtime environment. During runtime, you can execute services, trigger events, and interact with your Thing models.
You can also view Mashups directly using the REST API service. To view a Mashup directly, use the following syntax:
<protocol>://<server>:<port>/Thingworx/Mashups/<MashupName>-
<protocol>—protocol used to connect to the server (HTTP or HTTPS) -
<server>—name or IP address of your ThingWorx server -
<port>—port number -
<MashupName>—name of the Mashup entity in ThingWorx
The following figure illustrates how the Factory1 data is visualized using Mashup Builder. The upper pane shows the current values from variables such as sensor live values, and the lower pane shows the historical values stored in SQL Server, PostgreSQL, or InfluxDB databases in a separate server.
Various alerts can be created for events, including if the value of a property changes beyond certain limits.
Figure 29. Factory1 data visualization using Mashup Builder 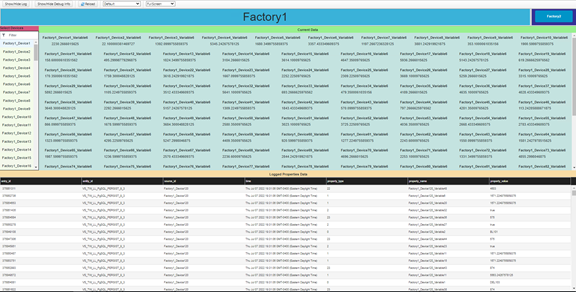
Mashup templates can be created as custom Mashup templates. Other users can then choose these custom templates as starting points to design their own Mashup.
The following figure shows where to find the Mashup templates section in the Browse menu.
Figure 30. Mashup Templates search view 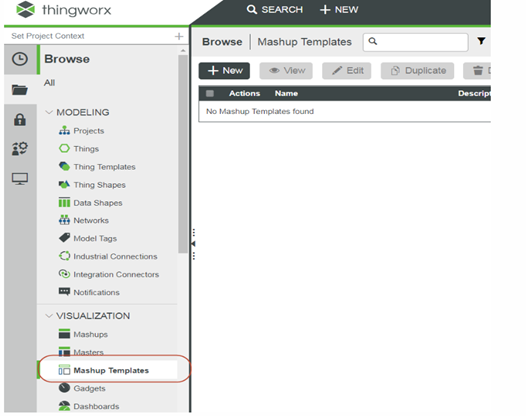
Bulk editing of the Mashup can be done by exporting it to .xml format, as shown in the following figure. For example, if a user wants to replicate ‘baseMashupFactory1’ for Factory2, Mashups can be edited in .xml to replace bindings. Edited Mashups can then be imported back.
Figure 31. Exporting a Mashup to .xml format 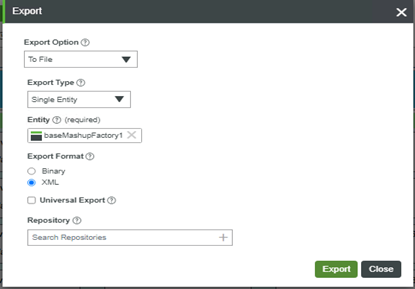
Monitoring in DPM
Digital Performance Management (DPM) is an add-on for the PTC ThingWorx platform. Using the separate Microsoft SQL Server database, it can collect factory production operation data to provide information about job status, material movement, production quantities, and other insights into overall equipment and production effectiveness.
The following figure shows the DPM dashboard that uses PTC Kepware base-connected data ingested into PTC ThingWorx and a separate DPM SQL Server database for real-time production monitoring.
Figure 32. Monitoring in DPM 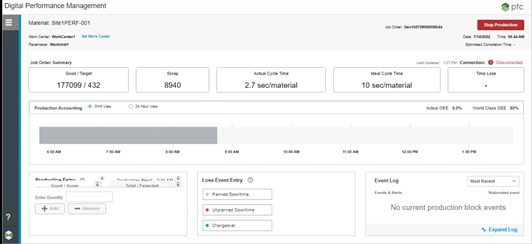 Note: See PTC documentation for steps to install and deploy DPM, and to configure connected scenarios using Kepware and ThingWorx servers.
Monitoring ThingWorx applications
Key metrics exist to help monitor ThingWorx applications. Select tools can be deployed to collect and analyze the following performance indicators:
- ThingWorx memory usage—Memory issues in a Java Virtual Machine (JVM) or at the operating system (OS) level are among the primary reasons for application performance issues. They also cause applications to crash.
- ThingWorx Mashup and execution time of services—Slow execution of services or a Mashup impact the user experience of ThingWorx applications.
- Database, operating system, and network performance—ThingWorx depends on database, operating system, and network responsiveness for optimal performance.
- Log monitoring—The two mechanisms that enable a view into your application and what is happening behind the scenes are ThingWorx Composer Monitoring and the ThingWorx file system.
- ThingWorx Composer Monitoring: ThingWorx provides pages to see all logs and communications between your ThingWorx instance, applications, and edge devices using the Monitoring drop-down in the top navigation toolbar of your Composer. To see this page, click Monitoring on the left menu, then select the option you would like to see, as shown in the following figure.
Figure 33. ThingWorx Composer Monitoring drop-down 
- ThingWorx File System: Log files for ThingWorx and your application can be found in the [Root]\ThingworxStorage\logs directory. The ROOT DIRECTORY is the folder in which ThingWorx has been running (for example, C:\ThingworxStorage\logs for Windows, or /ThingworxStorage/logs for Mac or Linux).
Each log file corresponds to some of the same content that you can see in the Monitoring drop-down in ThingWorx Composer.
- ThingWorx Composer Monitoring: ThingWorx provides pages to see all logs and communications between your ThingWorx instance, applications, and edge devices using the Monitoring drop-down in the top navigation toolbar of your Composer. To see this page, click Monitoring on the left menu, then select the option you would like to see, as shown in the following figure.
ESXi system performance metrics
Windows PowerShell with VMware PowerCLI integration can be used to collect performance metrics including the SCSI controller, CPU and memory consumption of individual VMs, disk latencies, and throughput information.
Note: See Windows PowerShell and VMware PowerCLI documentation for details.
OS performance metrics on Windows
At the OS level, many tools are available to track performance metrics. These tools and metrics vary based on OS.
In a Windows systems, the built-in Performance Monitor application provides an easy-to-use graphical user interface (GUI) to configure jobs that can collect specified data on demand. These metrics track compute performance, memory use, and storage use, broken down by disk. These jobs can also be exported as a template to quickly configure multiple machines.
OS performance metrics on Linux
Linux systems offer comparable statistics with select packages. The sysstat package offers system performance tools that are comparable to those in Performance Monitor on Windows, including CPU utilization and disk I/O statistics. This package can be installed on both Debian and CentOS Linux systems, though the installation varies between them.
After installing the sysstat package, execute the
iostatcommand to output a set of real-time system statistics including CPU use, memory use, and disk use.Several options can customize the statistics displayed. Details on command options and the collected metrics are available on the iostat man page. Execute the iostat -xtk 1 1800 command to:
- Display a timestamp (-t option)
- Display extended statistics (-x option)
- Show metrics in kilobytes (-k option) at a 1 second interval (1) for 30 minutes (1 rep / 1 s * 60 s / 1 min * 30 min = 1800 intervals)
These metrics can be easily output to a file for simple tracking.