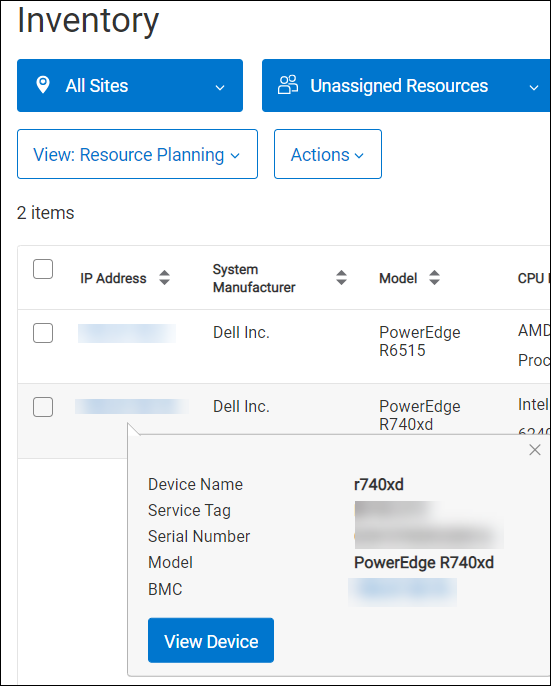
The View Device page provides more detailed information for compute nodes.
At the top of the page, you can see the following:
- Health status
- Power status
- Device provisioning status
- Hardware profile (profile that is applied)
- Service tag
The Actions drop-down list allows you to perform the following:
- Power On
- Power Off
- Delete
- Remove Hardware Profile
- Reinitialize Server
- Apply Hardware Profile
- Edit Device
- Edit Tags
Use the View drop-down list to switch the following page views:
- Overview
- Resource Planning
- Software
- Configuration
The View Device page organizes device information into cards (tables or lists). Card names are listed in the card navigation pane on the left side of the page.
View Device page for servers—Overview
Overview displays device data that is organized into the following cards:
Table 27. Overview cards | Identification | Displays various IDs, labels, and numbers that identify the device. |
| Licensing | Displays the BMC license and timestamp when the device was discovered. |
| Resource Planning | Displays details on device hardware such as cores, threads, and storage. |
| Monitoring | Reports live system statistics and usage information (such as CPU temperature and memory usage) for monitoring server health. All statistics share the same polling interval. Note: The statistics of the ACC100 card sensors also displays in addition to the system statistics. Ensure that you select the Enable Metrics check box for the server to view the sensor statistics. For more information, see Edit compute node name and location.
|
| Location | Displays information that specifies device location. |
| OS and Drivers | Displays information about installed drivers, including the driver type and version. |
| Compliance | Displays information about drift detection on a device that has been pre-scanned. See Drift detection for more information. |
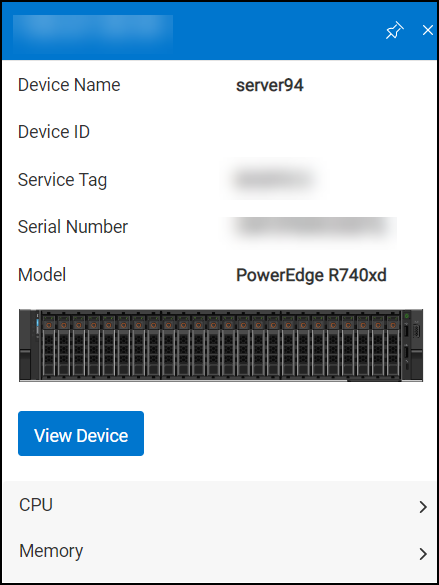
An image of the device appears at the bottom of the page.
View Device page for servers—Resource Planning
Resource Planning displays device hardware data that is organized into the following cards:
Table 28. Resource Planning cards | CPU | Displays processor information. |
| Accelerators | Displays accelerator card information. This field only displays when an accelerator card is discovered. |
| Memory | Displays available memory and memory module details such as memory type, serial number, and module location. |
| Storage | Displays information about storage devices such as device name, manufacturer, slot number, and FQDDs. |
| NIC | Displays information about network interface cards, such as number of ports, NIC ID, NIC MAC address, and FQDDs. |
| PSU | Displays information about power supply units such as power specs, model, and type. |
| PCI Inventory | Displays information for PCI devices (including Ethernet and HBA adapters) such as manufacturer, slot locations, and part numbers. |
Click the card name in the card navigation pane or scroll the page to the required card.
View Device page for servers—Software
The Software view displays device software data that is organized into the following Firmware card:
Table 29. Software card | Firmware | Displays a list of firmware modules along with their current version and previous version (when available). |
View Device page for servers—Configuration
The Configuration view displays device configuration data that is organized into the following cards:
Table 30. Configuration cards | BIOS | Displays various BIOS information such as settings for boot, system profile, memory, and processor. Click View All BIOS Settings to view the full set of BIOS settings for a compute node. |
| RAID | Displays information about RAID volumes such as names, media types, number of drives, FQDDs, and memory capacity. |
| BMC | Displays BMC information such as settings for DNS, NTP, and network connectivity. Click View All BMC Settings to view the full set of BMC settings for a compute node. |
| BMC Users | Displays information such as User Name and assigned role for each BMC user. For information about creating, updating, or deleting BMC users, go to BMC Users under BMC Settings (see BMC settings). |
| NIC Bonding | Displays NIC Bonding information such as the NIC Bonding name, NIC cards used in the bonding, the bonding mode and the Media Independent Interface (MII) monitoring interval. |
Click the card name in the card navigation pane or scroll the page to the required card.