
Litmus Edge
Litmus Edge
-
This section provides an overview to offer a basic understanding of the Litmus platform.
Litmus Edge can be deployed on a VM (running on APEX Private Cloud) or on bare-metal hardware, such as a gateway or an embedded personal computer (PC). Running the Litmus Edge device as a VM offers maximum flexibility about scale, availability, and consolidation, yet in many scenarios, a physical device may be required. Such scenarios include:
- The need to interface using an industrial connectivity solution such as CAN or Serial
- The need for specific compute resources close to the asset for localized interface or data aggregation, or advanced use cases. (For example, it makes sense to have a logical point of aggregation on a single production line)
Litmus Edge is easily deployed and managed using Litmus Edge Manager.
Connecting industrial assets
Once a Litmus Edge device is deployed, the next step is to connect industrial assets. With more than 250 prebuilt drivers, Litmus Edge connects to almost any asset out-of-the-box, and can process and structure data into a common format for edge and enterprise applications.
The starting point in Litmus Edge to connect an industrial asset is the DeviceHub dashboard, where assets can be added and easily managed. For example, if an asset is under maintenance, a single click in DeviceHub disables its connection.
A new asset is set up using the DeviceHub wizard which helps in choosing a driver and defining the connection parameters. In an example of a PLC controller device, the following parameters are required:
- Device type (Siemens, Rockwell)
- Driver name (aligned to controller type)
- Name (a logical name for the connection)
Next, depending on the type of driver and device, additional parameters are required, such as IP address, slot number, and network port.
The following DeviceHub dashboard shows six defined connections on a Litmus Edge device: three connected and three disconnected.
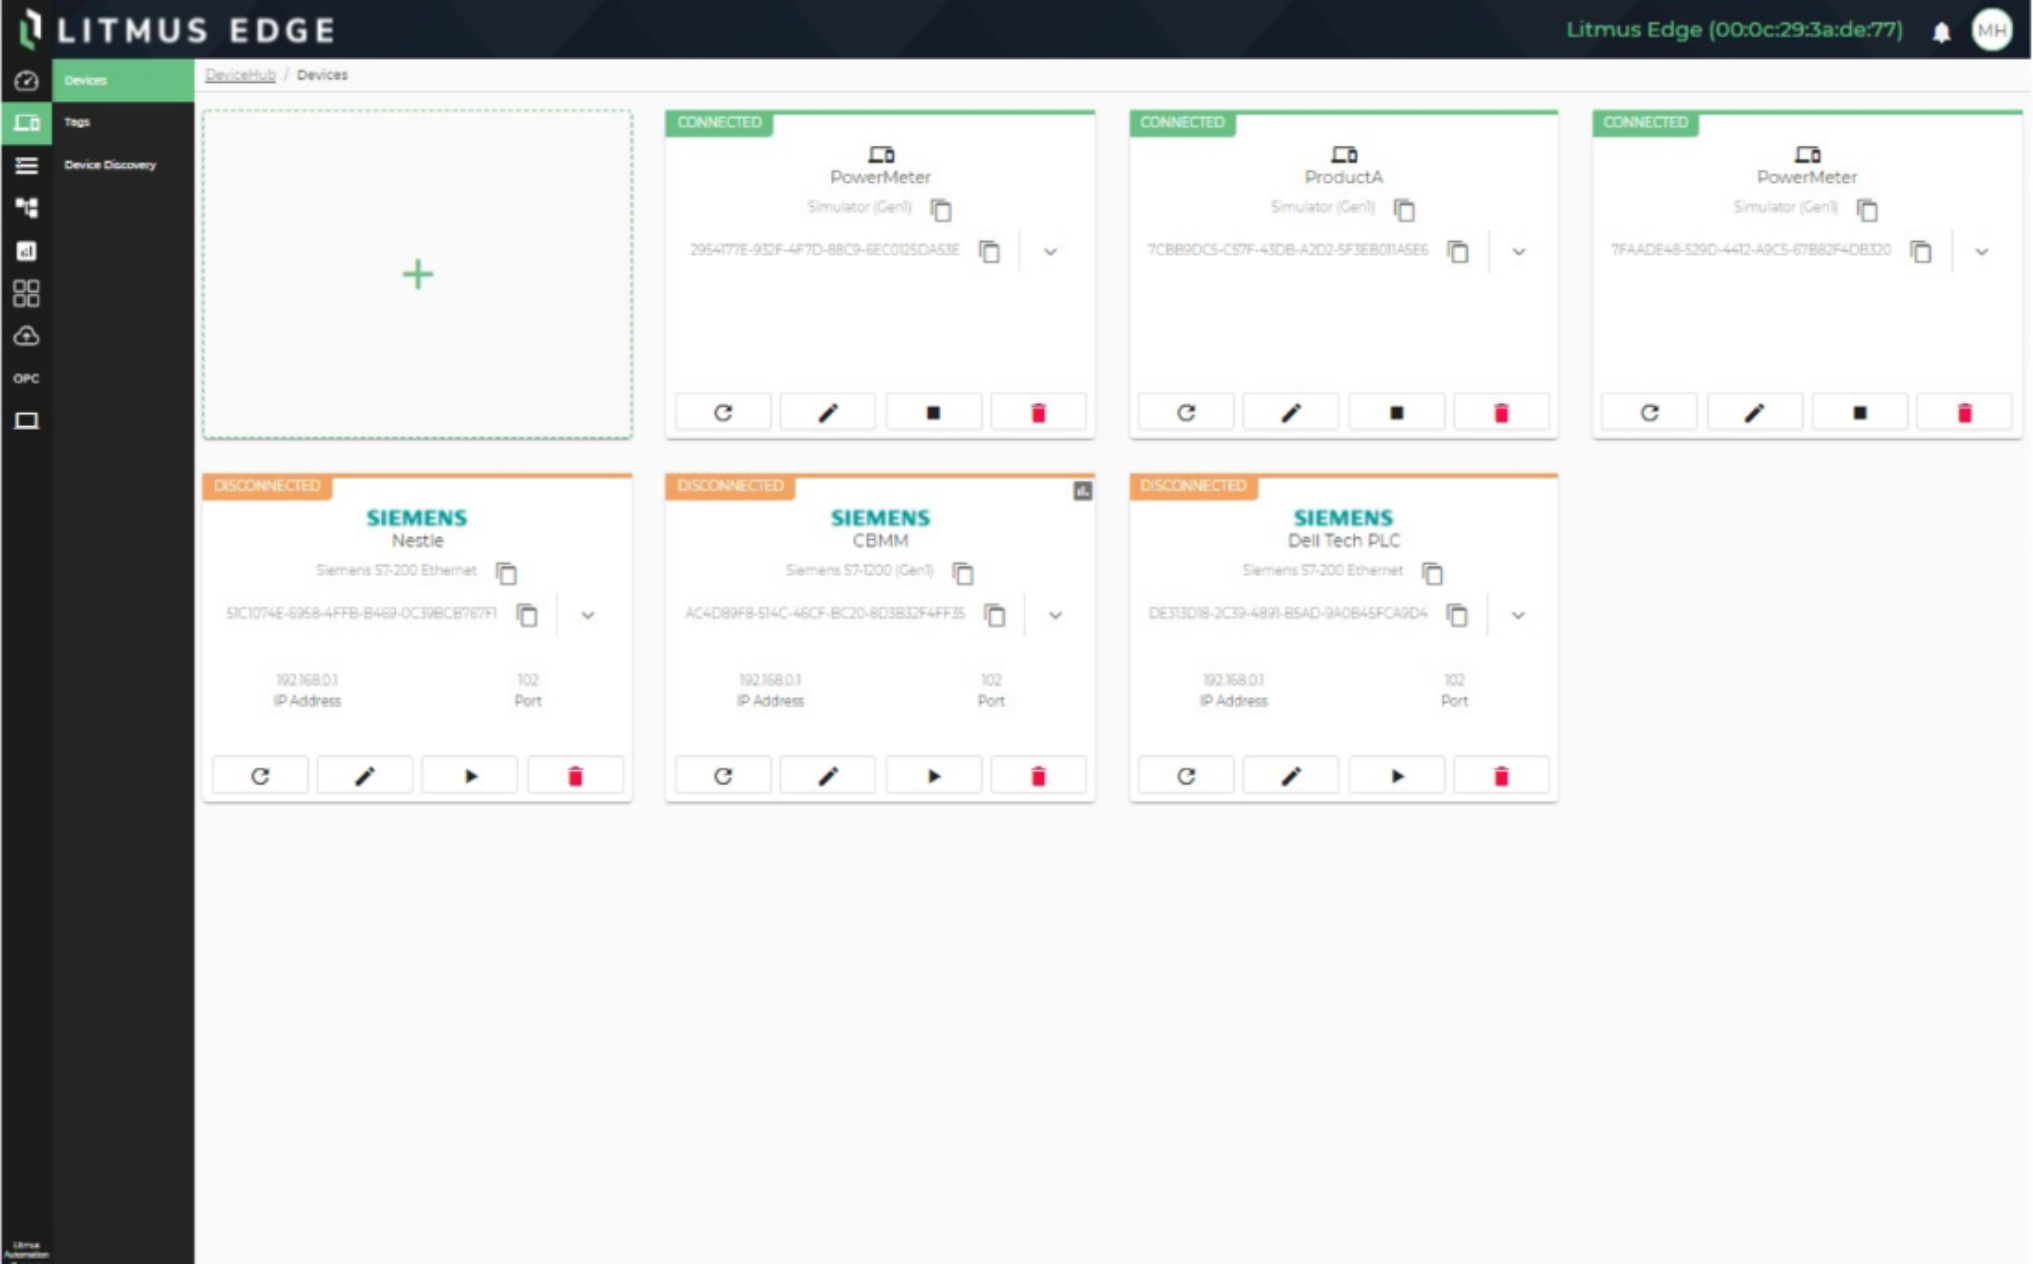
Figure 15. Litmus Edge DeviceHub dashboard overview with six defined connections
Within the DeviceHub, the tags that are ingested from a connected asset are reviewed in the left column. A tag is a data point for a specific metric on an asset, such as temperature or a specific performance threshold. Define tags by browsing the device or import them from a CSV file.
Below Tags in the left-hand column, Device Discovery allows an OT network to be scanned, which is especially useful to detect devices. For example, if there is a defined PLC network, Litmus Edge can detect and connect all the PLCs that are currently running on that network.
Lastly, if a connection appears as Failed, it means the connection is enabled but there is some connectivity issue with the asset.
Flows and Analytics
Within Litmus Edge, all communications from connected assets, devices, and tags are passed through the message broker. This Litmus Edge element normalizes OT data into standard JavaScript Object Notation (JSON). The message broker essentially links all OT systems and IT systems and is the key function enabling Flows and Analytics. The following is a breakdown of its individual functions.
Flows Manager
The Flows Manager is a graphical logic builder that builds logic into message broker data using a low code or no code environment. It allows values from industrial assets to be read, processed, and outputted, depending on the processing required, as the following figure illustrates.
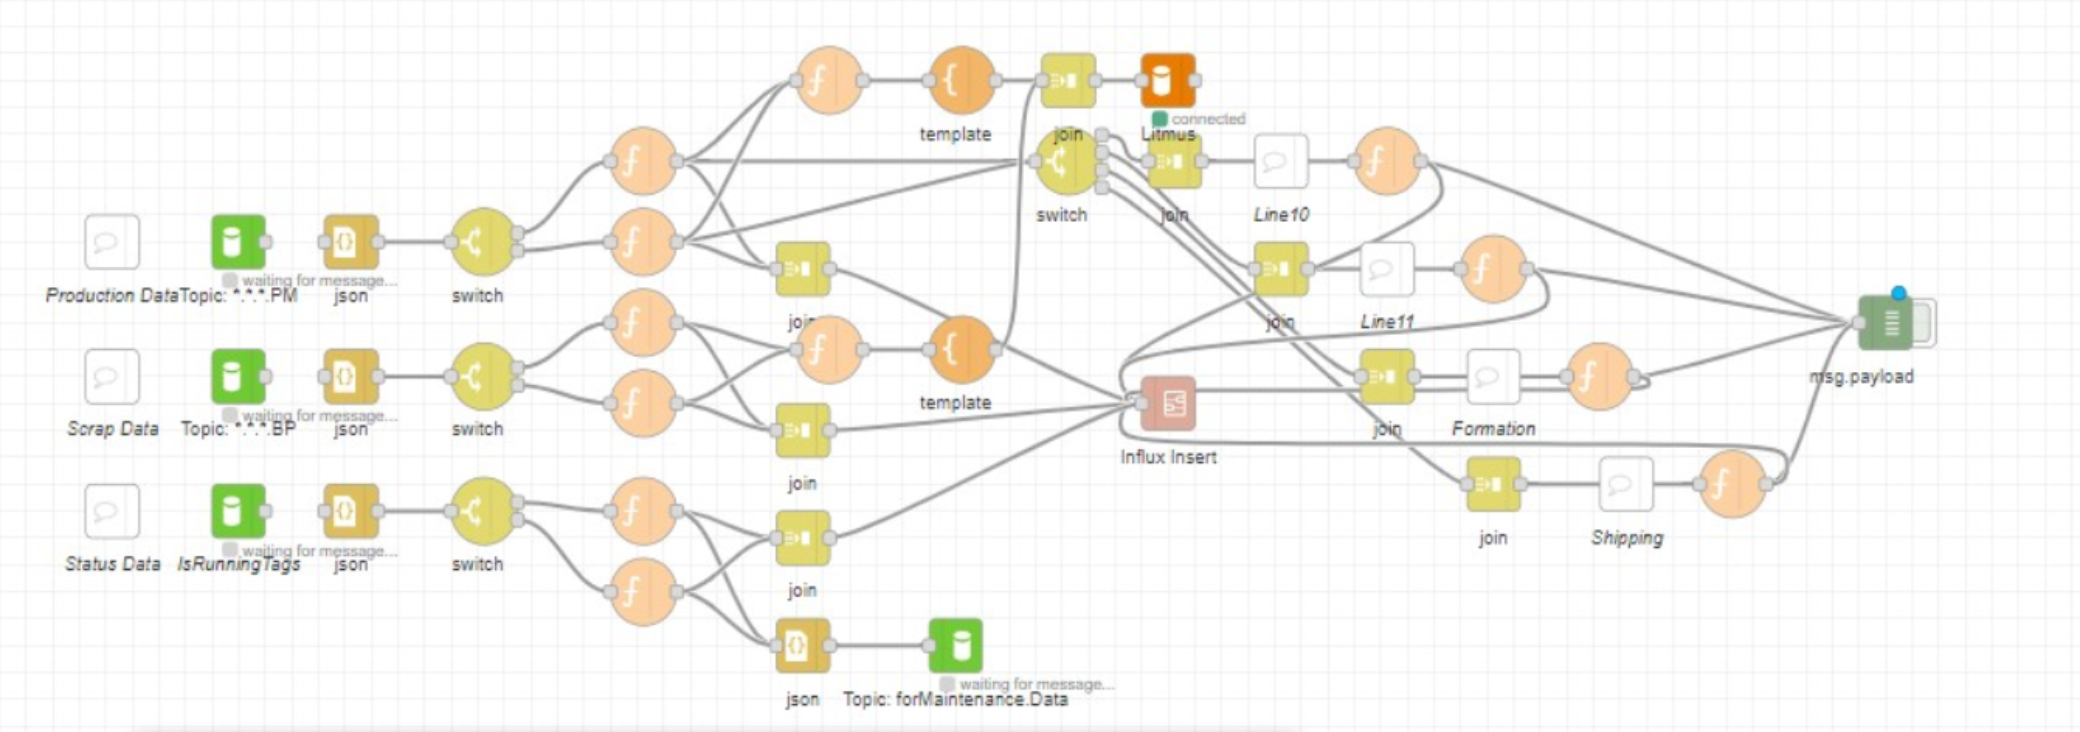
Figure 16. An example flow in Litmus Edge
Analytics capabilities
The Analytics function is a collection of advanced compute functions enabling users to derive KPIs and date and run ML models. This is key to delivering data efficiency and analytics-based use cases at the edge.
Its input nodes can ingest data from the message broker, user input, or external databases. Historical data can also be ingested from InfluxDB running on Litmus Edge. Output is sent to SDP or northbound IT systems by way of the Litmus Edge connectors.
Analytics allows organizations to build specific outcomes including anomaly detection, statistical prediction, and TensorFlow ML models, some of which are built into the DVD for Manufacturing Edge with Litmus solution.
The following is an example of Analytics designed to publish OEE metrics to a visualization platform:
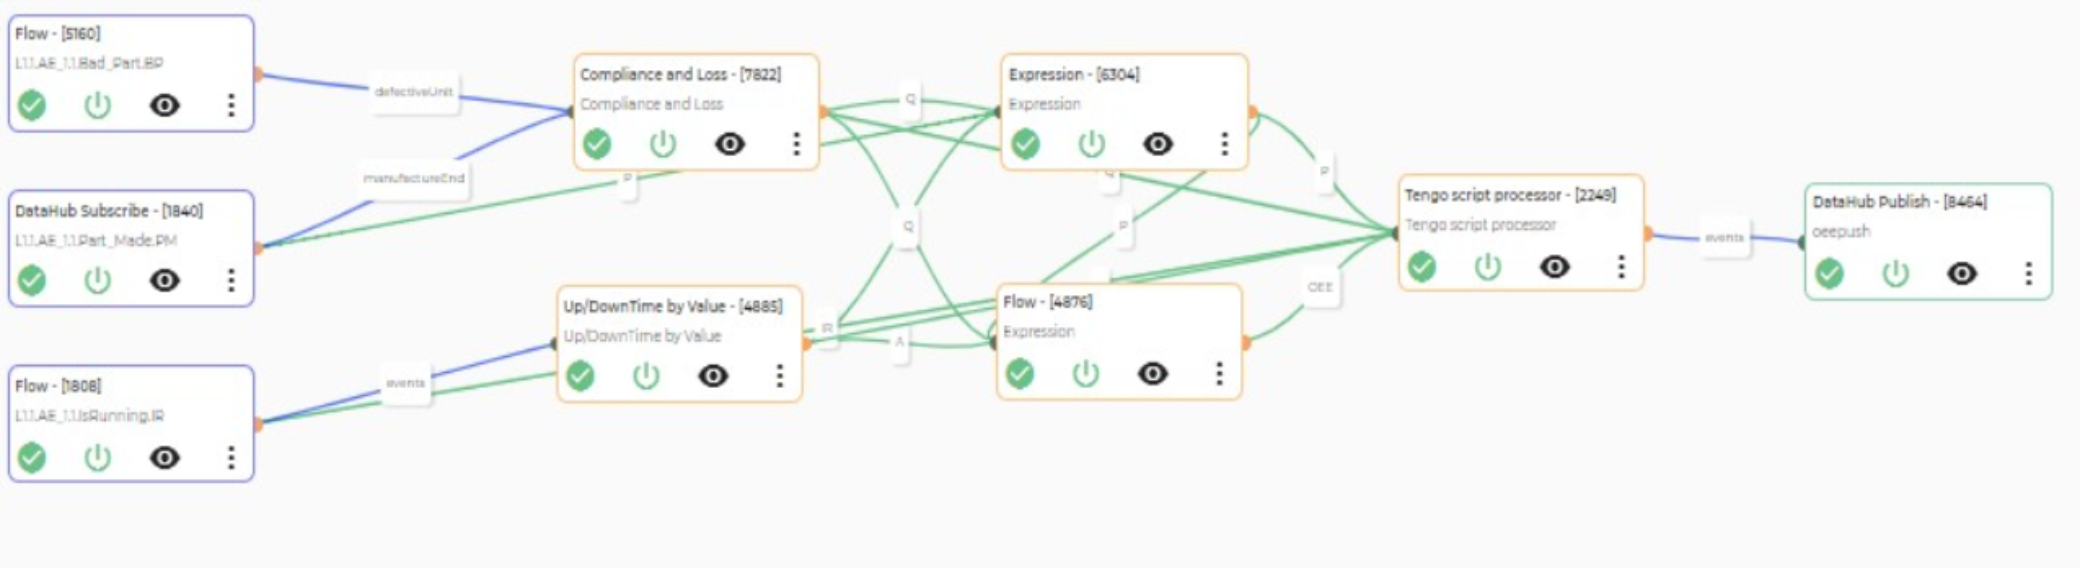
Figure 17. Analytics function on Litmus Edge
Applications capabilities
Litmus Edge runs applications locally as containers on the edge device, locally managed on Litmus Edge or from Litmus Edge Manager. A common use case includes visualization applications (such as Grafana), where operators view KPIs within the build cell where an edge device is located.
Analytical capabilities can also be containerized, deployed, and managed on Litmus Edge. Some key features include:
- Configuration - where the connections to Litmus Edge Manager Application Marketplace are defined
- Marketplace - where published applications in the Application Marketplace are pulled locally to the edge device
- Registry - for more information, see Litmus Edge - Registry (requires login).
- Containers - where locally running containers are managed.
- Images - where the local Docker containers on the edge device are managed
- Volumes - where local and external mount points are defined for data storage
- System Info - where the Docker configuration for the edge device is inspected
- Disk Usage - for reviewing the space used by applications and their containers
This following is an example of the Marketplace dashboard running locally on an edge device:
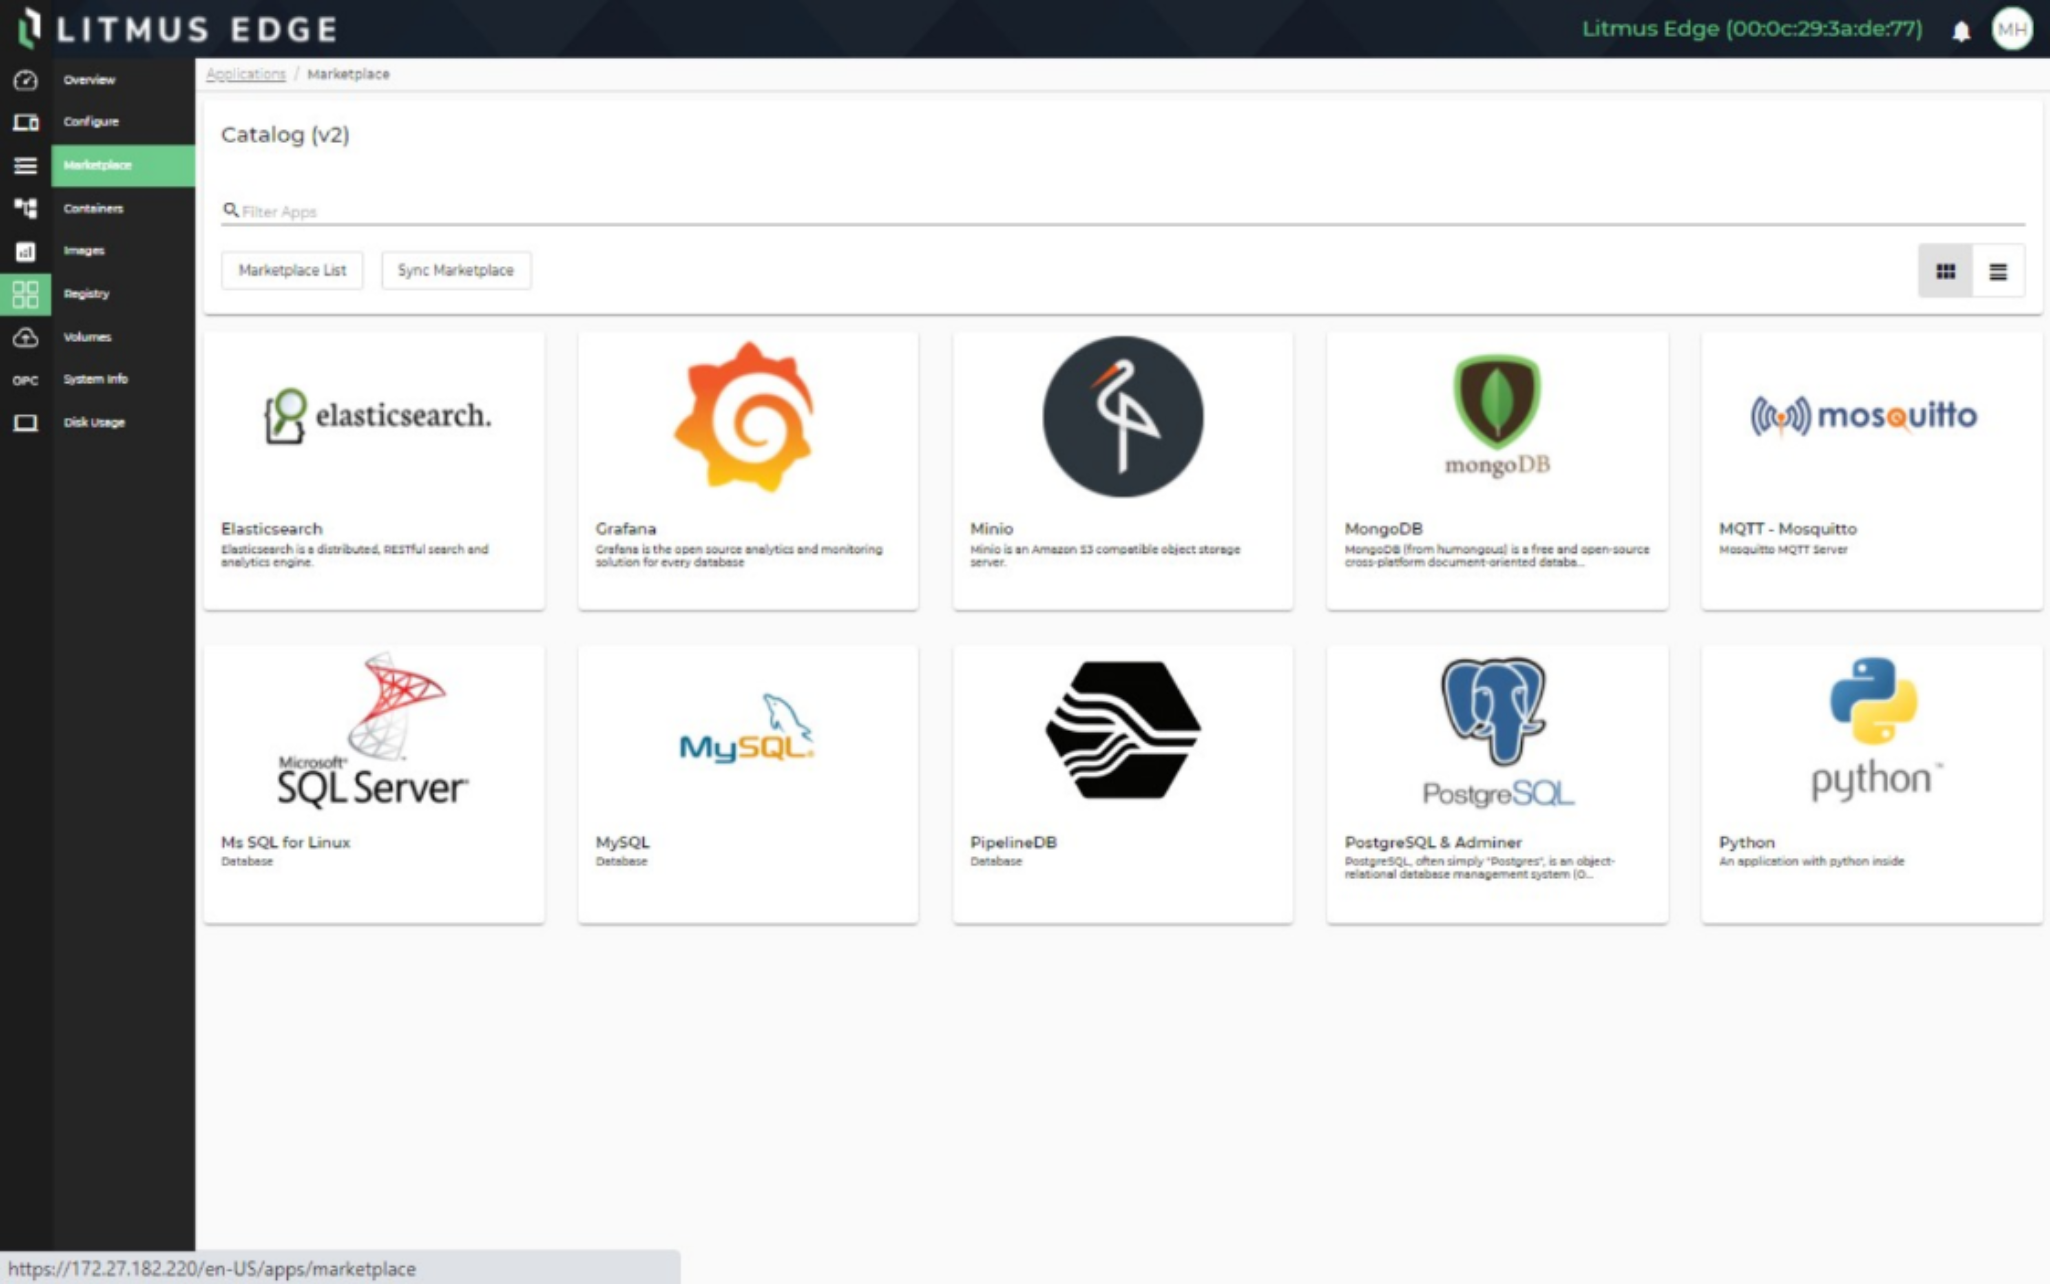
Figure 18. Application Marketplace on Litmus Edge
Integration capabilities
The Litmus Edge Integration capability enables enterprise IT systems and application connectivity. It connects Litmus Edge to public cloud instances or applications running in on-premises data centers through connections that are easily managed from the Integration dashboard. The following figure provides a comprehensive look at the dashboard.
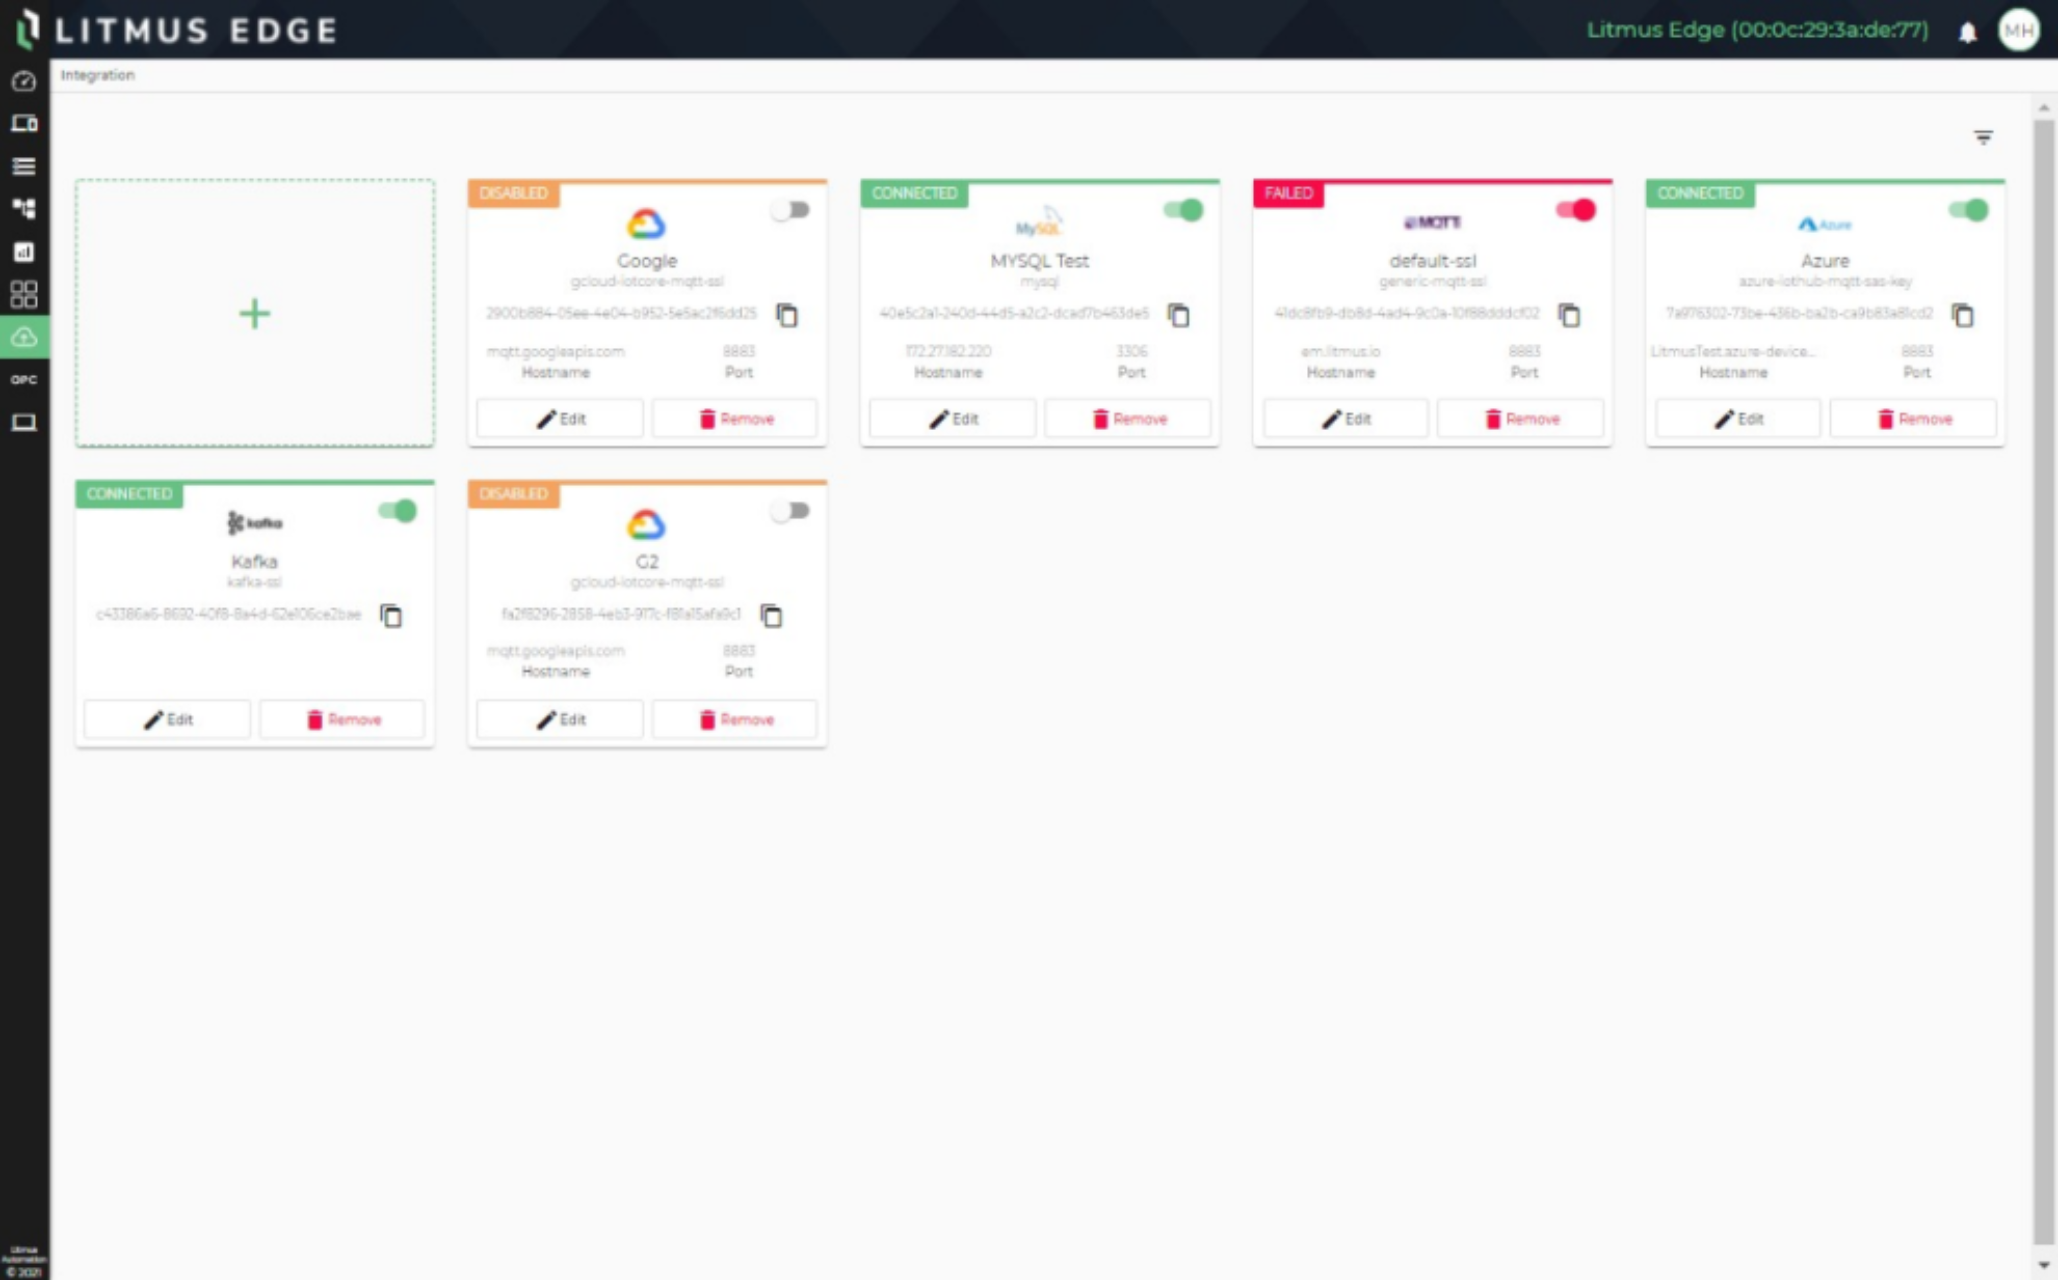
Figure 19. Integration dashboard on Litmus Edge
Data Flow on DVD for Manufacturing Edge with Litmus
A key solution feature is the Dell Streaming Data Platform. Litmus Edge leverages integration to persist data to SDP, so while local data is stored on InfluxDB on Litmus Edge, any data requiring maintenance over time is persisted to the platform. Any data outputs from the analytical functions within Litmus Edge are also persisted to SDP, as shown in the following figure:
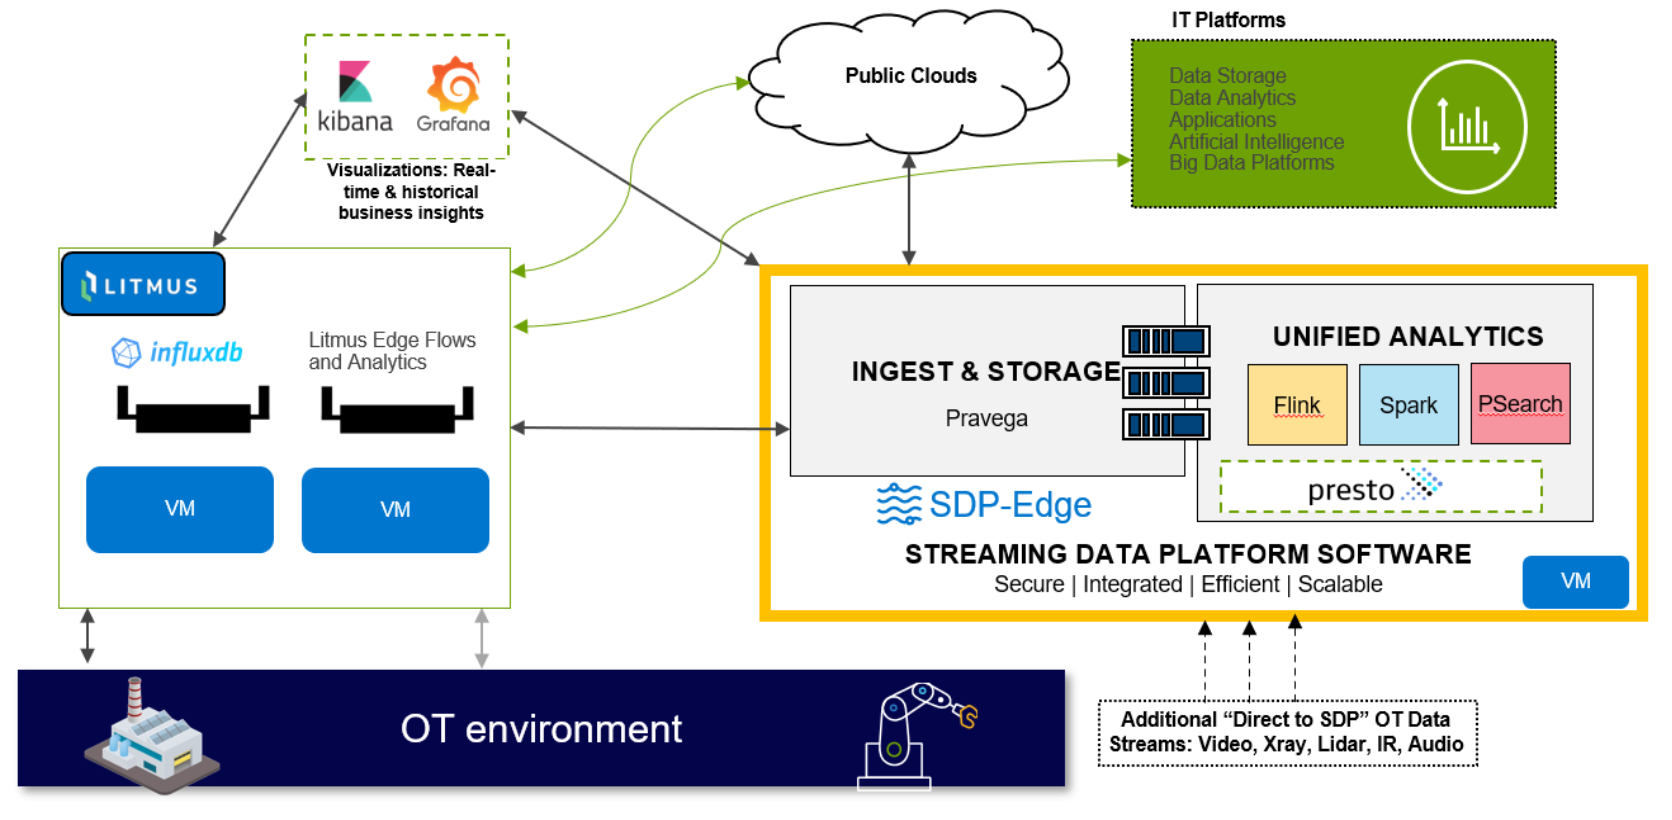
Figure 20. Unifying data with DVD for Manufacturing Edge with Litmus solution