

Assets

Scaling Edge Telemetric Near-Time Data Processing with Dell Streaming Solution
Tue, 20 Aug 2024 00:06:43 -0000
|Read Time: 0 minutes
Introduction
In today’s fast-paced digital world, enterprise storage, servers, networks, and other IT infrastructure devices of Dell Technologies play a crucial role in maintaining smooth operations. These devices are configured to send telemetry and alert files, generating billions of messages daily from millions of edge-connected devices. This telemetric data is essential for remote issue analysis, diagnostics, and preventive maintenance, ensuring that Dell Technologies meets its support Service Level Agreements (SLAs) and resolves issues faster. Also, this data also provides valuable insights into customer usage and feature value analysis.
Background information
Choosing the right technology is the key to success. Any delay in processing this data impacts billing costs to customers and affects the revenue of Dell Technologies. The IoT use case of Dell Technologies is uniquely challenging due to the scale and accuracy that is required to maintain processing time. Event processing with the publish-subscribe principle of Kafka serves as the central nervous system of the IoT solution.
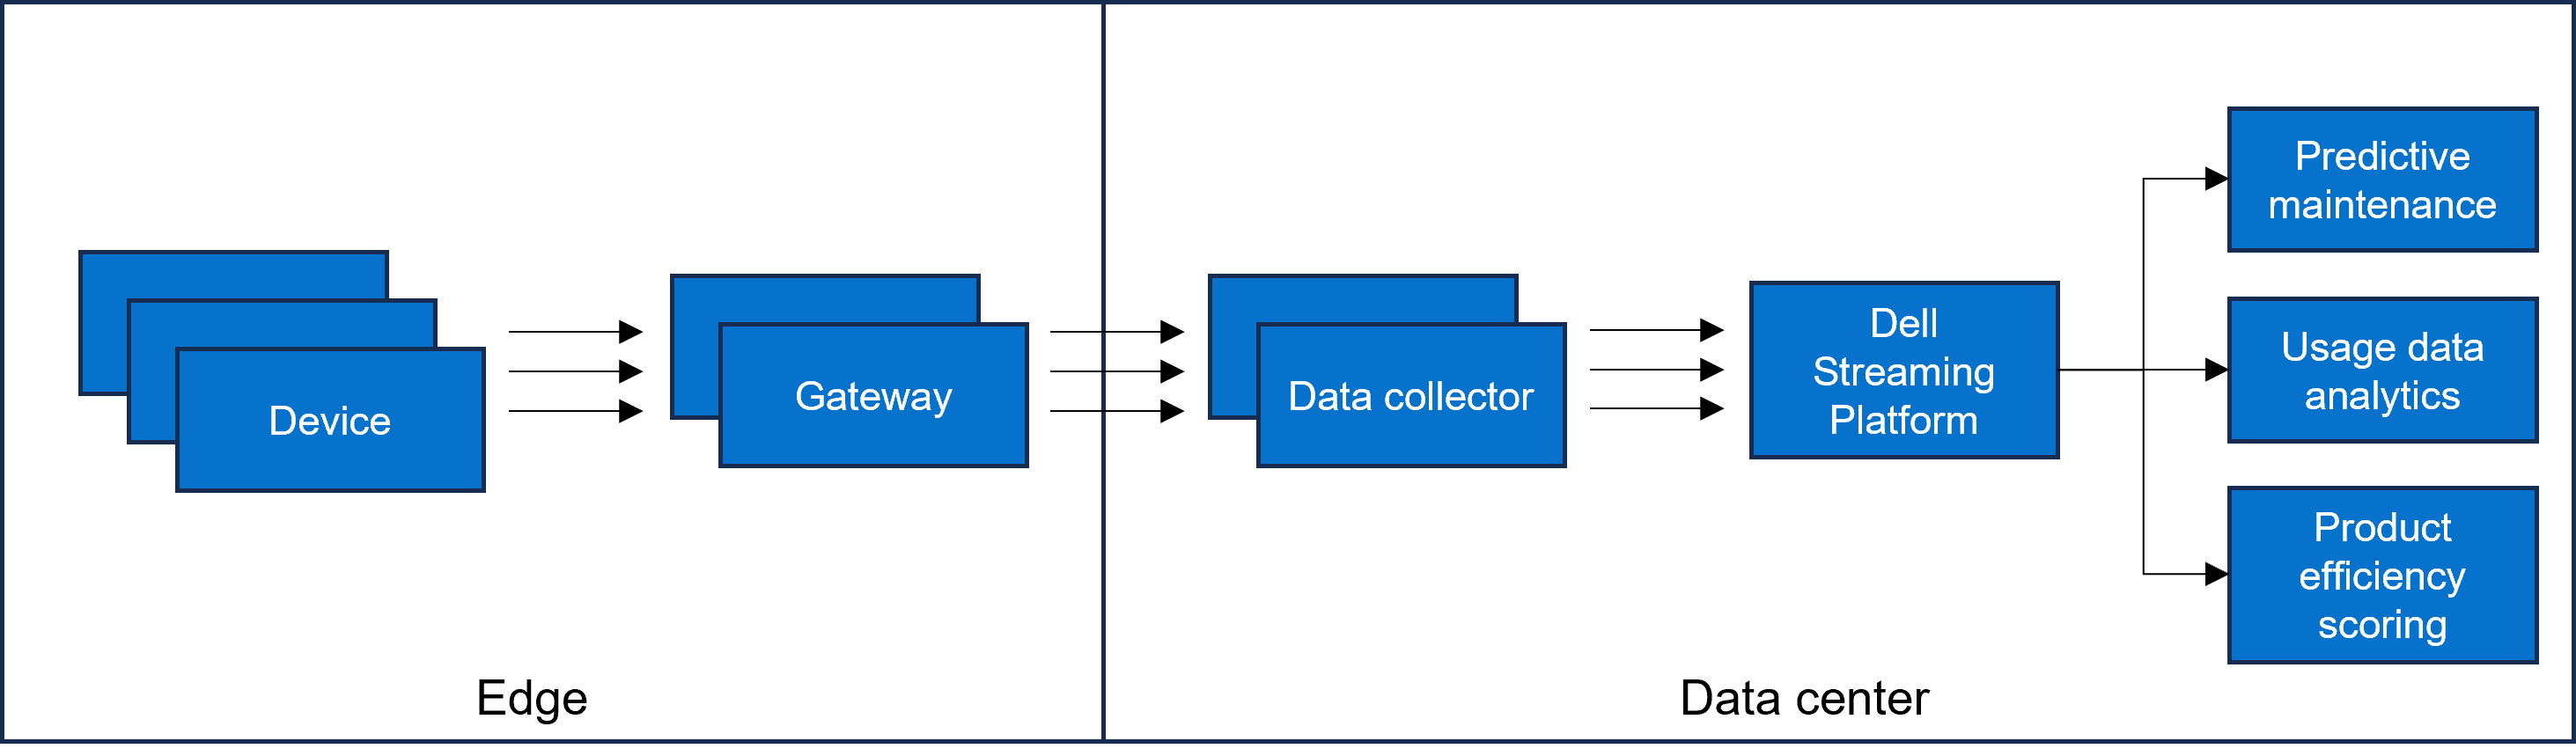 Figure 1: Data flow
Key design factors
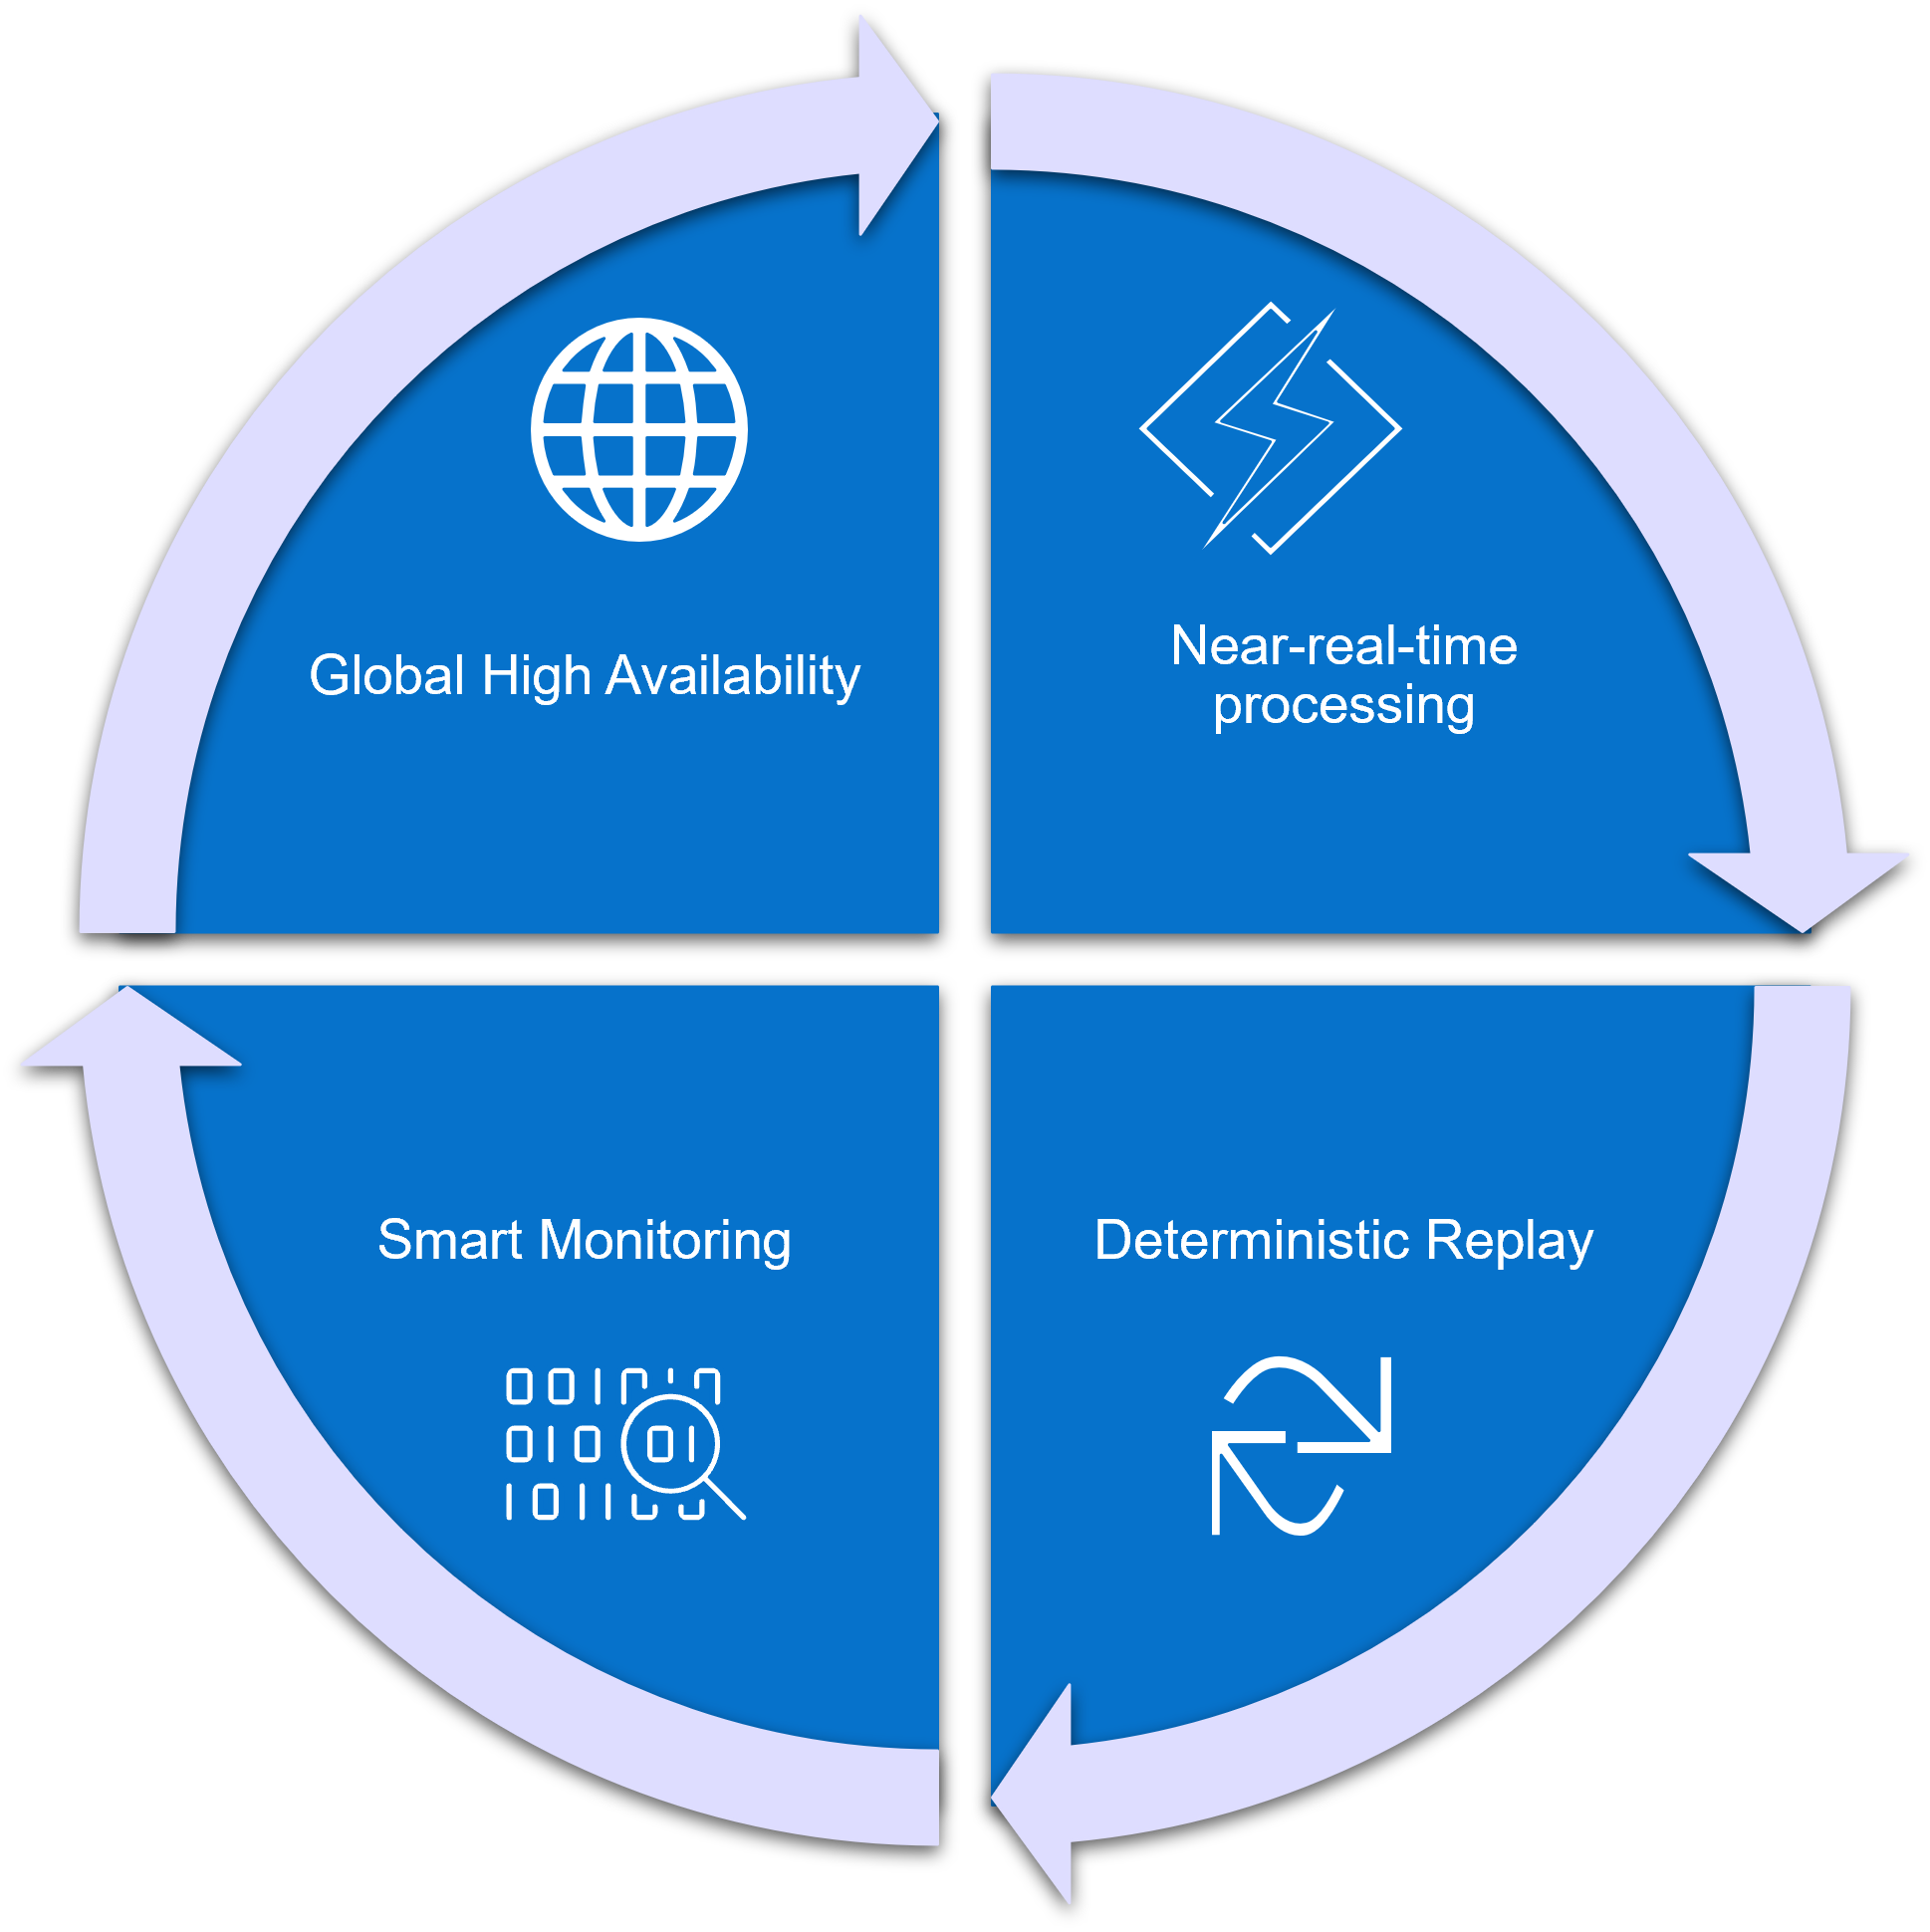
Figure 2: Features to solve the telemetric system need
The Dell Technologies Kafka platform is uniquely positioned to solve the needs of the telemetric system by providing:
- Global high availability
- Near-real-time processing
- Deterministic replay
- Smart monitoring, offering a single pane of glass view into the system health.
Global high availability
Platform availability with no data loss is vital. A multiregion active/active deployment model of the Dell Streaming Solution ensures high availability across different zones, decreasing Recovery Point Objective (RPO) and Recovery Time Objective (RTO). For messages that cannot tolerate elapsed time during any node, infrastructure, or region failure, synchronous replication across regions is configured. Publisher applications are configured with acknowledgment to all to ensure that messages are replicated and committed to several Kafka nodes to receive a successfully committed response.
Near-real-time processing
Near-real-time processing with low latency and high throughput, without compromising on persistence, is another key objective of the telemetric solution. It uses Kafka platform as a transient store where applications publish and subscribe to data topics. While some default parameters for Kafka brokers and client applications are optimized for low latency, network latency often contributes positively to latency impact. Tuning network throughput by increasing network threads and replica fetcher threads reduces overall latency. Latency and throughput vary with the workload and must be benchmarked to determine the optimal number of threads for each use case.
In typical scenarios, client applications may run on a VM or cloud platform and could potentially go down. If any consumer application fails, it triggers a rebalance among the remaining Kafka consumers to take over the task. This rebalancing event stops message consumption, which is undesirable if the failed consumer application automatically recovers quickly. Allowing a grace period for unsuccessful applications enables healthy consumers to continue processing without interruption. Adjusting session.timeout.ms and heartbeat.interval.ms settings provide an appropriate balance for efficiently managing these scenarios.
Other parameters tuned to optimize speed include max.poll.records and max.poll.interval.ms. max.poll.records defines the number of messages that are fetched in a single poll, while max.poll.interval.ms is the time allowed for the consumer to process these messages.
On the Kafka publisher side, adjusting linger.ms and batch size improves throughput. linger.ms is the delay time before sending out the next batch of messages.
Deterministic replay
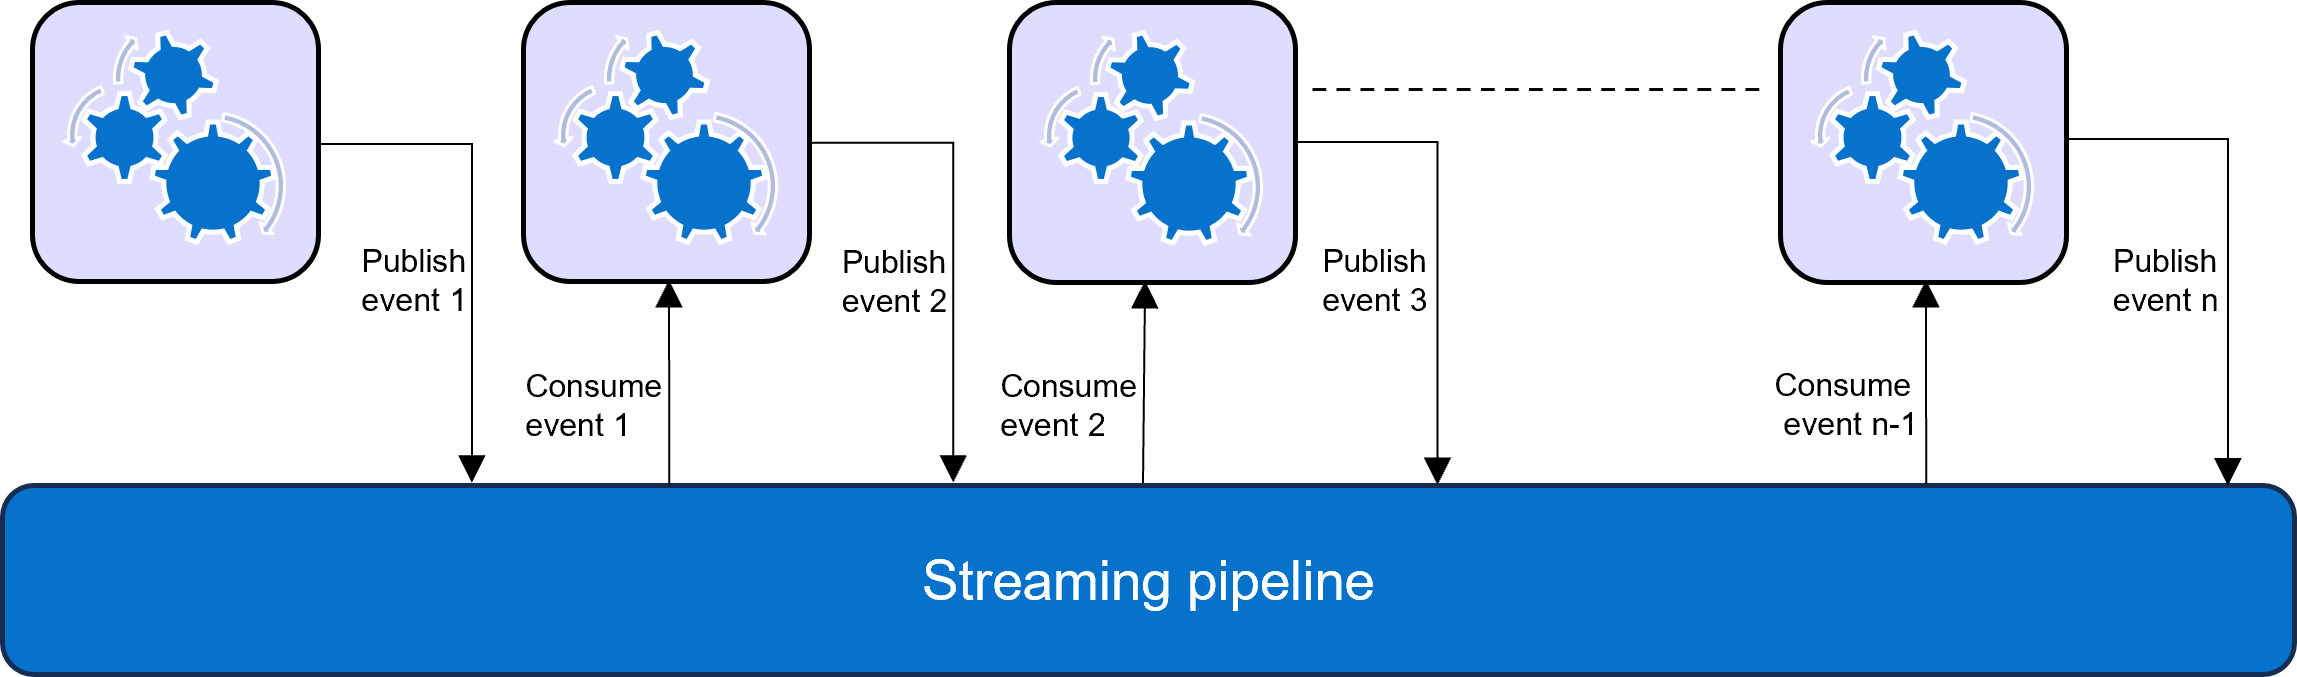
Figure 3: Event processing workflow in a Streaming pipeline
Kafka, as an event streaming platform, is core to building any event pipeline where a consumer application consumes a message, processes it, and publishes another event, which is then managed by the subsequent event processor. If a failure occurs at any level along the pipeline, the process can be replayed from a recovery point. There is no randomness that is involved, as the event processor automatically replays from the last successful event.
Smart monitoring
Monitoring is essential for a stable platform. It collects data from the servers, processes, and platforms to provide a picture of availability, performance, and resource efficiency. Tools like Prometheus, Grafana, Alert Manager, and Node Exporter are used to build monitoring, observability, and alerting around the system. This setup provides a single holistic dashboard view with drill-down capabilities on each component, enabling prediction of future states and resolution of issues before they become critical. Kafka node metrics, resource utilization, process status, process utilization, message traffic, network saturation, connection latency, error rate, and other data are collected to offer useful horizontal and vertical system visibility.
Alert rules are defined to detect any anomaly, sending notifications to act appropriately to prevent any failure. Integration with Dynatrace provides impressive visibility with multilevel tracing of any message flow.
Conclusion
Processing edge telemetric near-real-time data at scale with Kafka enables Dell Technologies to provide modernized service and support to its clients in 180 countries through continuous monitoring and a data-driven approach. This helps develop insights to identify priority actions and maintain better health of the IT environments of the clients.

Bringing Efficiency to Dell Business with RabbitMQ Messaging Self-Service
Mon, 23 Oct 2023 16:07:34 -0000
|Read Time: 0 minutes
RabbitMQ messaging platform is widely used in Dell Digital to connect various distributed heterogeneous applications at scale. It provides a common platform to exchange messages between producing applications and consuming applications.
Providing a ready-to-use, production-grade RabbitMQ messaging platform to application developers requires wiring up various services from multiple departments across Dell Digital. Traditionally, to avail a RabbitMQ platform, an application developer triggers the process by submitting a ticket to the messaging platform team, and a series of manual processes kicks off for services (such as VM provisioning, RabbitMQ setup, load balancer, security configuration, and monitoring). Each of these touchpoint interfaces could again have an internal dependency on other systems to fulfill their service. Each of these service interfaces must maintain the requester/developer information as part of the fulfillment service to the respective datastore. If there are any challenges to understanding the request from the requester, it might end up with lengthy email conversations to record the fulfillment process. Overall, the ticket-based approach to delivering a service to end users is not only inefficient but also time-consuming. The entire flow of activities can take an estimated 3 to 4 weeks to complete. The ability to fulfill the service quickly and seamlessly becomes indispensable for a large organization like Dell with a developer workforce of about 4000.
So, how did we streamline the fulfillment process flow?
The answer is implementing a smart workflow. With a charter to provide Platform as a Service (PaaS) for RabbitMQ, once a request is accepted, the messaging team owns the entire process chain.
Transforming such a manually intensive process flow into a fully automated self-service solution is not only exhilarating but also a modernization journey in to provide an exceptional user experience. The RabbitMQ cloud self-service provisioning portal is a unified and integrated solution that enables data center resources, installs required software, and configures various features to provide a ready-to-use RabbitMQ messaging platform. It provides a complete end-to-end solution, delivering a seamless experience to developers. There is no dependency on any team to avail service, resulting in less friction and thus improving overall efficiencies, including cost and time savings.
We followed the Saga architecture pattern to manage this complex process flow across heterogeneous distributed systems while maintaining data consistency. We broke down the process into multiple stages, with each stage that is further divided into smaller manageable steps. Each stage corresponds to a call to a service-providing system performed in a coordinated manner to complete the whole process. These stages are designed to be idempotent, meaning they can be safely retried if a failure occurs. This is especially important in distributed systems where the processing time of different services or processes may vary. This approach allows asynchronous processing allowing greater concurrency and performance.
What do we provide to our customers?
We offer developers self-service access to on-demand enterprise-ready RabbitMQ clusters hosted on a VM or in a private cloud curated with a predefined service catalog. The service catalog enlists essential service features including the price that is associated with each item. We standardized the landscape of the service provisioning by the size of the cluster, hosting platform, platform capacity, and high availability. Users browse the catalog, learn about the service offering from the description, and launch it all on their own. The key Service Level Objective (SLO) for the RabbitMQ self-service is offering a scalable, resilient RabbitMQ platform through an intuitive portal with the availability of support documentation, accessibility to technical support channels, adherence to organizational security with data protection, and access controls.
What is our business value stream?
- Autonomy - Enable developers to provision and deprovision platforms at any time at their own pace by moving the control to the hands of the developers. They can focus on their core business implementation without worrying about resource availability. They can plan their business releases in a more deterministic manner. This autonomy helps increase developer productivity.
- 24/7 availability – RabbitMQ self-service operates around the clock regardless of any business hours. Developers and users can access this service from any time zone with uninterrupted access.
- Visibility – Real-time visibility and tracking of the service delivery progress.
- Stability – Improve stability and reduce manual errors with automation.
- Cost and time saving – Self-service significantly reduces operational costs by reducing manual work and provides significant time savings for both the application team and the RabbitMQ service owner. No more lengthy email exchanges, no need to continuously monitor ticket status, no need to wait for multiple platform owners to complete their tasks, no integration bottleneck, and no manual errors to revert. Thanks to these simplifications, the entire fulfillment process can be completed within 1.5 hours for “RabbitMQ platform hosting on VM” and within 10 minutes for “RabbitMQ platform hosting in Kubernetes container”. Previously, these processes would have required 3+ weeks.
How do we measure service quality?
We built observability by collecting various data points ranging from infrastructure, RabbitMQ platform, and applications. We created a dashboard with a bird’s eye view and an to examine the details separated by category. These details include platform uptime, latency, throughput, usage, platform growth, historical health, infrastructure usage, and I/O metrics to name a few. We have a proactive alerting mechanism to identify any potential issues before they create a major impact on the business.
The Dell self-service cloud portal has an integrated reporting feature that provides insight into key performance indicators across the entire self-service management spectrum, including RabbitMQ service. These KPIs include self-service failure rate, self-service adoption rate, platform provisioning time, and so on.
We continuously monitor and measure these metrics to uncover opportunity areas, service effectiveness, service quality, and customer satisfaction rates. The objective is to offer services to developers more effectively leading to increased efficiency and a better self-sustained Dell Digital ecosystem.
About the Author: Gitanjali Sahoo
Gitanjali Sahoo is the Senior Manager of the Application Messaging Platform under Cloud Platform Service. She led several automation implementations and PaaS capabilities to operate efficiently while sustaining the growth of the platform. In her current role, her core focus is delivering highly available, scalable, robust messaging platforms enabling PaaS capability and providing a seamless experience for Dell application teams.