
Assets

Financial Risk Assessment using Dell PowerEdge XE9680 Rack Servers with Eight NVIDIA H100 SXM5 80GB GPUs
Wed, 06 Mar 2024 21:08:57 -0000
|Read Time: 0 minutes
Equipped with Intel 4th Gen Intel® Xeon® Scalable processors and NVIDIA H100 SXM5 80 GB GPUs, the Dell PowerEdge XE9680 rack server delivers unparalleled performance acceleration, energy efficiency, and the quickest return on investment.
This server provides scalable and high-performance parallel GPU computing capabilities. It also increases application processing speed and optimizes energy efficiency for both compute and memory-intensive applications.
The PowerEdge XE9680 also aims to support various application domains such as Generative AI, deep learning, machine learning, finance computing, and traditional high-performance computing workloads. On top of being a 6U form factor server, the XE9680 is Dell Technologies’ first 8x GPU platform, including the following advanced features and capabilities:
- 2x 4th Intel® Xeon® Scalable Processors with up to 56 cores per processor
- 32 DDR5 DIMM slots, supporting RDIMM 4 TB memory max, with speeds up to 4800 MT/s
- 8x NVIDIA H100 80GB 700W SXM GPUs or 8x NVIDIA A100 80GB 500W SXM GPUs
- Up to 10 x16 Gen5 (x16 PCIe) full-height, half-length
- 8 x 2.5 in. NVMe/SAS/SATA SSD Slots (U.2) and NVMe BOSS-N1 RAID controller
STAC/A2 Benchmark Testing
Performance engineers at the Dell HPC and AI Innovation Lab recently performed tests on the PowerEdge XE9680 Server using the STAC-A2™ benchmark. This benchmark is the industry standard for testing technology stacks for compute and memory-intensive analytics in pricing and risk management. STAC-A2™ generates performance, throughput, hardware scalability, test quality, and energy efficiency reports of any technology stack capable of handling the workload. This includes Monte Carlo estimation of Heston-based Greeks for a path-dependent, multi-asset option with early exercise. The results of the performance testing were formally verified, validated, and approved by the STAC organization for publication.
Performance results
In the STAC-A2 performance benchmark test, the PowerEdge XE9680 was equipped with eight of NVIDIA's latest H100 80GB SXM5 GPUs. Dell’s HPC and AI Innovation Lab compared this result to three other recent STAC-A 2 results using GPU acceleration technologies. The comparison summary is shown in the following charts and table.
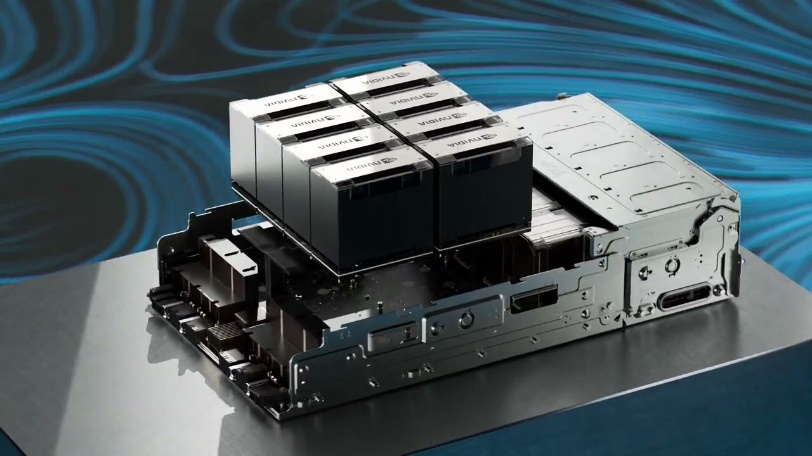
Figure 1. PowerEdge XE9680 rack server 8x NVIDIA H100 GPUs
In 2024, the PowerEdge XE9680 server claimed five new STAC-A2 pricing and risk management performance benchmark records, including:
- Processing speed throughput
- Baseline Greeks benchmarks
- The large Greeks benchmarks
- Workload processing capacity
- Energy efficiency
Processing speed throughput
This metric measures the ratio of options completed to elapsed time. Dell has set the record for the highest throughput in options per second.
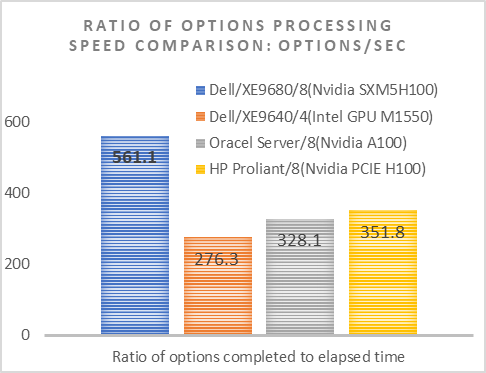
Figure 2. Throughput of options processing speed comparison
Baseline Greeks benchmarks
This metric describes the number of seconds to compute all Greeks with five assets, 25 K paths, and 252 timesteps. Dell has set the record for the fastest warm restart run time in the Baseline Greeks benchmarks.
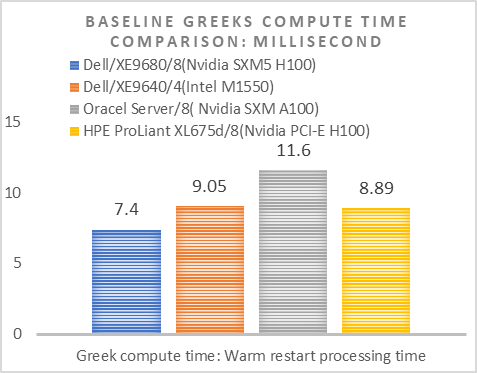
Figure 3. Baseline Greeks benchmarks Warm Run Time comparison
The large Greeks benchmarks
The number of seconds to compute all Greeks with ten assets, 100 K paths, and 1260 timesteps. Dell set the record for both the fastest warm restart run time and cold restart run time.
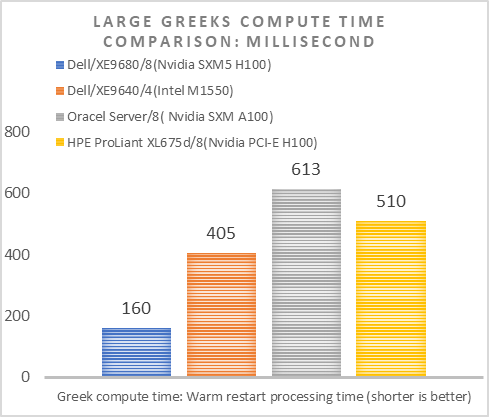
Figure 4. Large Greeks benchmarks Warm run time comparison
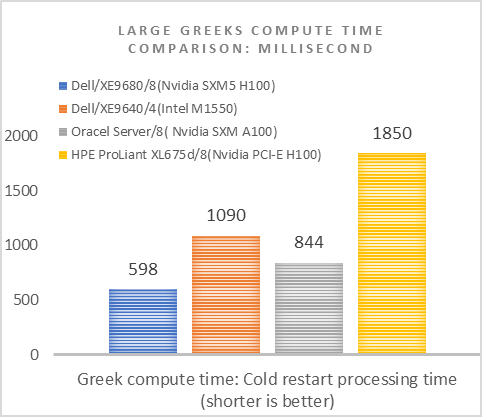
Figure 5. Large Greeks benchmarks Cold run time comparison
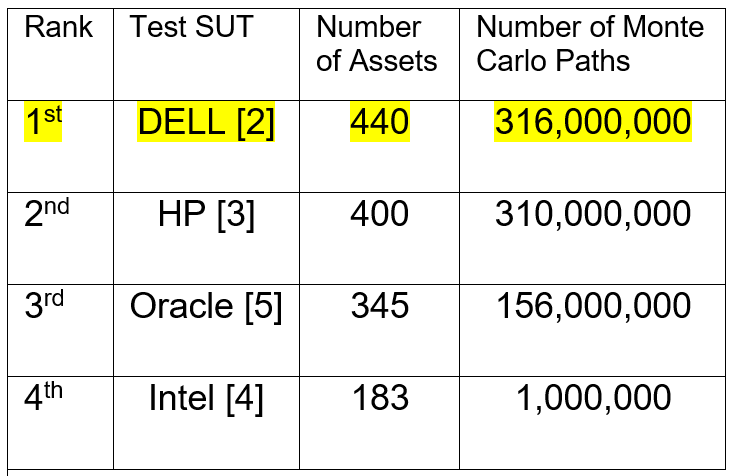
Workload processing capacity
This benchmark describes the most correlated assets and Monte Carlo paths simulated in 10 minutes. Dell achieved the highest processing capacity record for assets and number of Monte Carlo paths.
Table 1. Workload processing capacity comparison
Energy efficiency
Energy efficiency measures the energy consumed. This measurement is the sum of one-second Watt readings over the HPORTFOLIO processing sequence and adjusted for shared HW/SW resources. Dell has set the record for the best energy efficiency in options per KHW.
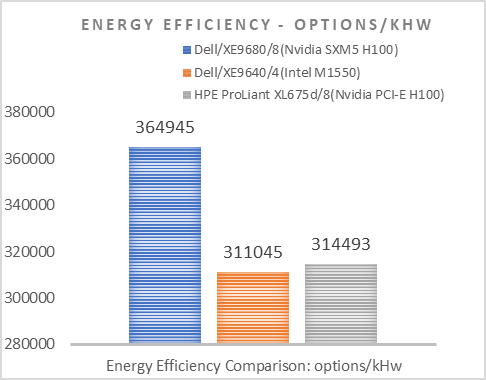
Figure 6. Energy efficiency comparison
Additional resources
- Dell Validated Design for Financial Risk Assessment
- STAC/A2 Finance Price and Risk Management performance benchmark
- Dell with NVIDIA H100 SXM5 GPUs under STAC-A2 (derivatives risk)
- STAC-A2 (derivatives risk) on NVIDIA H100 80GB in HPE ProLiant XL675d Gen10 Plus
- Intel GPUs under STAC-A2 (derivatives risk)
- Oracle Cloud Infrastructure with NVIDIA SXM4 A100 GPUs under STAC-A2 (derivatives risk)