
Assets

Understanding InsightIQ 5.0.0 Deployment Options: Simple vs. Scale
Mon, 11 Dec 2023 16:32:33 -0000
|Read Time: 0 minutes
Overview
InsightIQ 5.0.0 introduces two distinct deployment options catering to varying scalability needs: InsightIQ Simple and InsightIQ Scale. Let's delve into the overview of both offerings to guide your deployment decision-making process.
InsightIQ Simple
Designed for the straightforward deployment and moderate scalability, IIQ Simple accommodates up to 252 nodes or 10 clusters. Here's a snapshot of its key requirements:
- Target Use Case: Simple deployment scenarios with moderate scaling requirements.
- Deployment Method: VMware-based deployment using the OVA template.
- OS Requirements: ESXi 7.0.3 and 8.0.2.
- Hardware Requirements: VMware hardware version 15 or higher, requires a CPU of 12 vCPU, 32GB memory, and 1.5TB disk space.
InsightIQ Scale
For organizations demanding extreme scalability, IIQ Scale steps in, supporting up to 504 nodes or 20 clusters, with potential expansion post IIQ 5.0. The details include:
- Target Use Case: Extreme scalability requirements.
- Deployment Method: RHEL-based deployment utilizing a specialized deployment script.
- OS Requirements: RHEL 8.6 x64.
- Hardware Requirements: Three virtual machines or physical servers, each with a configuration of 12 vCPU, 32GB memory, and specific storage options based on the chosen datastore location.
Here is the summary table:
InsightIQ Simple | InsightIQ Scale | |
Target Use Case | Simple deployment and moderate scalability – up to 252 nodes or 10 clusters | Extreme scalability – up to 504 nodes or 20 clusters (more in post-5.0) |
Deployment Method | On VMware, using OVA template | On Red Hat Enterprise Linux (RHEL) system, using an installation script |
OS Requirements | ESXi 7.0.3 and 8.0.2 | RHEL 8.6 x64 |
Hardware Requirements | VMware hardware version 15 and higher –
| Compute: 3 virtual machines or physical servers, with each VM or server having:
Storage:
|
Networking Requirements | 2 static IPs on the same network subnet, with PowerScale cluster connectivity | 4 static IPs on the same network subnet, with PowerScale cluster connectivity |
Leveraging the NFS export
In InsightIQ deployments, leveraging an NFS export for the datastore, whether from a PowerScale cluster or a Linux NFS server, can significantly enhance scalability. However, to ensure a seamless setup, specific prerequisites must be addressed:
Access and Permissions:
- Guarantee accessibility of the NFS server and export from all servers/VMs where InsightIQ is deployed. This accessibility is crucial for uninterrupted data flow.
- Set read/write permissions (chmod 777 <export_path>) to ensure unrestricted access for all users utilizing the NFS export.
Security Measures:
- Root User Mapping: Avoid mapping the root user (no_root_squash) to maintain secure access control.
- Mount Access: Enable mount access to subdirectories for streamlined data retrieval and utilization.
Resource Allocation:
- Allocate a substantial 1.5TB for the NFS export, ensuring ample space for data storage and future scalability.
- Allocate 200GB free space on the root partition ("/") of all servers/VMs hosting InsightIQ.
By ensuring compliance with these guidelines, organizations can unlock the full potential of InsightIQ while maintaining a robust and reliable infrastructure.
IIQ 5.0.0 Support Matrix
A concise summary detailing supported OneFS versions, host OS, recommended client display configurations, and browser compatibility for both IIQ Simple and IIQ Scale deployments.
InsightIQ uses TLS 1.3 exclusively. A web browser without TLS 1.3 enabled or supported cannot access InsightIQ 5.0.0.
InsightIQ Simple | InsightIQ Scale | |
PowerScale OneFS | From OneFS 9.2.0.0 to 9.5.x, OneFS 9.7.x | |
Host OS | ESXi 7.0.3 and 8.0.2 | RHEL 8.6 x64 |
Recommended Client display configuration |
| |
Supported Browser | Chrome (recommended) Mozilla Firefox Microsoft Edge | |
Summary
Unlocking the full potential of InsightIQ 5.0.0 is a journey that begins with a clear understanding of deployment options and their prerequisites. Embracing your organization's scalability needs and infrastructure nuances ensures a seamless

Mastering Monitoring and Reporting with InsightIQ 5.0.0
Mon, 11 Dec 2023 16:32:33 -0000
|Read Time: 0 minutes
Overview
In the complex landscape of data management, having robust tools to monitor and analyze your data is paramount. InsightIQ 5.0.0 is your gateway to exploring the depths of historical data sourced from PowerScale OneFS. By leveraging its capabilities, you can monitor cluster activities, analyze performance, and gain insights to ensure optimal functionality.
Monitoring Clusters with Dynamic Dashboard
The InsightIQ Dashboard stands as a central hub for monitoring all your clusters, offering a comprehensive overview of their statuses and vital statistics. The dashboard facilitates quick interpretation of data and the action-based navigation links allow you to easily check on the observed statuses.
Here's a breakdown of the essential sections within this powerful monitoring interface:
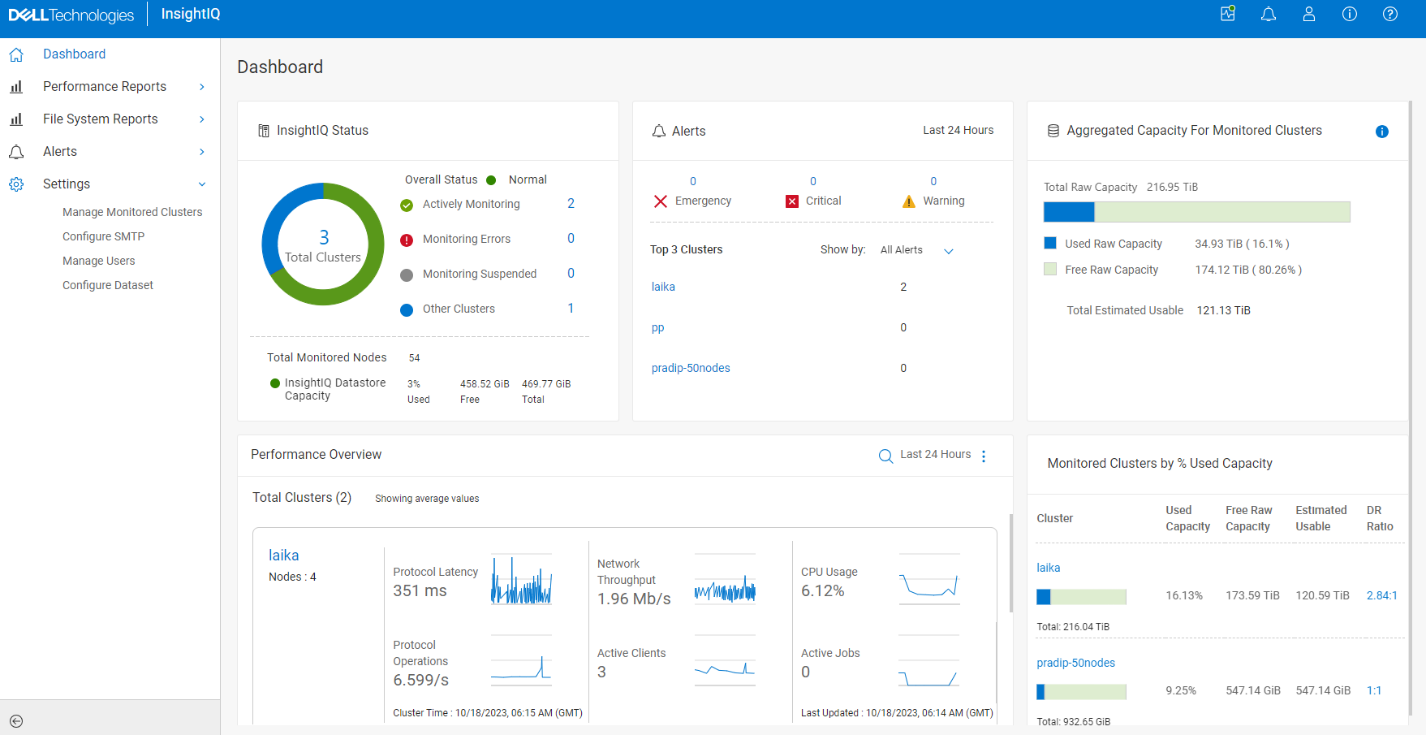
Figure 1 IIQ Dashboard
InsightIQ Status
This section provides an overview of connected clusters, highlighting monitoring errors and any suspended monitoring activities. The InsightIQ Status icons offer a quick assessment of the monitored clusters: green signifies active monitoring, red indicates monitoring errors, grey denotes suspended monitoring or incomplete credentials. There is a fourth status icon. Blue indicates the number of PowerScale clusters whose status is outside of green, red, or grey status values. This is typically due to an internal error.
Additionally, the InsightIQ Datastore Usage icons provide insights into datastore health, with green indicating health, yellow signaling near-full capacity, and red alerting that the datastore has reached its maximum limit.
Alerts
The Alerts section within InsightIQ is a pivotal area displaying crucial data accumulated over the past 24 hours, categorized by severity—emergency, critical, warning, and information. This section shows the top three clusters with the highest number of alerts, granting immediate visibility into potential issues impacting PowerScale clusters. The dashboard offers a swift way to access the 'Alerts' section, where you have the capability to create alerts, defining Key Performance Indicators (KPIs) and thresholds, easily viewable on the dashboard for prompt action. This comprehensive alert system ensures timely responses to potential issues.
Aggregated Capacity for monitored clusters
Get insights into the used and free raw capacity across monitored clusters, as well as the estimated total usable capacity.
Performance Overview
This section presents average values for critical performance metrics like protocol latency, network throughput, CPU usage, protocol operations, active clients, and active jobs, displaying changes in statistics over the past 24 hours. It also offers a convenient link to navigate to the 'View Performance Report', facilitating in-depth analysis across various metrics.
Monitored Clusters by % Used Capacity
This detailed breakdown showcases used capacity, free raw capacity, estimated usable capacity, and data reduction ratio for each monitored cluster. While it doesn't offer historical data, it provides real-time insights into the present cluster status. It offers quick navigation links to access both Capacity Reports and the Data Reduction Report for easy reference.
Performance and File System Reports
The heart of InsightIQ lies in its ability to provide detailed performance reports and file system reports. These reports can be standardized or tailored to your specific needs, enabling you to track storage cluster performance efficiently. You also have the flexibility to generate Performance Reports as PDF files on a predefined schedule, enabling easy distribution via email attachments.
InsightIQ reports are configured using modules, breakouts, and filter rules, providing a granular view of cluster components at specific data points. By employing modules and applying breakouts or filter rules, users can focus on distinct cluster components or specific attributes across the entire report. This flexibility allows the creation of tailored reports for various monitoring purposes.
Harnessing detailed metrics and insights empowers decision-making for crafting insightful performance reports. For instance, if network traffic surpasses anticipated levels across all monitored clusters, InsightIQ enables the creation of customized reports displaying detailed network throughput data. Analyzing direction-specific throughput assists in pinpointing any specific contribution to the overall traffic, aiding in precise troubleshooting and optimization strategies.
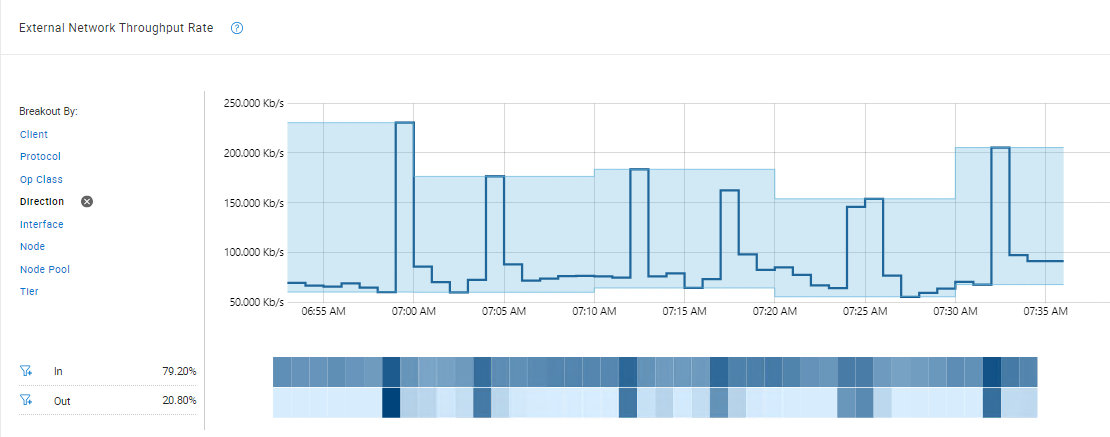
Figure 2 Sample Cluster Performance Report
Partitioned Performance
The Partition Performance report presents data from configurable datasets, offering insights into the top workloads consuming the most resources within a specific time range. Key data modules include: Dataset Summary, Workload Latency, Workload IOPS, Workload CPU Time, Workload Throughput, and Workload L2/L3 Cache Hits.
For more detailed information, users can focus on modules by average, top workload by max value, or pinned workload by average.
Note: access to the Partition Performance Report, the InsightIQ user on the PowerScale cluster needs ISI_PRIV_PERFORMANCE with read permission. If unable to view the report, contact the InsightIQ admin or refer to the Dell Technologies InsightIQ 5.0.0 Administration Guide for permission configuration.
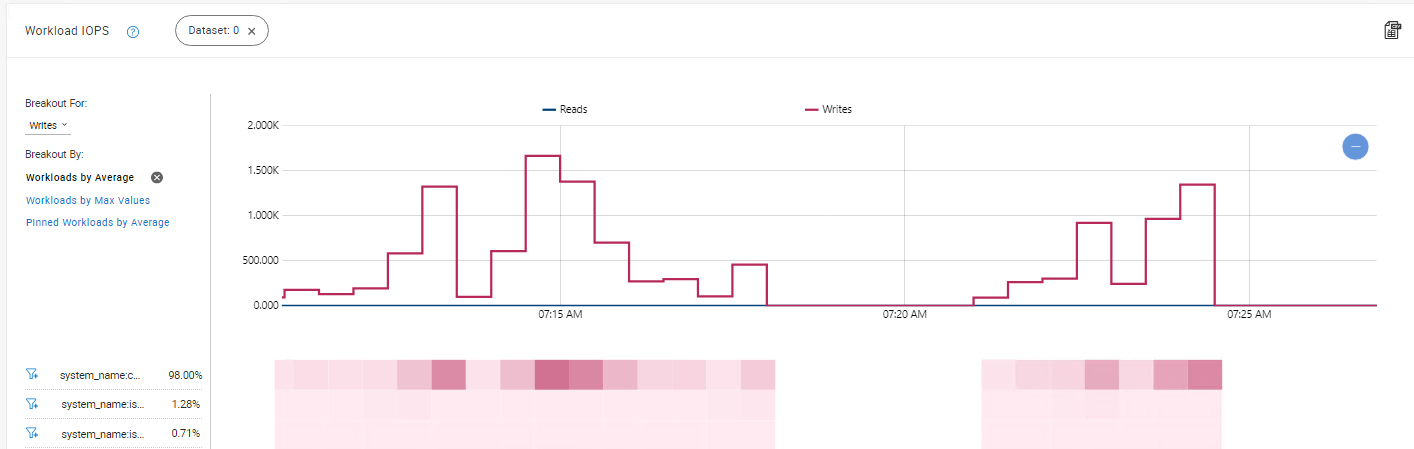
Figure 3 Sample Partitioned Performance Report
File System Analytic Report
File System Analytics (FSA) reports offer a comprehensive overview of the files stored within a cluster, providing essential insights into their types, locations, and usage.
InsightIQ supports two key FSA report categories:
- Data Usage reports focus on individual file data, revealing details like unchanged file durations.
- Data Property reports offer insights into the entire cluster file system, showcasing data such as file changes over specific periods and facilitating comparisons between different timeframes.
These reports help in understanding relative changes in file counts based on physical size, offering nuanced perspectives for effective file system management. For instance, by comparing Data Property reports of different clusters, you can observe patterns in file utilization—identifying clusters with regular file changes versus those housing less frequently modified files. Detecting inactive files through Data Usage reports facilitates efficient storage archiving strategies, optimizing cluster space.
These reports also play a pivotal role in verifying the expected behavior of cluster file systems. For example, dedicated archival clusters can be monitored using Data Property reports to observe file count changes. An unexpectedly high count might prompt storage admin to consider relocating files to development clusters, ensuring efficient resource utilization.
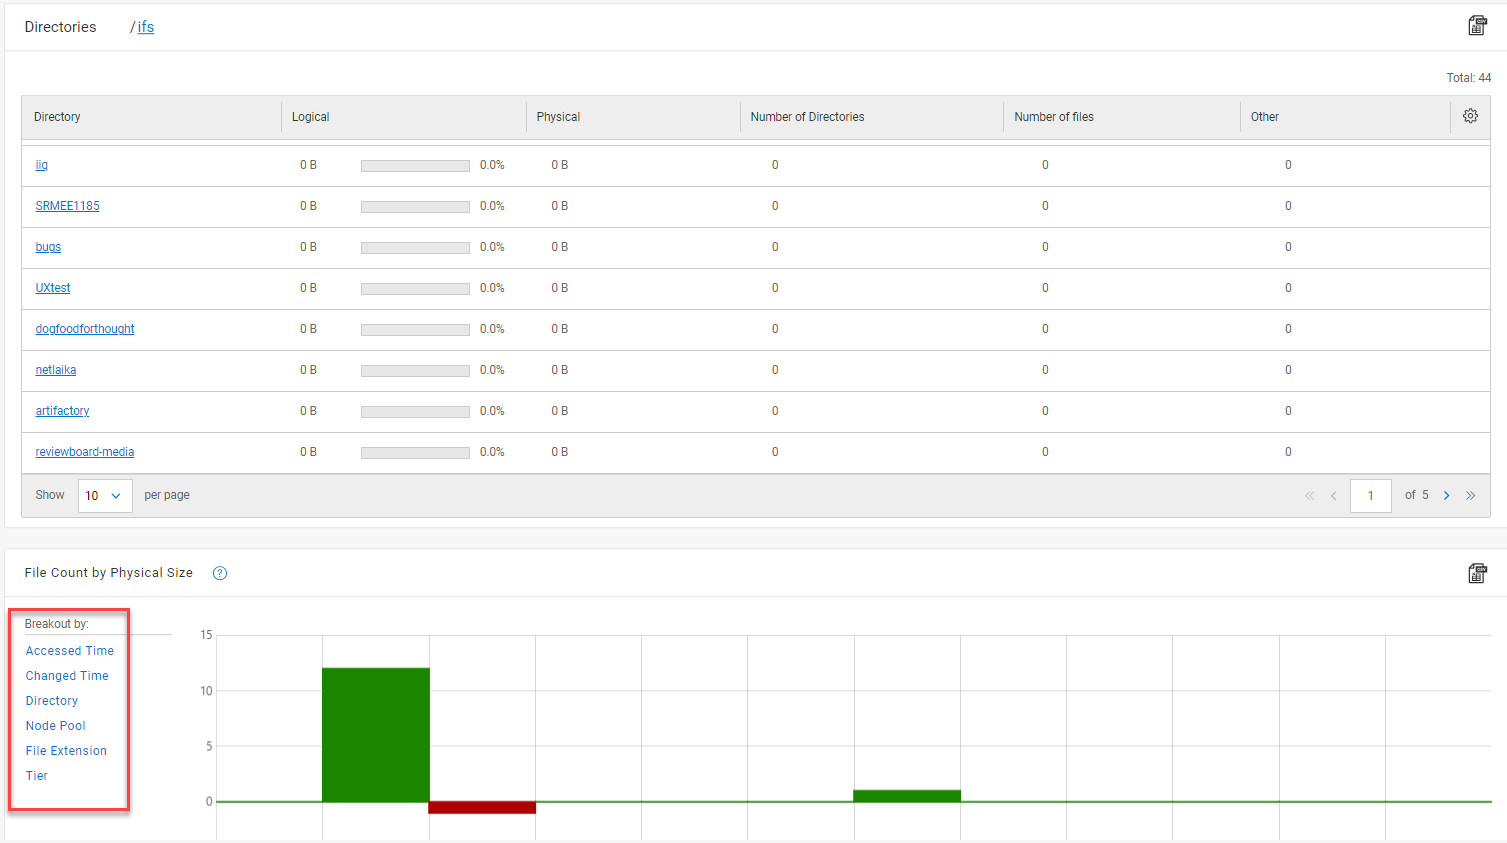
Figure 4 Data Properties Report
These FSA reports within InsightIQ not only provide visibility into cluster file systems but also serve as strategic tools for efficient storage management and troubleshooting unexpected discrepancies.
Conclusion: Empowering Data Management
InsightIQ isn't just a monitoring tool. It's a comprehensive suite offering a multitude of functionalities. It's about transforming data into actionable insights, enabling users to make informed decisions and stay ahead in the dynamic world of data management. The robust features, customizable reports, and analytics capabilities make it an invaluable asset for ensuring the optimal performance and health of PowerScale OneFS clusters.